
ABSTRACT
Dielectric barrier discharge (DBD) and spark discharge, two versatile atmospheric pressure plasma-based techniques, have been employed to generate nanoparticles. This study compares the characteristics of metal nanoparticles generated by a DBD reactor and a spark discharge generator with argon as the working gas. The gas temperature in the discharge region of the DBD reactor remained near room temperature, while that of the spark reactor varied from 470 to 1120 K and generally increased with increasing applied voltage amplitude in the range of 2–10 kV and driving frequency in the range of 1–10 kHz. Comparing to spark-generated nanoparticles under the same voltage, frequency, and flow rate, DBD-generated nanoparticles have smaller sizes, better monodispersity, and lower number concentrations. The number concentration of DBD-generated particles decreases significantly under high working voltage and frequency, while the number concentration of spark-generated particles increases with increasing working voltage. Under continuous operations over several hours, the DBD reactor has better temporal stability in generating nanoparticles than the spark generator.
© 2017 American Association for Aerosol Research
EDITOR:
1. Introduction
Nano-scale aerosol particles have been intensively studied for decades, including their characterization (Jiang et al. Citation2007) and generation methods, such as combustion and furnace (Butler and Mulholland Citation2004; Dhumal et al, Citation2009; Okuyama et al. Citation1986), glowing wire (Peineke and Schmidt-Ott Citation2008; Schmidtott et al. Citation1980), laser ablation (Wen et al. Citation2007), electrospraying atomization (Jaworek Citation2007), and magnetic fluid spikes (Uehara et al. Citation2015). Plasma, especially non-thermal plasma at atmospheric pressure, has also been widely known as a practical method in nanoparticle generation (Borra Citation2008). Among various plasma methods, spark discharge has been widely investigated for nanoparticle and cluster generation (Borra Citation2006; Borra et al. Citation1998; Maisser et al. Citation2015; Rao et al., Citation1995; Schwyn et al., Citation1988). This technique is considered to be flexible, controllable, and potentially scalable for mass production (Mäkelä et al. Citation1992; Tabrizi et al. Citation2009b). However, irregular breakdown voltage and low working frequency (e.g., higher than 500 Hz) have limited its further development (Pfeiffer et al. Citation2014). Dielectric barrier discharge (DBD) has also been identified to be a promising plasma method in nanoparticle generation at atmospheric pressure with a wide range of utilizations (Borra Citation2008; Jidenko and Borra Citation2005). DBD reactors with various geometries and functions have been employed in powder production, coating, and filtration (Borra Citation2006).
Both DBD and spark nanoparticle generation depend on energy flux deposited by filamentary discharges on the electrode surface (Borra Citation2006, Citation2008; Borra et al. Citation2011, Citation2015). In DBD, one important way to form metal vapors is high energy ion bombardment and sputtering, which can produce metal vapors from an electrode surface into ambient gas (Laegreid and Wehner Citation1961). In spark discharge at atmospheric pressure, ion sputtering is not the dominant process for vapor formation (Borra Citation2008); the primary mechanism is thermal evaporation. Spark discharges on the electrode surface can rapidly heat the electrode to a high local and transient temperature, e.g., 20000 K (Reinmann and Akram Citation1997), at which electrode material is evaporated in the vicinity of the spark (Tabrizi et al. Citation2009). Nanoparticle nuclei can form from vapors and further grow through coagulation and condensation (Feng et al. Citation2016). The comparison between the two plasma techniques helps to understand plasma nanoparticle generation as well as to improve the performance of these techniques in industrial utilizations. However, a direct comparison of their generation processing and characteristics was rarely investigated. Additionally, temporal stability of plasma nanoparticle generation has rarely been reported previously (Chae et al. Citation2015).
This study reports direct comparison of nanoparticle generation by a spark reactor and a DBD reactor which uses a metal electrode as the source, i.e., producing particles directly from metal vapors generated by discharges on the electrode surface (Borra et al. Citation2011, Citation2015). The potential of DBD and spark discharge reactors to be used as stable aerosol generators in the nanometer size range was examined. Gas temperature in the discharge regions was characterized. Particle characteristics (e.g., particle concentration, size distribution, and monodispersity) under different applied voltages and frequencies are presented.
2. Method
2.1. DBD reactor and spark generator
Schematics of the DBD reactor and the spark generator are shown in (see Figure S1 in the online supplemental information [SI] for photographs). The DBD reactor is composed of a quartz tube and a copper band. The total length of the quartz tube is 120 mm and the inner diameter of its main body is 10 mm. The anode is a pure silver rod (99.9% purity, 1/8 in, Alfa Aesar, Ward Hill, MA, USA) inside the tube hung up by a thin copper string from the top, and the cathode is a grounded copper band (∼30 mm total width) surrounding the outer surface of the quartz tube. The discharge region is the cylindrical gap between the silver rod and the inner tube wall. The silver rod, being the source of metal vapor, was connected to a high voltage power supply that is composed of a waveform generator (33500B Series, Keysight Technologies, Santa Rosa, CA, USA) and a high voltage amplifier (Model 10/40A-HS, TRek, Lockport, NY, USA). The maximum output voltage amplitude of the power supply is 10 kV and the output frequency could be adjusted from DC to MHz. The working gas flow entered and left the DBD reactor from the inlet at the top and the outlet at the bottom, respectively.
Figure 1. Schematic of the DBD reactor (a) and the spark generator (b).
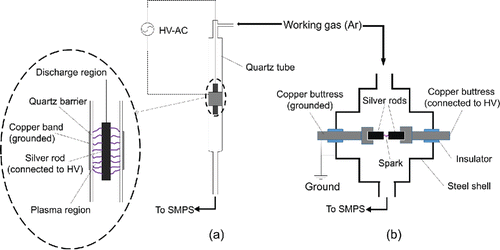
The spark generator consists of a stainless steel chamber about 300 cm3 in volume (Tabrizi et al. Citation2009a), in which two opposing cylindrical electrodes were mounted at an adjustable distance. In this spark generator, the same silver rods as that in the DBD reactor were used as electrodes with a distance of 0.9 mm between two electrodes. One of the electrodes was connected to the same high voltage power supply mentioned above, while the other was grounded. The discharge region in the spark generator was the gap between the two opposite silver rod electrodes. The gas flow entered and left the spark generator from the inlet and the outlet located on the other side, respectively.
The working gas in this experiment was high-purity Ar (99.999%). To obtain higher number concentration of the generated particles, the working gas flowrate was kept at 2.0 L/min for both systems by using mass flow controllers. Average gas flow velocities in the DBD reactor and the spark generator were approximately 0.4 m/s and 0.01 m/s, respectively. The average residence times in the DBD and the spark reactor chambers were 0.28 s and 9.0 s, respectively, while the residence times in the discharge regions were approximately 0.1 s and 0.3 s, respectively.
The variations of DBD and spark properties with changing applied voltage and frequency were examined. One of the two variables (voltage or frequency) was kept near its optimal condition while the other was changed during the experiment. The “optimal condition” is defined here as the operational conditions of voltage and frequency under which the highest nanoparticle number concentration is achieved ([6 kV, 1 kHz] for the DBD reactor and [10 kV, 10 kHz] for the spark generator, respectively). 0.5 kHz was used as the threshold to divide “low frequency” and “high frequency.”
2.2. Measurement
Particle size distributions in the outlet gas from the DBD reactor and the spark generator were measured by a scanning mobility particle sizer (SMPS 3936 including a soft X-ray neutralizer 3088, a nanoDMA 3085, and a UCPC 3776, TSI Inc., Shoreview, MN, USA). The gas temperature in discharge regions (optical emission regions) was obtained via fitting of optical emission spectra which were recorded by a spectrometer (AvaSpec-ULS2048-3-USB2, Avantes BV, Netherlands). The rotational band of OH (A-X transition) emission was used to evaluate the gas temperature (see Figure S2 in the SI), as widely used in atmospheric pressure plasma studies (Jidenko et al. Citation2010; Li et al. Citation2012). The OH band originates from trace water vapor in the inert working gas (Li et al. Citation2012; Navrátil et al. Citation2005). The voltage-current relationship of two discharge processes was measured by an oscilloscope (DPO 2024, Tektronix, Beaverton, OR, USA) and a current transformer (0.5 V/A, CT-C0.5-BNC, Magnelab, Longmont, CO, USA). Analysis using Transmission Electron Microscopy (TEM, JEM2100), coupled with Energy Dispersive Spectroscopy (EDS) was performed on collected nanoparticle samples.
3. Results and discussion
3.1. Influences of applied voltage and driving frequency
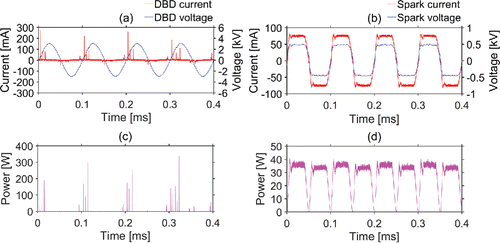
A comparison of the typical instantaneous applied voltage-discharge current for the DBD and spark reactors, along with the matched power-voltage curves, is illustrated in . The instantaneous current and voltage of DBD show behavior similar to those in previous reports (Li et al. Citation2012; Rajasekaran et al. Citation2010), in which streamers appear during the rising edge of the applied sinusoidal voltage on the DBD electrodes. The DBD is characterized by transient micro-discharges. Filaments in the first half-period are formed stochastically in space and in time, while the following filaments are rather homogeneously distributed on dielectric surface during each half-period (Akishev et al. Citation2011; Rajasekaran et al. Citation2010). There is obvious asymmetry of discharge current between positive and negative half periods of DBD, possibly owing to the asymmetry between the power electrode and the grounded electrode which was covered by larger size quartz (Golubovskii et al. Citation2002; Li et al. Citation2011). Since spark energy is more concentrated on a small area of surface rather than distributed over the electrode surface, the energy per each spark is higher than the energy per each filament in DBD (Borra Citation2008).
Figure 2. Typical instantaneous current and voltage of (a) the DBD reactor and (b) the spark generator during discharges under high frequency sinusoidal voltage, and the matched power-voltage curves of (c) the DBD reactor and (d) the spark generator. White noise around baseline is filtered out in power calculation. The average power over a period is 1.34 W and 28.46 W for the DBD and spark reactors, respectively. (The figure shows the working voltages between the electrodes, while the applied voltages from the power source is Vpeak-peak = 6 kV, the applied frequency is f = 10 kHz.)
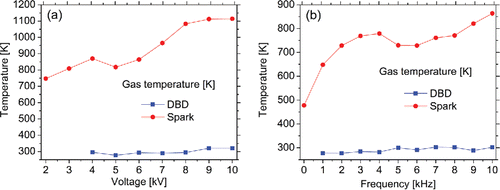
shows the influence of applied voltage and driving frequency on the gas temperature in the discharge regions of the DBD reactor and the spark generator. The gas temperature in the spark generator (470-1120 K) was much higher than that in the DBD reactor (near room temperature). These are consistent with previously reported DBD rotational temperature (Jidenko et al. Citation2010; Li et al. Citation2012; Motret et al. Citation2000) and the gas temperature distribution in a spark jet measured by a thermocouple (Barni et al. Citation2014). In the spark discharge, the electrode and the ambient gas are heated by spark currents through Joule heating and ion impact heating, which can locally heat the electrodes to a high temperature on areas of several square micrometers (Tabrizi et al. Citation2009), well above the boiling point of the electrode material. In DBD, the dielectric barrier electrode configuration could prevent the transition from cold non-equilibrium plasma to an equilibrium discharge (Vons et al. Citation2006), and the ion and neutral temperatures are nearly equal to room temperature (Kunhardt Citation2000). These findings confirm that the discharge currents in the spark generator can heat up the working gas while the dielectric barrier electrode configuration in the DBD reactor can prevent such heating. The divergent temperature characteristics of DBD and spark could have different implications for the characteristics of generated nanoparticles. Meanwhile, the spark gas temperature generally increased with increasing applied voltage and frequency while DBD gas temperature remained nearly constant (i.e., the room temperature) at different voltage and frequency.
Figure 3. The gas temperatures in the discharge region of the DBD reactor and the spark generator as a function of (a) the applied voltage amplitude (fDBD = 1 kHz, fspark = 10 kHz) and (b) the driving frequency (VDBD = 6 kV, Vspark = 10 kV).
illustrates the influence of applied voltage amplitude on nanoparticle size distributions produced by the DBD reactor and the spark generator. In the spark discharge, higher applied voltage amplitude leads to a higher total particle number concentration, as well as higher geometric mean diameter, which can be attributed to the increment in electrode evaporation rate as voltage and gas temperature increase. In DBD, with rising voltage, the total number concentration of DBD-generated particles increases at first but then decreases at higher voltages, and the geometric mean diameter stays relatively stable at first and then slightly decreases. The initial increase in total number concentration indicates that raising the applied voltage amplitude can increase DBD nanoparticle production within a specific voltage amplitude range. The decrease in both total number concentration and geometric mean diameter is possibly caused by particle loss in the DBD reactor.
Figure 4. Total number concentrations and geometric mean diameters of nanoparticles generated by the DBD reactor and the spark generator, as a function of (a) the applied voltage amplitude (fDBD = 1 kHz, fspark = 10 kHz) and (b) the driving frequency (VDBD = 6 kV, Vspark = 10 kV).
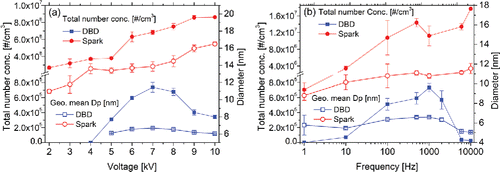
illustrates the influence of driving frequency on nanoparticle size distributions produced by the DBD reactor and the spark generator. Generally, the total number concentration and the geometric mean diameter of spark-generated particles are higher and larger under high frequency conditions (>0.5 kHz) than those under low frequency conditions. It can be attributed to the enhancement in spark power density per unit time (Evans et al. Citation2003; Tabrizi et al. Citation2009), as well as the assumption that the spark energy is independent of frequency (Schwyn et al. Citation1988). However, the increasing tendency in frequency has some fluctuations, which can be partly explained by the coagulation of the primary particles at high frequencies (Tabrizi et al. Citation2009). The influence of driving frequency on atmospheric pressure plasma features is intricate and not yet thoroughly investigated (Kim et al. Citation2011). In DBD, the total number concentration and the geometric mean diameter slightly increase with rising frequency after breakdown and then decrease sharply.
As reported in previous studies from post-DBD measurements including transport losses (Borra Citation2006, Citation2011; Borra et al. Citation2015), particle loss should be taken into consideration since the total number concentration and the mean diameter of DBD-generated nanoparticles are primarily controlled by the residence time in the reactor and the energy per filament discharge in ideal scenario without particle loss. The total energy deposited on the metal electrode surface would increase with increasing voltage amplitude and frequency, causing increments in concentration and size of generated nanoparticles (Borra et al. Citation1998). Taking particle loss in the discharge region into consideration, one possible explanation of the decrease in total number concentration and geometric mean diameter of DBD-generated nanoparticles at high voltages and frequencies is the electro-collection effect, which suggests that the proportion of charged particles are collected on the wall and the electrode in the discharge region with oscillating electrical field (see a photograph of the silver electrode with particle deposition in Figure S4). This effect can cause significant decrease in the number concentration of DBD-generated nanoparticles at high voltage and frequency, since a high voltage amplitude could increase the charging rate and motion amplitude of the particles and a high frequency could enhance the charging rate by reducing ion-diffusion charging time (Dramane et al. Citation2009; Jidenko and Borra Citation2005; Li et al. Citation2015). The charging efficiency is higher for larger particles, which may account for the decrease in the geometrical mean diameter at high frequency. In the spark discharge, particles are likely formed downstream of the discharge region (lower gas temperature) and this electro-collection effect is less significant. Another possible interpretation can be more bipolar ions flowing from the DBD gap at higher voltages that can charge the generated particles with both polarities (Bau et al. Citation2010) which can lead to post-discharge electrostatic agglomeration (Park et al. Citation2014) and the decrease in number concentration.
3.2. Comparisons of nanoparticles generated by the two techniques
To compare characteristics of DBD and spark generated nanoparticles, DBD and spark reactors were operated under a series of operational conditions (working gas flowrate, applied voltage amplitudes, and driving frequencies). The TEM images and EDS analysis of nanoparticles generated by both methods are presented in Figure S3, confirming that generated nanoparticles are composed of Ag element and have spherical shape with good crystallinity.
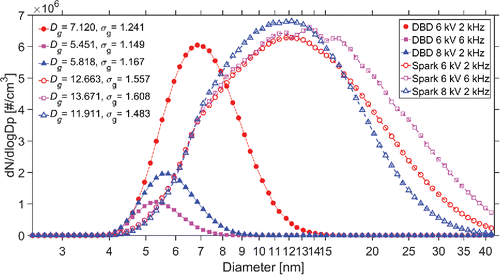
shows the time-averaged size distribution of DBD and spark generated nanoparticles over 90 min. DBD-generated nanoparticles have smaller size (characterized by geometric mean diameter ), better monodispersity (characterized by geometric standard deviation
), and lower number concentration than spark-generated nanoparticles under the same operational conditions (applied voltage amplitude, driving frequency, and working gas flowrate). The size distributions of generated nanoparticles presented in also illustrate the influences of voltage, frequency, and particle loss. For the DBD reactor, the number concentration under high working voltage and frequency declines sharply, while for the spark generator, higher voltage and frequency lead to higher number concentration.
Figure 5. Average size distributions of nanoparticles generated by the DBD reactor and the spark generator at different applied voltage amplitudes and driving frequencies (2 L/min argon working gas flow; geometric mean diameter Dg; geometric standard deviation σg).
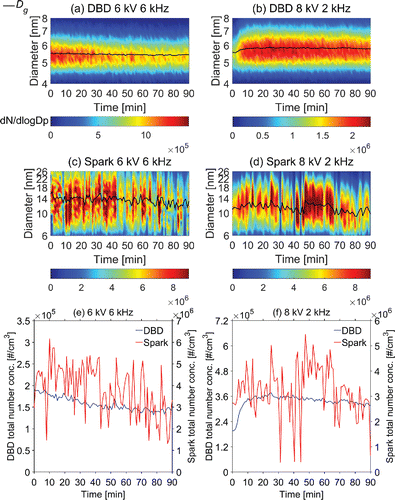
show temporal variations of the number concentration and the size distribution of DBD- and spark-generated nanoparticles under different conditions over 90 min. show temporal variations of the particle number concentration. When a clean and polished electrode was used as the vapor source in the DBD reactor, its surface morphology and generated nanoparticles (number concentration and geometric mean diameter) changed rapidly during the first 2–3 h and then reach a relatively stable state. This effect is also shown in , where the number concentration and the geometric mean diameter show some difference in at the same voltage amplitude and the same frequency. Before the stability experiments, both reactors were operated for more than 3 h to avoid this effect. Each set of size distribution data was recorded over a period of 63 s. Variations of the number concentration and the geometric mean diameter of the DBD-generated particles are less than those of the spark-generated particles. It indicates a better temporal stability for the DBD reactor. Though factors such as geometry, voltage amplitude, excitation frequency, purity of the working gas, and the change of volume can play important roles in determining the temporal stability (Maiorov and Golubovskii Citation2007), these factors were kept constant in this study or regulated to minimize potential instabilities. The observed different stability in nanoparticle generation is possibly related to the intrinsic characteristics of DBD and spark discharge systems, as evidenced by different gas temperatures in their discharge regions.
Figure 6. (a)–(d) stability maps (contour plots) of the nanoparticle size distributions and temporal variations of the geometric mean diameter; (e)–(f) temporal variations of the total number concentration (2 L/min argon working gas flow; geometric mean diameter Dg).
4. Conclusion
This study developed a DBD reactor to produce nanoparticles directly from metal electrodes and compared it with a spark generator. This DBD system is simple and easy to control since neither aerosolized droplets nor gaseous precursors were used. It was found that both DBD and spark discharges are effective in generating Ag nanoparticles. Gas temperature in the spark discharge region ranges from 470 to 1120 K and generally increases with increasing applied voltage amplitude and frequency, while the gas temperature in the DBD discharge region remains near room temperature. Given same voltage amplitude, frequency, and gas flow rate, DBD-generated nanoparticles have smaller size, better monodispersity, and lower number concentration than spark-generated nanoparticles. Furthermore, the temporal stability in nanoparticle production of the DBD reactor is better than that of the spark generator.
UAST_1260681_Supplementary_File.zip
Download Zip (4.5 MB)Acknowledgments
We thank Qiang Zhang, Jianguo Deng, Runlong Cai, Xiaotong Chen, Yunru Ren, and Zhen Li for their experimental supports. We also thank Prof. Da-Ren Chen from Virginia Commonwealth University for helpful discussion.
Funding
Financial support from the National Key Basic Research and Development Program of China (2013CB228505), and National Natural Science Foundation of China (21521064, 41227805, and 21422703) is acknowledged.
Related Research Data
References
- Akishev, Y. S., Aponin, G., Balakirev, A., Grushin, M., Karalnik, V., Petryakov, A., et al. (2011). Role of the Volume and Surface Breakdown in a Formation of Microdischarges in a Steady-State DBD. Eur. Phys. J. D, 61:421–429.
- Barni, R., Biganzoli, I., Tassetti, D., Riccardi, C. (2014). Characterization of a Plasma Jet Produced by Spark Discharges in Argon Air Mixtures at Atmospheric Pressure. Plasma Chem. Plasma Process., 34:1415–1431.
- Bau, S., Witschger, O., Gensdarmes, F., Thomas, D., Borra, J. P.. (2010). Electrical Properties of Airborne Nanoparticles Produced by a Commercial Spark-Discharge Generator. J. Nanoparticle Res., 12:1989–1995.
- Borra, J. P.. (2006). Nucleation and Aerosol Processing in Atmospheric Pressure Electrical Discharges: Powders Production, Coatings and Filtration. J. Phys. D—Appl Phys., 39:R19–R54.
- Borra, J. P. (2008). Charging of Aerosol and Nucleation in Atmospheric Pressure Electrical Discharges. Plasma Phys. Control. Fusion, 50:124036–45.
- Borra, J. P., Goldman, A., Goldman, M., Boulaud, D. (1998). Electrical Discharge Regimes and Aerosol Production in Point-to-Plane Dc High-Pressure Cold Plasmas: Aerosol Production by Electrical Discharges. J. Aerosol Sci., 29:661–674.
- Borra, J. P., Jidenko, N., Dutouquet, C., Aguerre, O., Hou, J., Weber, A. (2011). Nano-droplet ejection and nucleation of materials submitted to non-thermal plasma filaments. Eur. Phys. J.—Appl. Phys., 56:24019–25.
- Borra, J. P., Jidenko, N., Hou, J., Weber, A. (2015). Vaporization of Bulk Metals into Single-Digit Nanoparticles by Non-Thermal Plasma Filaments in Atmospheric Pressure Dielectric Barrier Discharges. J. Aerosol Sci., 79:109–125.
- Butler, K. M., Mulholland, G. W. (2004). Generation and Transport of Smoke Components. Fire Technol., 40:149–176.
- Chae, S., Lee, D., Kim, M. C., Kim, D. S., Choi, M. (2015). Wire-in-Hole-Type Spark Discharge Generator for Long-Time Consistent Generation of Unagglomerated Nanoparticles. Aerosol Sci. Technol., 49:463–471.
- Dhumal, S. Y., Daulton, T. L., Jiang, J., Khomami, B., Biswas, P. (2009). Synthesis of Visible Light-Active Nanostructured TiOx (x < 2) Photocatalysts in a Flame Aerosol Reactor. Appl. Catalysis B—Environ., 86:145–151.
- Dramane, B., Zouzou, N., Moreau, E., Touchard, G. (2009). Electrostatic Precipitation of Submicron Particles using a DBD in Axisymmetric and Planar Configurations. IEEE Trans. Dielectr Electr. Insul., 16:343–351.
- Evans, D. E., Harrison, R. M., Ayres, J. G. (2003). The Generation and Characterization of Metallic and Mixed Element Aerosols for Human Challenge Studies. Aerosol Sci. Technol., 37:975–987.
- Feng, J. C., Huang, L. Y., Ludvigsson, L., Messing, M. E., Maisser, A., Biskos, G., et al. (2016). General Approach to the Evolution of Singlet Nanoparticles from a Rapidly Quenched Point Source. J. Phys. Chem. C, 120:621–630.
- Golubovskii, Y. B., Maiorov, V. A., Behnke, J., Behnke, J. F. (2002). Influence of Interaction Between Charged Particles and Dielectric Surface Over a Homogeneous Barrier Discharge in Nitrogen. J. Phys. D—Appl. Phys., 35:751–761.
- Jaworek, A. (2007). Micro- and Nanoparticle Production by Electrospraying. Powder Technol., 176:18–35.
- Jiang, J., Chen, D. R., Biswas, P. (2007). Synthesis of Nanoparticles in a Flame Aerosol Reactor with Independent and Strict Control of Their Size, Crystal Phase and Morphology. Nanotechnology, 18:285603–10.
- Jidenko, N., Borra, J. P. (2005). Kinematics of Charged Nanometric Particles in Silent Discharges. J. Phys. D—Appl. Phys., 38:617–620.
- Jidenko, N., Bourgeois, E., Borra, J. P. (2010). Temperature Profiles in Filamentary Dielectric Barrier Discharges at Atmospheric Pressure. J. Phys. D—Appl. Phys., 43:295203–11.
- Kim, D. B., Jung, H., Gweon, B., Moon, S. Y., Rhee, J. K., Choe, W. (2011). The Driving Frequency Effects on the Atmospheric Pressure Corona Jet Plasmas from Low Frequency to Radio Frequency. Phys. Plasmas, 18:043503–07.
- Kunhardt, E. E. (2000). Generation of Large-Volume, Atmospheric-Pressure, Nonequilibrium Plasmas. IEEE Trans. Plasma Sci., 28:189–200.
- Laegreid, N., Wehner, G. K. (1961). Sputtering Yields of Metals for Ar+ And Ne+ Ions with Energies From 50 To 600 Ev. J. Appl. Phys., 32:365–369.
- Li, Q., Jiang, J. K., Duan, L., Deng, J. G., Jiang, L., Li, Z., et al. (2015). Improving the Removal Efficiency of Elemental Mercury by Pre-Existing Aerosol Particles in Double Dielectric Barrier Discharge Treatments. Aerosol Air Qual. Res., 15:1506–1513.
- Li, Q., Pu, Y. K., Lieberman, M. A., Economou, D. J. (2011). Dynamic Model of Streamer Coupling for the Homogeneity of Glow like di Electric Barrier Discharges at Near-Atmospheric Pressure. Phys. Rev. E, 83:046405–11.
- Li, Q., Takana, H., Pu, Y. K., Nishiyama, H. (2012). A Nonequilibrium Argon-Oxygen Planar Plasma Jet Using a Half-Confined Dielectric Barrier Duct in Ambient Air. Appl. Phys. Lett., 100:133501–04.
- Maiorov, V. A., Golubovskii, Y. B. (2007). Modelling of Atmospheric Pressure Dielectric Barrier Discharges with Emphasis on Stability Issues. Plasma Sources Sci. Technol., 16:S67–S75.
- Maisser, A., Barmpounis, K., Attoui, M. B., Biskos, G., Schmidt-Ott, A. (2015). Atomic Cluster Generation with an Atmospheric Pressure Spark Discharge Generator. Aerosol Sci. Technol., 49:886–894.
- Mäkelä, J. M., Aalto, P., Gorbunov, B. Z., Korhonen, P. (1992). Size Distributions from Aerosol Spark Generator. J. Aerosol Sci., 23:233–236.
- Motret, O., Hibert, C., Pellerin, S., Pouvesle, J. M. (2000). Rotational Temperature Measurements in Atmospheric Pulsed Dielectric Barrier Discharge—Gas Temperature and Molecular Fraction Effects. J. Phys. D—Appl. Phys., 33:1493–1498.
- Navrátil, Z., Brandenburg, R., Trunec, D., Brablec, A., St'ahel, P., Wagner, H. E., Kopecký, Z. (2005). Comparative Study of Diffuse Barrier Discharges in Neon and Helium. Plasma Sources Sci., 15:8–17.
- Okuyama, K., Kousaka, Y., Tohge, N., Yamamoto, S., Wu, J. J., Flagan, R. C., et al. (1986). Production of Ultrafine Metal-Oxide Aerosol-Particles by Thermal-Decomposition Of Metal Alkoxide Vapors. Aiche J., 32:2010–2019.
- Park, K. T., Farid, M. M., Hwang, J. (2014). Anti-Agglomeration of Spark Discharge-Generated Aerosols Via Unipolar Air Ions. J. Aerosol Sci., 67:144–156.
- Peineke, C., Schmidt-Ott, A. (2008). Explanation of Charged Nanoparticle Production from Hot Surfaces. J. Aerosol Sci., 39:244–252.
- Pfeiffer, T. V., Feng, J., Schmidt-Ott, A. (2014). New Developments in Spark Production of Nanoparticles. Adv. Powder Technol., 25:56–70.
- Rajasekaran, P., Mertmann, P., Bibinov, N., Wandke, D., Viol, W., Awakowicz, P. (2010). Filamentary and Homogeneous Modes of Dielectric Barrier Discharge (DBD) in Air: Investigation through Plasma Characterization and Simulation of Surface Irradiation. Plasma Process. Polym., 7:665–675.
- Rao, N., Girshick, S., Heberlein, J., Mcmurry, P., Jones, S., Hansen, D., et al. (1995). Nanoparticle Formation Using a Plasma Expansion Process. Plasma Chem. Plasma Process., 15:581–606.
- Reinmann, R., Akram, M. (1997). Temporal Investigation of a Fast Spark Discharge in Chemically Inert Gases. J. Phys. D—Appl. Phys., 30:1125–1134.
- Schmidtott, A., Schurtenberger, P., Siegmann, H. C. (1980). Enormous Yield Of Photoelectrons From Small Particles. Phys. Rev. Lett., 45:1284–1287.
- Schwyn, S., Garwin, E., Schmidtott, A. (1988). Aerosol Generation by Spark Discharge. J. Aerosol Sci., 19:639–642.
- Tabrizi, N. S., Ullmann, M., Vons, V. A., Lafont, U., Schmidt-Ott A. (2009). Generation of Nanoparticles by Spark Discharge. J. Nanoparticle Res., 11:315–332.
- Uehara, S., Itoga, T., Nishiyama, H. (2015). Discharge and Flow Characteristics Using Magnetic Fluid Spikes for Air Pollution Control. J. Phys. D—Appl. Phys., 48:282001–05.
- Vons, V., Creyghton, Y., Schmidt-Ott, A. (2006). Nanoparticle Production Using Atmospheric Pressure Cold Plasma. J. Nanoparticle Res., 8:721–728.
- Wen, S. B., Mao, X. L., Greif, R., Russo, R. E. (2007). Experimental and Theoretical Studies of Particle Generation after Laser Ablation of Copper with a Background Gas at Atmospheric Pressure. J. Appl. Phys., 101:123105–19.