
Abstract
Cooking is the main source of ultrafine particles (UFP) in homes. This study investigated the effect of venting range hood flow rate on size-resolved UFP concentrations from gas stove cooking. The same cooking protocol was conducted 60 times using three venting range hoods operated at six flow rates in twin research houses. Size-resolved particle (10–420 nm) concentrations were monitored using a NanoScan scanning mobility particle sizer (SMPS) from 15 min before cooking to 3 h after the cooking had stopped. Cooking increased the background total UFP number concentrations to 1.3 × 10³ particles/cm3 on average, with a mean exposure-relevant source strength of 1.8 × 10¹² particles/min. Total particle peak reductions ranged from 25% at the lowest fan flow rate of 36 L/s to 98% at the highest rate of 146 L/s. During the operation of a venting range hood, particle removal by deposition was less significant compared to the increasing air exchange rate driven by exhaust ventilation. Exposure to total particles due to cooking varied from 0.9 to 5.8 × 10⁴ particles/cm3·h, 3 h after cooking ended. Compared to the 36 L/s range hood, higher flow rates of 120 and 146 L/s reduced the first-hour post-cooking exposure by 76% and 85%, respectively.
© 2018 Crown Copyright. Published with license by Taylor & Francis Group, LLC
Editor:
1. Introduction
In recent years, ultrafine particles (UFP, aerodynamic diameter <100 nm) are increasingly studied because of their adverse human health effects. Due to their small size, UFP have a much higher number concentration and surface area than larger particles per unit mass, presenting greater inflammatory potential, higher predicted pulmonary deposition, and enhanced translocation ability (Oberdörster et al. Citation1995; Chalupa et al. Citation2004; Kreyling, Semmler-Behnke, and Möller Citation2006). Epidemiological studies have identified correlations between UFP exposure and oxidative stress, as well as increased respiratory and cardiovascular morbidity and mortality in susceptible populations (Wichmann et al. Citation2000; Pekkanen et al. Citation2002; von Klot et al. Citation2002; Sioutas, Delfino, and Singh Citation2005; Strak et al. Citation2010; Meier et al. Citation2015).
The presence of UFP in the indoor environment is of concern because most people spend a majority of their time indoors (Klepeis et al. Citation2001). Cooking, especially with a gas stove, was found to be the most important source generating UFP in nonsmoking homes in developed countries (Özkaynak et al. Citation1996). High emissions of UFP from cooking activities have been reported in many studies. Wallace, Emmerich, and Howard-Reed (Citation2004a) performed an 18-month study in an occupied house and found that cooking, mostly frying, produced particles to the magnitude of 1014 over a typical cooking time of about 5–15 min, more than 90% of which were in the ultrafine range. Kearney et al. (Citation2011) found that about two-thirds of the 100 Canadian homes studied had higher contributions to indoor UFP concentrations from indoor sources, mainly cooking, than from the entry of outdoor UFP. Wheeler et al. (Citation2011) reported that indoor UFP concentrations exceeded their daily mean values by 160% due to dinnertime cooking.
Using a venting range hood can be an effective way to capture air pollutants generated by cooking activities and gas burners at the point of emissions, and exhaust them to the outdoors (Singer et al. Citation2012, Citation2017). The removal efficiency of range hoods has been widely studied for gaseous pollutants and fine particles (Delp and Singer Citation2012; Singer et al. Citation2012; Lunden, Delp, and Singer Citation2015). While the effect of range hood operation on UFP removal has also been explored in a number of studies, there are several limitations.
First, some assessments were based on a single range hood and influential factors were not considered. For example, Li, Lin, and Jenq (Citation1993) evaluated the efficiency of a range hood in removing size-resolved particles generated from cooking and found that the removal efficiencies were in a range of 75–80%. Zhang et al. (Citation2010) found that turning on a re-circulating range hood during cooking can increase particle decay rate by a factor of two compared with range hood fan off conditions. The details of the range hood were not reported in these studies, which make it difficult to compare the effect across studies. Second, some evaluations were conducted based on gas burner emissions (e.g. boiling water), and the exposure from cooking food was not addressed. For example, Rim et al. (Citation2012) investigated the effectiveness of two range hoods at four flow rates in reducing size-resolved UFP concentrations emitted from gas stove burners and oven in an unoccupied manufactured house. They found that higher flow rates were generally more effective for UFP reduction, though the reduction varied with burner selection and particle diameter. The reported particle size was limited to <20 nm. Third, many studies have addressed the effect of range hood operation based on the reduction of particle number concentrations. The effect on other aspects of particle dynamics, such as particle decay and deposition rates, has rarely been investigated. Last, many studies were not done with adequate replication or control to robustly determine the effectiveness of range hoods.
This study investigated the effect of venting range hood fan flow rate on size-resolved UFP from gas stove cooking under a controlled but realistic environment. It evaluated particle size-distribution, total and size-resolved particle decay and deposition rates, total and size-resolved source strengths, and the time-varying exposure effect.
2. Methods
2.1. Study design
The study was conducted in the Canadian Centre for Housing Technology’s (CCHT’s) twin research houses in Ottawa, Ontario, during September and October 2015. They are identical two-story detached houses. In each house, the kitchen is open to the family room, with a 76 cm width gas stove and an under-cabinet mount for a venting range hood.
Three venting range hoods with manufacturer-stated flow rates ranging from 52 to 189 L/s were selected for the study (). The actual flow rate downstream of each range hood, while installed, was measured using a Nailor Industries model 36FMS flow station along with a TSI Model 9565-P multifunction ventilation meter. The range hoods offered a total of seven airflow settings, and six of them were selected for analysis, with measured rates of 36, 69, 75, 84, 120, and 146 L/s.
Table 1. Characteristics of the range hoods evaluated in the study.
The UFP emission from cooking was simulated by boiling 500 g prepackaged frozen broccoli and frying four frozen beef hamburgers, representing a simple meal for a four person family. The range hood was started simultaneously with the gas stovetop burner and was either turned off at the end of cooking (“Fan Off After Cooking” test condition) or left on for an additional three hours (“Fan Always On” test condition).
In addition, cookware could be another source. Washing with bare hands can result in large production of UFP (apparently from skin oils) when the cookware is heated on the stove (Wallace, Ott, and Weschler Citation2015). To reduce the uncertainty of cookware emission, after each experiment, the cookware was washed using a new pair of rubber gloves and a kitchen sponge with a single drop of dishwashing liquid and rinsing with hot tap water for 2 min.
Time-resolved monitoring started 15 min before cooking and continued until 3 h after the cooking had stopped. The cooking took approximately 25 min, with about 12 min boiling (back burner) and 13 min frying (front burner), consecutively. Five tests were conducted at each flow rate to account for emission variability. In total, there were 60 cooking experiments (six flow rates × two hood fan status after cooking × five replicates).
Two tests were completed in each house per day, one in the morning starting at 9:30 am and one in the afternoon starting at 3:00 pm. The monitoring instruments were placed on a table in the family room, which is open and connected to the kitchen, approximately three meters from the stove (SI Figure S1). This location was chosen to minimize the impact of fluctuating and nonuniform concentrations in the kitchen and to approximate the exposure of people around the kitchen, such as eat-in area or dining room. The sampling height is 1.2 m to represent the normal breathing height of a seated adult. It is noted that there might be induced airflow by the technicians during the cooking period. During the experiments, the interior doors within the house were fully opened. Windows and the doors to the front, backyard, and the basement were closed. The heating, ventilation, and air conditioning (HVAC) system in both houses were turned off. There were no supplemental mixing fans used within the house; all mixing was through natural temperature and pressure driven processes. After each day, the HVAC was turned on from 8 pm to 8 am to remove residual pollutants in both houses.
2.2. Instrumentation and monitoring
Temperature and relative humidity (RH) were recorded continuously during the sampling period at 1 min intervals using a Hobo Data logger U12-013 (Onset, Bourne, MN). Air exchange rate in the kitchen was measured continuously during each test using the tracer gas decay method of ASTM E 741-00 (ASTM Citation2006), with sulfur hexafluoride (SF6) as the tracer gas and a Bruel & Kjaer Model Innova 1312 photoacoustic field gas monitor. A dose of 180–240 mL SF6 at ambient pressure was injected in multiple locations throughout the main floor using syringes approximately 1 h before the start of a test to provide a reasonably well-mixed condition without the use of mixing fans.
Particle number concentration and size distribution was monitored using a NanoScan scanning mobility particle sizer (SMPS, TSI Model 3910). It measures particles ranging from 10 to 420 nm divided into 13 size channels: 10–13, 13–18, 18–24, 24–32, 32–42, 42–56, 56–75, 75–100, 100–133, 133–178, 178–237, 237–316, and 316–420 nm. A full scan was completed every minute.
2.3. Analysis
The analysis included estimation of particle peak reduction, exposure, particle deposition rate, and source strength. The analysis was conducted using SAS EG 5.1 (Cary, North Carolina, USA).
Particle concentrations were analyzed by size. All the data collected from continuous instruments were visually assessed for instrument malfunction or abnormal peaks. Affected measurements were invalidated and excluded from the analysis. Particle concentrations for the three largest size categories (≥178 nm) were excluded from the analysis because of very low number concentration and associated large uncertainties.
For each experiment, the background concentrations were estimated and subtracted from particle concentrations of all sizes. For Fan Off After Cooking tests, the concentration at the end of the test was similar to or higher than the concentration at the beginning. For Fan Always On tests, nearly half of the tests had end concentrations lower than at the beginning. This was mainly because operating a range hood for a longer time, especially at higher flow rates, not only removed a significant fraction of the particles from cooking, but also increased infiltration. The influence of infiltration on indoor UFP concentrations varies depending on the outdoor levels. If the end concentration was lower than the beginning concentration, linearly interpolated values between 15-min averaged concentration before cooking and 15-min averaged concentration at the end of monitoring were used as the background. Otherwise, the background was estimated using the average value of the first 15 min.
To avoid the uncertainties associated with using a single maximum measurement, peak concentrations were estimated by the maximum 2-min averaged concentrations for all sizes. Tests without range hood operation during cooking were not performed. To overcome this limitation, linear regression of the peak number concentrations on all measured flow rates was used to estimate the peak levels without range hood operation during cooking (corresponding to flow rate =0 L/s) for each particle size. The estimated values were used as a reference condition to calculate particle peak reduction.
Time-integrated concentrations over the sampling period were used to estimate exposure that would occur if the homes were occupied. The total exposure (Et) was defined by the sum of exposures from cooking (Ec) and background (Eb), which were calculated by integrating the cooking and background UFP concentrations over the entire 3.42 h sampling period (25 min cooking +3 h after cooking):
(1)
where
and
are the background and cooking (background-removed) particle concentrations summed across 10–178 nm, described in this article as total particles, at time t (h). In addition, background-removed UFP concentrations were integrated over four different periods: during cooking and each hour after cooking.
These exposures are driven by several important processes: source strength, deposition, air exchange, and coagulation. The coagulation effect was visually assessed by plotting the logarithms of the total particle number concentrations. If there is a significant change in the slope from early to middle points after the peak concentration, it might be attributed to coagulation. Such cases were found in 17 out of 52 tests, mainly associated lower fan flow rates, and only lasted for 4 min on average. Although strong air movement will enhance coagulation, the peak concentrations under higher fan flow rates were much lower (17,379 particles/cm3 at 120 L/s on average, 1,689 particles/cm3 at 146 L/s on average) than the commonly used 105 particles/cm3 threshold for coagulation (Seinfeld and Pandis Citation2006). Therefore although coagulation may well be occurring, particularly at high concentrations and for the smallest particles, we found little effect on measured decay rates across cooking tests.
Particle deposition rate (k) during the operation of a range hood was estimated by subtracting the mean air exchange rate (α) from the mean decay rate (k + α) of each size category. The decay rate was estimated using linear regression on the natural logarithms of the background-removed number concentrations within the first hour after peak. The negative slope of the regression is the decay rate. Similarly, the air exchange rate was obtained by linear regression on the natural logarithms of background-removed SF6 concentrations for each test. For both decay and air exchange rates, a restriction was imposed requiring the regression to explain at least 90% of the observed variance (R2 > 0.9).
The source strength of each particle size category was calculated using the method of Ott (Citation2007). First, the asymptotic concentration , at which an equilibrium is reached between the rate at which the pollutant is internally generated by the source and the rate at which it is removed, is calculated:
(2)
where
is the background removed particle peak concentration (particles/cm3), t (min) is the time starting from when the particle concentration rises markedly till the peak concentration is reached, and
is the decay rate (min−1). It is noted that the decay rate was approximated as the sum of deposition and air exchange rate. Other possible dynamic effects in the decay of particles, such as coagulation, condensation, and evaporation, were treated as negligible. The source strength is then calculated by multiplying the asymptotic concentration by the loss rate in the room (decay rate × volume):
(3)
where
is the source strength (particles/min) and
is the mixing volume (cm−3). The mixing volume was determined according to the best-fit of experimental to theoretical estimates of volume flow rate. The Lawrence Berkeley Laboratory (LBL) quadrature method (Sherman Citation1992) and the Palmiter and Bond method (Palmiter and Bond Citation1991) were used to combine infiltration with range hood exhaust ventilation. The calculation of experimental and theoretical volume flow rates is presented in the Supplemental Information (SI). The house infiltration rate was measured one week before the experiments using the Perfluorocarbon tracer gas (PFT) technique (Dietz et al. Citation1986).
3. Results and discussion
During the experiments, the average indoor temperature was 25 °C and RH was 36%. The variability of indoor temperature and RH across the tests was small with coefficients of variation less than 8%. The house infiltration rate was 0.08 h−1 (SE: 0.01 h−1). The air exchange rates associated with different range hood flow rates are summarized in SI Table S1. For the NanoScan SMPS, a total of 56 events (out of 60) were selected for analysis, divided among the ventilation conditions as follows: three with 36 L/s (two were lost due to instrument malfunction), five with 69 L/s, five with 75 L/s, five with 84 L/s, five with 120 L/s, five with 146 L/s, and 28 with range hood Fan Off After Cooking (two were lost due to instrument malfunction).
3.1. Particle concentrations and size distributions
shows the mean background-removed particle concentrations and size distributions measured under Fan Off After Cooking test condition, from 15 min before cooking to 3 h after cooking ended, by range hood flow rate. In general, higher flow rates were associated with lower UFP concentrations, except for range hood A. The performance of range hood A was limited by its design and will be discussed in more detail in Section 3.3.
Figure 1. Contour plots of mean background-removed particle concentrations and size distributions measured under Fan Off After Cooking test condition, from 15 min before cooking to 3 h after cooking, by range hood flow rate. The time of 0 represents the end of cooking.
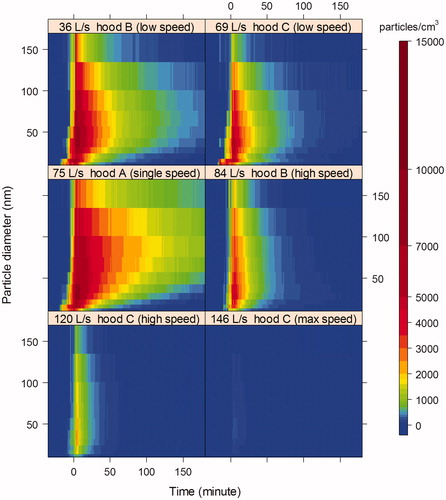
shows a more rapid disappearance of the smaller particles than the larger ones, except for range hood C at 146 L/s, which had a relatively low concentration of UFP. This could result from a combination of the following processes: the smaller particles, because of their higher Brownian diffusion coefficients, have higher deposition rates. The fast decay of smaller particles could also result from evaporation. The conservation of particle mass was checked for each experiment. Assuming the particles are spherical and have a density of 1 g/cm3, for each size category, the particle mass at each minute was calculated by the product of the volume of each particle, unit density, and number concentration. Only one experiment showed an increase of mass after cessation of cooking. This could have been caused by condensation of water vapor or gases onto particles, a momentary intrusion from an outside source, or random uncertainties in measurement. In addition, the smaller particles are also more affected by coagulation at lower range hood flow rates when the number concentration is higher than 105 cm−3, although such concentrations only lasted for 3 min on average.
3.2. Particle peak concentrations
On average, the peaks occurred at 5 min (±3 min) after cooking ended. The mode sizes were in a range of 24–56 nm across flow rates (). This range was in general agreement with results from previous studies. As has been noted, the gas flame itself produces UFP with a peak below 10 nm (Wallace et al. Citation2008; Rim et al. Citation2012). The addition of pans, food, and more complex cooking styles (e.g. stir-frying, frying) results in moving the peak to higher diameters, up to 60 nm (Wallace, Emmerich, and Howard-Reed Citation2004a; Wallace 2006; Wallace et al. Citation2008). Flow rate was not found to have a strong impact on the mode size of peaks, with a Pearson correlation of 0.301 (p = 0.134).
Figure 2. Average particle peak concentration as a function of particle size at each range hood flow rate, measured under Fan Off After Cooking test condition. The error bars represent standard errors of the mean based on replication tests. Only the plus side of the error bars is shown to minimize overlapping. The x-axis is logarithmic.
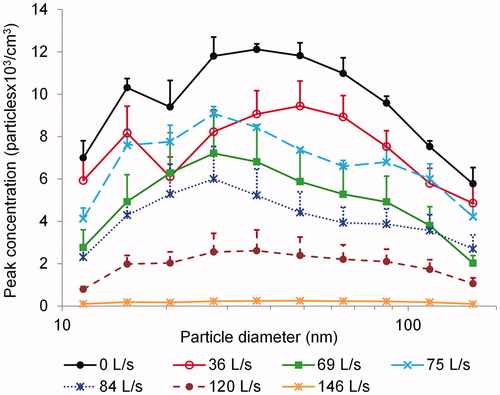
For range hood B and C (excluding results from range hood A at 75 L/s), there was a strong negative correlation between fan flow rate and peak concentration for each particle size range. The Pearson correlations ranged from −0.938 (p = 0.018) to −0.998 (p < 0.001). The close relationship between flow rate and peak concentration made it possible to estimate what the peak concentration would be without any range hood operation (flow rate = 0 L/s) during cooking, using linear regression. The best-fit regression lines are presented in SI Figure S2. The resulting estimated peaks are shown in . The average peak concentration estimate for the total particles was 8.4 × 10⁴ (SE: 1.9 × 10⁴) particles/cm3. Comparing to the background levels (1.3 × 10³ particles/cm3 on average), the total particle concentration increased by 65 times due to cooking.
shows the peak reductions at various range hood airflows. Compared to the reduction of 15–35% across all particle sizes produced by the 36 L/s range hood, the higher flow rates of 120 and 146 L/s reduced the peak levels by 77–89% and 98–99%, respectively. The reduction was fairly consistent across all sizes at higher flow rates. At lower flow rates, the reduction varied a little by particle size but not in a systematic way.
Table 2. The size-resolved UFP peak reduction with six range hood flow rates.
3.3. Exposure
shows the cumulative exposure to total particles over time measured under Fan Off After Cooking test condition, relative to the end of cooking, which is designated as t = 0. At 3 h post-cooking, the exposure to particles of all sizes due to cooking (Ec) varied from 0.9 to 5.8 × 10⁴ particles/cm3·h across the six range hood operation conditions. The exposure after cooking was more significant than that of the cooking period and the effect of range hood flow rate was most evident for the first hour after cooking. Comparing with the 36 L/s range hood, higher flow rates of 120 and 146 L/s reduced the first-hour Ec by 76% (95% CI: 69–82%) and 85% (95% CI: 82–88%), respectively. SI Figures S3 and S4 show similar reductions in the size-resolved number and mass exposures by higher flow rates.
Figure 3. The top panel presents the cumulative exposure to total particles due to cooking over the entire monitoring period, measured under Fan Off After Cooking test condition. The x-axis represents the time relative to the end of cooking (t = 0). The bottom panel shows the time-integrated exposure over the cooking period and each hour after cooking ended, measured under Fan Off After Cooking test condition.
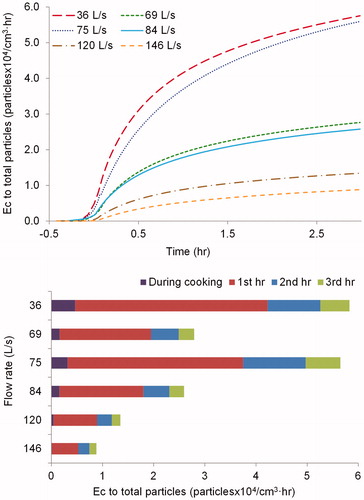
After the first hour, the hourly-integrated concentration reduced dramatically by 58–73% in the second hour and 74–85% in the third hour. This was mainly due to particle losses through exfiltration, deposition on surfaces such as floors, walls and ceilings, and perhaps dispersion throughout the house if mixing was not complete in the first hour. With the quick reduction of the change in Ec, the contribution from background particles (Eb) to total particles (Et) increased. SI Table S2 summarizes the contribution of Eb to Et, which increased from 4 to 11% for the first hour to 12–25% for the second hour, and 19–36% for the third hour after cooking ended. The overall effect of the range hoods on exposure increased more slowly with the passage of time.
In general, higher flow rates were associated with lower Ec and Et, except for range hood A (75 L/s). Compared to hoods B and C, hood A had 5 cm less coverage of the cooktop. Previous studies suggested that whether the exhaust device extends over the burners being used has a large influence on the pollutant capture efficiency (CE) and a device that does not cover the in-use burners suffers a penalty of 20–25% CE (Singer et al. Citation2012). The impact of cooktop coverage was more significant on exposure. The first hour integrated Ec was 92% and 108% higher at 75 L/s than flow rates of 69 and 84 L/s, respectively. Besides the cooktop coverage, the performance of range hood A might be impacted by other factors. During the experiments, the increase of the air exchange rate caused by range hood A, which is independent of cooktop coverage, was much lower than expected (SI Table S1). This might be explained by the small air intake area of hood A. Hood A featured a single screen filter located in the center of the hood, and the filter area was 43% less than the dual screen filters of hood B and C.
The results of this study reinforce previous findings that higher range hood flow rates are effective in removing cooking related air pollutants, and the extent to which the exhaust device over the front burners has a large impact on exposure. Many previous studies employed CE as a metric for evaluating exhaust device effectiveness (Li and Delsante Citation1996; Li, Delsante, and Symons Citation1997; Delp and Singer Citation2012; Singer et al. Citation2012; Lunden, Delp, and Singer Citation2015). The CE quantifies the fraction of emitted pollutants that are pulled directly into the exhaust device before mixing into room air (Singer et al. Citation2012). The exposure assessment of cooking related UFP under different range hood flow rates is different from CE. On one hand, CE may be different for the burner and cooking-generated pollutants. A recent study by Lunden, Delp, and Singer (Citation2015) indicated that CEs measured for burner emitted CO2 are not predictive of CEs for cooking-generating particles under all conditions: CEs for CO2 and particles were similar when they were all above 80%; with lower CEs, CEs for particles were much lower than for CO2. On the other hand, particle losses due to air exchange, deposition, and coagulation are not captured by CE, in which removed pollutants were typically measured from the exhaust discharge or in the exhaust duct. Results based on CE provided important information on the influence of range hood flow rate, device characteristics and burner section on pollutant removal; however, it may not represent the actual exposure to UFP (Rim et al. Citation2012).
Published data on the effect of range hood flow rate on exposure to UFP are limited. Dobbin et al. (Citation2018) explored the benefit of range hood use after cooking on exposures to several pollutants, including PM2.5, UFP, NO, and NO2 using multiple linear regression models and dominance analysis. The study was carried out simultaneously with our study using the same two research houses but with different objectives and instrumentation. Our study focused on fan use during cooking using size-resolved UFP concentrations (in the range of 10–420 nm) measured by a SMPS, while Dobbin et al. study examined post-cooking fan use characteristics using total UFP number concentrations (in the range of 10–1000 nm) measured by a condensation particle counter (TSI Model 3007). The results from Dobbin et al. study showed that while leaving the fan on after cooking generally increased decay rates, it had a relatively small effect on integrated exposures compared to the effects of fan flow rate and the specific fan used during cooking. Comparing the first-hour post-cooking exposure reduction measured by the two instruments, the measurements of SMPS (85% on average) were slightly higher than the measurements of CPC (72% on average). Singer et al. (Citation2017) measured time-resolved concentrations of particles with diameters of 6 nm or larger (PN) during the operation of natural gas cooking burners in nine California homes. A range of kitchen ventilation systems were tested, including venting range hood, recirculating range hood, and microwave with exhaust fan. The measured flow rate ranged from 19 to 153 L/s. The largest 1-h PN reduction in the range of 80–95% was achieved by a venting range hood with large capture volume and a measured air flow of 148 L/s. The results were similar to our study that the highest average exposure reduction of 85% was achieved by range hood C, operating at 146 L/s. Rim et al. (Citation2012) investigated the effectiveness of a range hood in reducing indoor levels of UFP emitted from a gas stove burner and oven in an unoccupied manufactured house. They tested two range hoods at four flow rates from 28 to 189 L/s. If using the 28 L/s as a reference condition, the number-weighted UFP reductions of running a range hood at 189 L/s was 91% for the front burner and 96% for the back burner. The reduction rates were slightly higher than the average reduction of 85% in our study when comparing the exposure under a range hood operated at 146–36 L/s. One reason might be due to the wider range of flow rates evaluated in the Rim et al. study. Another possible explanation is the range hoods design. The two range hoods evaluated in the Rim et al. study were both 5 cm deeper than range hood B and C. The extra cooktop coverage might further improve the effectiveness of a higher flow rate range hood.
3.4. Deposition rates
When operating a range hood, besides ventilating some fraction of locally emitted pollutants to outdoors, the air removal rate of the entire home will be increased. shows the influence of range hood flow rate on particle deposition and air exchange rates, the two main mechanisms of particle removal from the indoor air. When the range hood was off, deposition was the dominant loss mechanism. When the range hood was on, particle decay rates were increased, and particle removal by deposition was less significant compared to the increasing air exchange rate driven by exhaust ventilation.
Figure 4. A comparison of mean deposition rate of the total particles and the mean air exchange rate at each range hood flow rate, measured under Fan Always On test condition. The flow rate of 75 L/s was excluded due to large uncertainties.
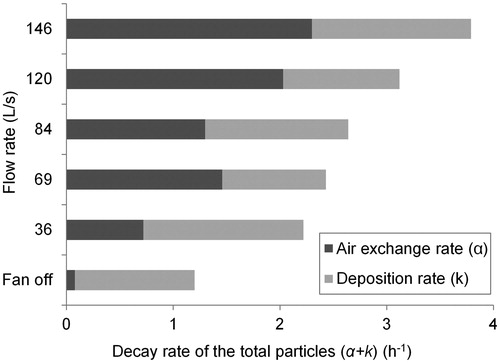
It was also noted that the increase of air exchange rate did not show a strong impact on particle deposition. Although the results of chamber studies (e.g. Nomura et al. Citation1997; Thatcher et al. Citation2002) and some real house studies (e.g. Fogh et al.Citation1997; Abt et al. Citation2000; Long et al. Citation2001) have indicated that there is a positive correlation between air exchange rate and particle deposition rate, inconsistent results were shown in real house studies. For example, the results presented by Lee et al. (Citation2014) showed that the effect of air exchange rate on deposition rate was relatively small compared to the influence of particle size and mechanical air mixing. Significant association between the two factors was only observed for a few size categories. Howard-Reed, Wallace, and Emmerich (Citation2003) investigated the relationship between the air change rate and particle deposition rate under central heating and air conditioning fan off condition and did not observe an increase in deposition rate with increasing air change rate.
The numeric values of particle deposition rates for each size category and a comparison of deposition rates of particles less than 100 nm between the current and previous studies are presented in SI (Tables S3–S5 and Figure S5).
3.5. Source strengths
The estimated source strengths for particles between 10 and 178 nm were in the range of 1.2 × 10¹¹ (SE: 1.9 × 10¹⁰) to 2.6 × 10¹¹ (SE: 1.0 × 10¹⁰) particles/min, with a mode at 32–42 nm (). The decay rates used for the calculation are presented in SI (Table S3). As another parameter used for source strength calculation, a mixing volume of 244 m3 resulted in good correlation between experimental and theoretical estimates of volume flow rates (r = 0.91, p < 0.001) (SI Figure S6). The estimated mixing volume correlated well with the physical characteristics of the twin research houses, where the volume of the first floor (excluding garage) is about 250 m3.
Figure 5. The source strength distribution for particles in the size range of 10–178 nm due to cooking on a gas stove. The error bars represent the propagation of standard errors that took into account uncertainties from estimated particle decay rate and peak concentration.
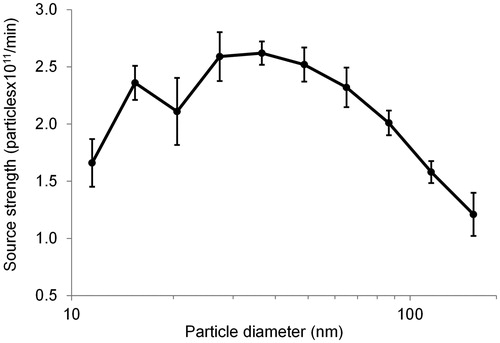
The exposure-relevant source strength of the total particles was 1.8 × 10¹² (SE: 0.6 × 10¹¹) particles/min. It is noted that this estimate is relevant to predicting peak exposures to particles in the size range studied, and does not include the majority of particles emitted from the gas stovetop burners, which are smaller than 10 nm. Wallace et al. (Citation2008) found that the number of particles below 10 nm could be about 10 times the level of particles above 10 nm. Therefore, comparisons of particle number emissions must take into account the size range covered by the monitoring instruments in each study.
Despite the underestimations, the results are within the range of values reported from the literature. Wallace and Ott (Citation2011) found that cooking on gas or electric stoves resulted in source strengths in the neighborhood of 1012 particles/min for particles in the range of 10–1000 nm. Buonanno, Morawska, and Stabile (Citation2009) reported that the source strengths with cooking on a gas stove ranged from 1.2 × 10¹¹ to 3.4 × 10¹² particles/min for particles in the range of 6–20,000 nm. Wallace et al. (Citation2008) found that the source strengths of particles (in the range of 2–64 nm) emitted from gas and electric stoves, as well as an electric toaster oven were in a range of 1011 to 1013 particles/min. Wallace, Emmerich, and Howard-Reed (Citation2004a) reported that the source strength for UFP (summed across 10–100 nm) generated by 44 gas cooking episodes was about 3 × 10¹² particles/min.
3.6. Study limitations and practical implications
The main limitation of this study is the limited number of range hoods evaluated in a specific environment; variations in range hood type, hood design, installation, house characteristics were not fully addressed. Another limitation of the study was that experiments of cooking without range hood operation were not conducted. Estimated values, based on linear regression results, were used as a baseline for UFP peak reduction. The reduction in exposure was estimated by comparing with that of the lowest flow rate measured. Also, due to limitations of instrumentation, the important range of particles <10 nm was not included. As gas stove burners produce particles with a mode around 5 nm, our estimates of source strengths and integrated exposures are likely to be low.
The guidance of Home Ventilating Institute (HVI) on range hood fan flow rates are based on the width and location of a cooking stove. According to the guidance, the minimum and recommended rates are 47 and 118 L/s for a 76 cm width stove on a wall used in this study. For cooking styles with high particle emissions, such as frying, grilling, cooking of fatty foods and especially with high temperatures, meeting the minimum requirement (47 L/s) may not be sufficient to remove most of the particles generated by cooking. Similar comments have been made by Singer et al. (Citation2012) regarding the minimum airflow requirement. The study demonstrated that the exposure to cooking-emitted UFP was most significant during the first hour following cooking. During this period, which is usually the meal time, the occupants will stay close to the source (kitchen or dining room). Providing sufficient kitchen ventilation, by using a higher flow rate range hood (higher than 118 L/s) during cooking, can greatly reduce UFP exposure by over 76%.
However, the impact of exhaust hood design can be significant and should be considered. For a range hood with lower fan flow rates or poor designs, some methods can be taken to reduce exposure to UFP from cooking, such as using back burners, cooking with lower temperatures if feasible, keeping range hood on during cooking and continuing use with some times after cooking, opening windows, and/or running an HVAC system (Wallace, Emmerich, and Howard-Reed Citation2002, Citation2004b; Howard-Reed, Wallace, and Emmerich Citation2003; Zhang et al. Citation2010; Delp and Singer Citation2012; Singer et al. Citation2012; Rim et al. Citation2012; Dobbin et al. Citation2018).
Flow rates higher than 146 L/s were not considered in this study. Higher exhaust flow rates have been associated with higher noise level, greater energy impacts, and risks of backdrafting from combustion appliances if makeup air at a similar flow rate is not provided (Delp and Singer, Citation2012; Rim et al. Citation2012; Singer et al. Citation2012; IRC, Citation2015). Therefore, caution should be taken when operating a very high flow rate range hood in homes.
4. Conclusions
This study investigated the effect of range hood fan flow rate on size-resolved UFP concentrations emitted from gas stove cooking. Assessments were conducted on three under-cabinet range hoods at six flow rates from 36 to 146 L/s. Cooking increased the total particle concentrations up to 65 times that of background levels, with an estimated exposure-relevant source strength of 1.8 × 10¹² (SE: 0.6 × 10¹¹) particles/min. During the operation of a venting range hood, particle removal by deposition was less significant compared to the increasing air exchange rate driven by exhaust ventilation.
Higher flow rates were more effective in reducing concentrations of UFP, and the extent to which the exhaust hood extends over the front burners had a large impact. With the flow rate varying from 36 to 146 L/s, the total particle peak reduction ranged from 25 to 98%. Exposure to total particles due to cooking varied from 0.9 to 5.8 × 10⁶ particles/cm3·hr three hours after cooking ended. The exposure after cooking was more significant than during the cooking period and the effect of range hood flow rate was most evident for the first hour after cooking. Comparing with the 36 L/s, higher flow rates of 120 and 146 L/s reduced the first-hour Ec by 76% (95% CI: 69–82%) and 85% (95% CI: 82–88%), respectively. After the first hour, the contribution from Eb to Et increased and the overall effect of the range hoods will be reduced with the passage of time.
Supplemental Material
Download Zip (379.8 KB)Acknowledgments
We thank Dr. Jennifer Logue for her great help in planning the study protocol. We thank Health Canada staff (Ronald Garson, Patrick Goegan, and Francis Lavoie) for their help in carrying out the cooking experiments. Finally, we thank Gary Mallach and Eric Lavigne for conducting the Health Canada internal review of this manuscript.
Related Research Data
References
- Abt, E., H. H. Suh, P. Catalano, and P. Koutrakis. 2000. Relative contribution of outdoor and indoor particle sources to indoor concentrations. Environ. Sci. Technol. 34 (17):3579–3587.
- ASTM. 2006. Standard test method for determining air change in a single zone by means of a tracer gas dilution. E741-00, West Conshohocken, PA.
- Buonanno, G., L. Morawska, and L. Stabile. 2009. Particle emission factors during cooking activities. Atmos. Environ. 43 (20):3235–3242.
- Chalupa, D. C., P. E. Morrow, G. Oberdörster, M. J. Utell, and M. W. Frampton. 2004. Ultrafine particle deposition in subjects with asthma. Environ. Health Perspect. 112 (8):879–882.
- Delp, W. W., and B. C. Singer. 2012. Performance assessment of U.S. residential cooking exhaust hoods. Environ. Sci. Technol. 46 (11):6167–6173.
- Dietz, R. N., R. W. Goodrich, E. A. Cote, and R. F. Wieser. 1986. Detailed description and performance of passive perfluorocarbon tracer system for building ventilation and air exchange measurements. STM STP 904, American Society for Testing and Materials, Philadelphia, PA.
- Dobbin, N. A., L. Sun, L. A. Wallace, J. Kearney, R. Kulka, H. You, T. Shin, M. St-Jean, D. Aubin, and B. C. Singer. 2018. The benefit of kitchen exhaust fan use after cooking—An experimental assessment. Build. Environ. 135 (1):286–296.
- Fogh, C. L., M. A. Byrne, J. Roed, and A. J. H. Goddard. 1997. Size specific indoor aerosol deposition measurements and derived i/o concentrations ratios. Atmos. Environ. 31 (15):2193–2203.
- Howard-Reed, C., L. A. Wallace, and S. Emmerich. 2003. Effect of ventilation systems and air filters on decay rates of particles produced by indoor sources in an occupied townhouse. Atmos. Environ. 37 (38):5295–5306.
- IRC. 2015. 2015 International Residential Code, chapter 15: Exhaust systems. Accessed July 10, 2018. https://codes.iccsafe.org/public/document/IRC2015/chapter-15-exhaust-systems.
- Kearney, J., L. A. Wallace, M. MacNeill, X. Xu, K. VanRyswyk, H. You, R. Kulka, and A. J. Wheeler. 2011. Residential indoor and outdoor ultrafine particles in Windsor, Ontario. Atmos. Environ. 45 (40):7583–7593.
- Klepeis, N. E., W. C. Nelson, W. R. Ott, J. P. Robinson, A. M. Tsang, P. Switzer, J. V. Behar, S. C. Hern, and W. H. Engelmann. 2001. The national human activity pattern survey (NHAPS): A resource for assessing exposure to environmental pollutants. J. Exposure Sci. Environ. Epidemiol. 11 (3):231–252.
- Kreyling, W. G., M. Semmler-Behnke, and W. Möller. 2006. Ultrafine particle-lung interactions: Does size matter? J. Aerosol. Med. 19 (1):74–83.
- Lee, W. C., J. M. Wolfson, P. J. Catalano, S. N. Rudnick, and P. Koutrakis. 2014. Size-resolved deposition rates for ultrafine and submicrometer particles in a residential housing unit. Environ. Sci. Technol. 48 (17):10282–10290.
- Li, C., W. Lin, and F. Jenq. 1993. Removal efficiency of particulate matter by a range exhaust fan. Environ. Int. 19 (4):371–380.
- Li, Y., and A. Delsante. 1996. Derivation of capture efficiency of kitchen range hoods in a confined space. Build. Environ. 31 (5):461–468.
- Li, Y., A. Delsante, and J. Symons. 1997. Residential kitchen range hoods—Buoyancy-capture principle and capture efficiency revisited. Indoor Air 7 (3):151–157.
- Long, C. M., H. H. Suh, P. J. Catalano, and P. Koutrakis. 2001. Using time- and size-resolved particulate data to quantify indoor penetration and deposition behaviour. Environ. Sci. Technol. 35 (10):2089–2099.
- Lunden, M. M., W. W. Delp, and B. C. Singer. 2015. Capture efficiency of cooking-related fine and ultrafine particles by residential exhaust hoods. Indoor Air 25 (1):45–58.
- Meier, R., M. Eeftens, I. Aguilera, H. C. Phuleria, A. Ineichen, M. Davey, M. S. Ragettli, M. Fierz, C. Schindler, N. Probst-Hensch, M.-Y. Tsai, and N. Künzli. 2015. Ambient ultrafine particle levels at residential and reference sites in urban and rural Switzerland. Environ. Sci. Technol. 49 (5):2709–2715.
- Nomura, Y., P. K. Hopke, B. Fitzgerald, and B. Mesbah. 1997. Deposition of particles in a chamber as a function of ventilation rate. Aerosol Sci. Technol. 27 (1):62–72.
- Oberdörster, G., R. M. Celein, J. Ferin, and B. Weiss. 1995. Association of particulate air pollution and acute mortality: Involvement of ultrafine particles? Inhal. Toxicol. 7 (1):111–124.
- Ott, W. R. 2007. Mathematical modeling of indoor air quality. In Exposure analysis, ed. W. R. Ott, A. C. Steinemann, and L. A. Wallace, 411–444. Boca Raton, FL: CRC-Press, Taylor & Francis Group.
- Özkaynak, H., J. Xue, J. Spengler, L. Wallace, E. Pellizzari, and P. Jenkins. 1996. Personal exposure to airborne particles and metals: Results from the particle team study in Riverside, California. J. Expo. Anal. Environ. Epidemiol. 6 (1):57–78.
- Palmiter, L., and T. Bond. 1991. Interaction of mechanical systems and natural infiltration. Paper presented at the 12th AIVC Conference, Ottawa, Canada.
- Pekkanen, J., A. Peters, G. Hoek, P. Tiittanen, B. Brunekreef, J. de Hartog, J. Heinrich, A. Ibald-Mulli, W. G. Kreyling, T. Lanki, K. L. Timonen, and E. Vanninen. 2002. Particulate air pollution and risk of ST-segment depression during repeated submaximal exercise tests among subjects with coronary heart disease: The exposure and risk assessment for fine and ultrafine particles in ambient air (ULTRA) study. Circulation 106 (8):933–938.
- Rim, D., L. A. Wallace, S. Nabinger, and A. Persily. 2012. Reduction of exposure to ultrafine particles by kitchen exhaust hoods: The effects of exhaust flow rates, particle size, and burner position. Sci. Total Environ. 432:350–356.
- Seinfeld, J. H., and S. N. Pandis. 2006. Atmospheric chemistry and physics: from air pollution to climate change. 2nd ed. New York: John Wiley & Sons.
- Sherman, M. H. 1992. Superposition in infiltration modeling. Indoor Air 2 (2):101–114.
- Singer, B. C., R. Z. Pass, W. W. Delp, D. M. Lorenzetti, and R. L. Maddalena. 2017. Pollutant concentrations and emission factors from scripted natural gas cooking burner use in nine Northern California homes. Build. Environ. 122:215–229.
- Singer, B. C., W. W. Delp, P. N. Price, and M. G. Apte. 2012. Performance of installed cooking exhaust devices. Indoor Air 22 (3):224–234.
- Sioutas, C., R. J. Delfino, and M. Singh. 2005. Exposure assessment for atmospheric ultrafine particles (UFPs) and implications in epidemiologic research. Environ. Health Perspect. 113 (8):947–955.
- Strak, M., H. Boogaard, K. Meliefste, M. Oldenwening, M. Zuurbier, B. Brunekreef, and G. Hoek. 2010. Respiratory health effects of ultrafine and fine particle exposure in cyclists. Occup. Environ. Med. 67 (2):118–124.
- Thatcher, T. L., A. C. K. Lai, R. Moreno-Jackson, R. G. Sextro, and W. W. Nazaroff. 2002. Effects of room furnishings and air speed on particle deposition rates indoors. Atmos. Environ. 36 (11):1811–1819.
- von Klot, S., G. Wolke, T. Tuch, J. Heinrich, D. W. Dockery, J. Schwartz, W. G. Kreyling, H. E. Wichmann, and A. Peters. 2002. Increased asthma medication use in association with ambient fine and ultrafine particles. Eur. Respir. Soc. 20 (3):691–702.
- Wallace, L. A. 2006. Indoor sources of ultrafine and accumulation mode particles: Size distributions, size-resolved concentrations, and source strengths. Aerosol Sci. Technol. 40 (5):348–360.
- Wallace, L. A., S. J. Emmerich, and C. Howard-Reed. 2002. Continuous measurements of air change rates in an occupied house for 1 year: The effect of temperature, wind, fans, and windows. J. Expo. Sci. Environ. Epidemiol. 12 (4):296–306.
- Wallace, L. A., S. J. Emmerich, and C. Howard-Reed. 2004a. Source strengths of ultrafine and fine particles due to cooking with a gas stove. Environ. Sci. Technol. 38 (8):2304–2311.
- Wallace, L. A., S. J. Emmerich, and C. Howard-Reed. 2004b. Effect of central fans and in-duct filters on deposition rates of ultrafine and fine particles in an occupied townhouse. Atmos. Environ. 38 (3):405–413.
- Wallace, L. A., and W. R. Ott. 2011. Personal exposure to ultrafine particles. J. Expo. Sci. Environ. Epidemiol. 21 (1):20–30.
- Wallace, L. A., W. R. Ott, and C. J. Weschler. 2015. Ultrafine particles from electric appliances and cooking pans: experiments suggesting desorption/nucleation of sorbed organics as the primary source. Indoor Air 25 (5):536–546.
- Wallace, L. A., F. Wang, C. Howard-Reed, and A. Persily. 2008. Contribution of gas and electric stoves to residential ultrafine particle concentrations between 2 nm and 64 nm: Size distributions and emission and coagulation rates. Environ. Sci. Technol. 42 (23):8641–8647.
- Wheeler, A. J., L. A. Wallace, J. Kearney, K. Van Ryswyk, H. You, R. Kulka, J. R. Brook, and X. Xu. 2011. Personal, indoor, and outdoor concentrations of fine and ultrafine particles using continuous monitors in multiple residences. Aerosol Sci. Technol. 45 (9):1078–1089.
- Wichmann, H. E., C. Spix, T. Tuch, G. Wölke, A. Peters, H. Heinrich, W. G. Kregling, and J. Heyder. 2000. Daily mortality and fine and ultrafine particles in Erfurt, Germany. Part I: Role of particle number and particle mass. Health Effects Inst. Res. Rep. 98:5–86.
- Zhang, Q., R. H. Gangupomu, D. Ramirez, and Y. Zhu. 2010. Measurement of ultrafine particles and other air pollutants emitted by cooking activities. Int. J. Environ. Res. Public Health 7 (4):1744–1759.