
 ?Mathematical formulae have been encoded as MathML and are displayed in this HTML version using MathJax in order to improve their display. Uncheck the box to turn MathJax off. This feature requires Javascript. Click on a formula to zoom.
Abstract
Flame-generated soot from miniCAST burners is increasingly being used in academia and industry as engine exhaust soot surrogate for atmospheric studies and instrument calibration. Previous studies have found that elemental carbon (EC) content of miniCAST soot is proportional to the mean particle size. Here, the characterization of a prototype miniCAST generator (5201 Type BC), which was designed to decouple the soot composition from the particle size and produce soot particles with high EC and BC content in a large size range, is reported. This prototype may operate either in a diffusion-flame or a partially premixed-flame mode, an option that was not available in former models. It was confirmed that soot properties, such as EC content and Ångström absorption exponent (AAE), were linked to the overall flame composition. In particular, combustion under fuel-rich conditions provided particles with size coupled to the EC fraction and AAE, i.e. smaller particles exhibited a lower EC fraction and higher AAE. In contrast, with fuel-lean diffusion flames and especially with premixed flames under near overall stoichiometric conditions small particles (down to 30 nm) with high EC/TC ratios (>60%) and low AAE (≈1.4) could be generated even without any thermal after-treatment. This new source might thus serve in the future as a useful surrogate for engine exhaust emissions and help to improve calibration procedures of common aerosol instruments.
Copyright © 2018 The Author(s). Published with license by Taylor & Francis Group, LLC
EDITOR:
Introduction
The terms soot, black carbon (BC) or elemental carbon (EC) in atmospheric or environmental science refer to particulate carbonaceous substances with strong light absorption properties that can directly interact with radiation in the atmosphere and thus influence the radiation budget of the Earth (Bond et al. Citation2013). Soot, a commonly used term to designate the ensemble of the particles formed by combustion, can be formed by natural sources, e.g. wildfires, or by anthropogenic sources, such as combustion engines and combustion of biomass or fossil fuels for heating, cooking or energy production (Penner et al. Citation2001). BC is a qualitative description of carbonaceous (soot) materials manifesting strong light absorption in the visible range, a high mass absorption coefficient (MAC) of at least 5 m2/g (at 550 nm), which are refractory, insoluble in water and organic solvents, consist of aggregates and contain a high sp2-bonded carbon fraction (Petzold et al. Citation2013). Carbonaceous materials can be also investigated with thermal-optical methods, which split total carbon (TC) into organic carbon (OC) and EC. Here, EC denotes the refractory part of the particles that can be oxidized in the presence of O2 at high temperatures as opposed to OC that volatilizes in inert gas at lower temperatures (Buseck et al. Citation2012). Although both terms, BC and EC, are often used interchangeably and describe quite similar materials, they are operational names or descriptions (Buseck et al. Citation2012).
Depending on the combustion conditions and the fuel the generated carbonaceous particles may exhibit different structures, compositions and optical properties. High temperature combustion as in diesel engines can produce EC particles with highly ordered nanostructures. Thereby the nanostructure is related to the degree of atomic order manifested by graphitic layer planes and their physical relation to each other (Hays and Vander Wal Citation2007) (expansion, orientation, curvature) inside the primary soot particles. However, soot particles consist not only of inert ordered carbonaceous EC but also of organic molecules (Kittelson Citation1998; Kennedy Citation2007). As soot particles are formed by incomplete combustion, depending on the conditions not all hydrocarbons and polycyclic aromatic hydrocarbons (PAHs) formed during the soot formation process are oxidized or transformed into ordered soot. A fraction of the organic molecules can be integrated in the structure or may leave the flame in the gas form and condense on the EC particles, forming an organic coating. Many PAHs are known to be harmful or even carcinogenic. When adsorbed on the particles, they can be transported far in the environment and aspirated by humans (Taylor, Watson, and Valberg Citation2001). Depending on the particle size (Kittelson Citation1998), the particles can reach deep regions in the lung or even penetrate in the bloodstream and cause inflammations or other adverse health effects (Heyder et al. Citation1986; Sydbom et al. Citation2001; Kennedy Citation2007; Kampa and Castanas Citation2008).
Because of their significant effect on health, environment, and climate (Pöschl Citation2005; Ramanathan et al. Citation2008; Bond et al. Citation2013), particulate emissions are regulated (EU Citation2008) and besides general particulate matter mass concentrations also BC and/or EC mass concentrations are monitored (Birmili et al. Citation2015). EC is quantified after filter sampling (or by semi-continuous measurements) by thermal-optical methods, where the particles on the filter are first heated in inert gas to quantify OC and afterwards oxidized according to the preselected temperature protocol (Cavalli et al. Citation2010; Chow et al. Citation2001). Typical instruments to quantify BC in the atmosphere rely on the principle of light absorption or attenuation by the BC particles either in situ or deposited on a filter. Filter-free real-time BC instruments are based on incandescence, photoacoustic and extinction minus scattering (EMS) techniques. While the laser induced incandescence LII e.g. in the single particle soot photometer SP2 uses high optical power to heat light-absorbing particles containing mainly BC or EC in a cavity to the point of incandescence and measure the incandescent emission (Eckbreth Citation1977; Melton Citation1984; Vander Wal and Weiland Citation1994; Michelsen et al. Citation2015), photoacoustic instruments like the micro soot sensor or the photoacoustic soot spectrometer PASS use a modulated intra-cavity laser for heating and cooling of the particles and detect the corresponding generated soundwaves with a microphone (Horvath Citation1993; Arnott et al. Citation1999). Absorption can be also determined with EMS methods. Here, extinction (e.g. with an optical extinction cell (Virkkula et al. Citation2005) or by cavity-attenuated phase shift CAPS) and scattering measurements (via nephelometry (Anderson et al. Citation1996)) of the aerosol soot particles are performed and absorption is calculated by subtracting scattering from extinction (Virkkula et al. Citation2005) to quantify the soot particle mass.
Filter-based instruments for BC quantification use transmission measurements of particles deposited on a filter, and the particle mass is calculated from the absorption after applying calibration factors and corrections for e.g. scattering. The most commonly used instruments are the multi-angle absorption photometer (MAAP) (Petzold and Schönlinner Citation2004), the particle soot absorption photometer (PSAP) (Bond, Anderson, and Campbell Citation1999) and the aethalometer (Hansen, Rosen, and Novakov Citation1984; Drinovec et al. Citation2015). Filter-based absorption photometers are robust, relatively inexpensive, highly automated and therefore suitable for unattended operation at monitoring sites. Nevertheless, the optical measurements of the aforementioned instruments are affected by filter and particle properties (McMurry Citation2000) and necessitate a reliable calibration procedure with suitable lab-generated surrogate aerosols.
A suitable aerosol for instrument calibration or validation must exhibit similar properties to the aerosol being monitored. As example, for the calibration of car exhaust condensation particle counters the calibration aerosol should be similar to diesel exhaust particles since the particle material and surface properties can influence the CPC counting efficiency (Kiwull, Wolf, and Niessner Citation2015; Tuch et al. Citation2016; Mamakos et al. Citation2013). Similarly, in order to improve reproducibility and comparability of absorption measurements, the generation of stable light-absorbing aerosols with well-characterized optical properties would be desirable. Typical generators for the controlled production of carbonaceous aerosols in the laboratory include spark discharge generators, e.g. GfG (Helsper et al. Citation1993), premixed flames like the McKenna burner (Maricq Citation2004, Citation2014; Kastelis and Zervas Citation2008; Ghazi et al. Citation2013) or diffusion flames, such as the inverted co-flow diffusion flame (Stipe et al. Citation2005; Argonaut Scientific Corporation Citation2018; Ghazi et al. Citation2013) and the combustion aerosol standard CAST or miniCAST (Moore et al. Citation2014; Durdina et al. Citation2016; Jing Ltd Citation2018). The latter find increased applications in academic research and industry as they are easy to operate and allow to readily adjust the particle size in a large range, typically between 10 nm and 200 nm (Jing Ltd Citation2018).
CAST generators use the principle of quenching a diffusion flame of variable fuel-to-air or carbon-to-oxygen (C/O) ratios to enable the soot particles to escape the flame before being fully oxidized. The particle size and properties are thereby controlled by the ratio of fuel and oxidation air in the flame and the dilution of the propane fuel with nitrogen (Schnaiter et al. Citation2006; Maricq Citation2014; Moore et al. Citation2014). It has been shown by Mamakos et al. (Citation2013) that the CPC counting efficiency changes with particle composition and the authors stated that miniCAST settings should be properly selected to generate not only the desired particles size but also the desired particle composition. Moreover, the BC content of miniCAST soot decreases significantly with increasing N2 fuel dilution (decreasing soot mobility diameter) (Maricq Citation2014). This raised concerns as to whether miniCAST soot is suitable as diesel-soot surrogate. Ideally, laboratory-generated soot should exhibit high EC and BC content (>60%) even at small particle sizes (geometric mean diameter GMD <100 nm) to mimic diesel (Puzun et al. Citation2011; Lu et al. Citation2012) and aircraft engine soot (Cheng et al. Citation2009; Lobo et al. Citation2015; Abegglen et al. Citation2016; Durdina et al. Citation2016) without thermal treatment to reduce the OC content.
The goal of the present study was to characterize a prototype miniCAST generator (model 5201 Type BC, Jing Ltd., Zollikofen, Switzerland) designed to produce soot having high EC content throughout the whole accessible size range and define stable operation points which would enable its application as calibration aerosol source. The new miniCAST generator does not only operate with a diffusion flame but also offers the possibility to mix air into the fuel (propane) to create premixed conditions instead of diluting propane with nitrogen as done in former models. Both operation modes (diffusion flame and premixed flame) were examined by varying the flame’s overall fuel-to-air ratio. The physicochemical and optical properties of the generated soot were investigated with different methods, including Scanning Mobility Particle Sizing (SMPS), thermal-optical OC/EC analysis and absorption measurements (aethalometer).
Experimental
Aerosol generation
The prototype miniCAST 5201 Type BC (Jing Ltd., Zollikofen, Switzerland), hereafter referred to simply as miniCAST BC, was designed to produce soot particles with high EC content even at small particle sizes. When operated with a diffusion flame, the fuel (propane) is surrounded by a gas flow of oxidation air. Both gases mix in the flame by diffusion. A stream of nitrogen is used to quench the flame and sweep the generated soot particles into a flow of dilution air. Dilution air is needed to stabilize the aerosol by reducing the concentration and thereby limiting aggregation. Unlike former miniCAST models, however, it is not possible to dilute the propane with nitrogen to obtain smaller particles; the size and other physicochemical properties of soot can be either tuned by varying the oxidation-air-to-propane ratio or by adding O2 to the oxidation air.
Additionally, the miniCAST BC can be operated in “premixed-flame” mode by mixing air directly in the propane flow. To promote further oxidation of the particles after formation, oxygen can be also added to the quench gas in both operation modes. Each gas flow can be varied in the range shown in . Depending on the settings of the other gases in the burner, the flows may be further restricted by the operation software for safety reasons.
Table 1. Operational gas flow ranges for the miniCAST BC and specifications of the used gases.
To characterize the miniCAST BC, different series of experiments (summarized in ) have been performed investigating the influence of the various tunable parameters on the properties of the generated aerosol. The dilution air and quench gas flows were set to 10 L/min and 7 L/min, respectively, unless otherwise stated. Detailed information on the conditions of each operation point can be found in the supporting information (Tables S1–S3).
Table 2. Series of experiments performed to characterize the miniCAST BC.
First, experiments with the diffusion flame were performed (series A–I). In Series A & B, the oxidation air flow was varied at a constant propane flow to achieve different overall C/O ratios (molar C/O ratio) or flame equivalent ratios Φ (comparison of actual molar ratios to stoichiometric ratios of fuel und oxidizer). In series C & D, the overall C/O ratio was changed by increasing the oxygen fraction in the oxidation air. In series E to I, the overall propane-to-air ratio was held constant, but the flows of propane and oxidation air were varied to change the flame size and thus the quenching position of the flame.
To map the operation of the miniCAST BC in the premixed-flame mode, gradually increasing amounts of air were mixed in the propane at fixed propane and oxidation air flows (series J–P). Since the oxidation air cannot be switched out completely (the flame would not be stable any more), the premixed flame has some diffusion flame characteristics. Thus, the herein called “premixed” flame conditions are, strictly speaking, a combination of a premixed and a diffusion flame. For simplicity, however, we will refer to this operation mode as “premixed-flame” mode.
The influence of oxygen in the quench gas was examined in Series Q–U. Here, the overall flow of quench gas was held constant at 7 L/min and the nitrogen and oxygen flows were varied in the range reported in .
Experimental setup and aerosol measurement
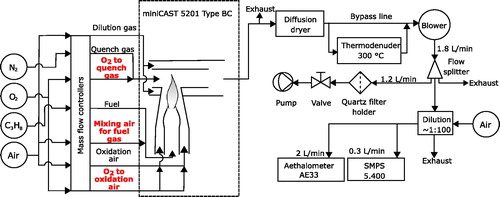
A schematic representation of the setup used in measurement series A–U is depicted in . The aerosol sampled at the outlet of the miniCAST's exhaust pipe was guided through a diffusion dryer filled with silica gel (Silica gel orange, Carl Roth AG, Arlesheim, Switzerland) and a thermodenuder (TDD 590, Topas GmbH, Dresden, Germany, 300 °C, max. flow 3 L/min) to remove volatile compounds or, alternatively, a metal tube with the same length and inner diameter to bypass the thermodenuder. A blower (U51D2-024KX-6 with controller H01X-525A9, Micronel AG, Tagelswangen, Switzerland) was used to draw the aerosol through the thermodenuder (or metal tube) at a constant flow rate of 1.8 L/min to ensure constant residence time. The flow through the blower was adjusted via a home-built potentiometer (part of blower’s control unit) and controlled with a Gilibrator (Gilian Gilibrator-2, Standard Flow Sensor & Cell, Sensidyne, St. Petersburg, USA) before every type of experiment. The aerosol was subsequently split in three parts with a flow splitter. One part was diluted (VKL 100 s dilution unit, 2 bar, Palas GmbH, Karlsruhe, Germany) at a ratio 1:91 (manufacturer’s calibration certificate) and then delivered to a Scanning Mobility Particle Sizer (SMPS 4.500, Grimm Aerosol Technik GmbH & Co. KG, Ainring, Germany, L-DMA, Am-241 neutralizer) and an aethalometer (AE33 Aethalometer, Magee Scientific, Berkeley, USA). The other part was sampled on quartz fiber filters (Advantec, Tokyo, Japan, QR-100, 47 mm, prebaked at 500 °C for 1.5 h) at a flow rate of 1.2 L/min, while the remaining aerosol was directed to the exhaust. The particle loaded quartz fiber filters were later analyzed with thermal-optical methods (Lab OC-EC Aerosol Analyzer, Sunset Laboratory Inc., Hillsborough, USA). It must be noted here that all data and figures in this article refer to the undenuded soot guided through the bypass line, unless otherwise stated.
Figure 1. Schematic illustration of the setup used for the characterization of the miniCAST BC. The new options available in the miniCAST BC are marked bold (and in red in the online version of the document).
The particle size distribution was determined with the SMPS in stepping mode. The column was suitable for particles with diameter between 11 nm and 1050 nm. The ratio of the DMA sheath air to the aerosol flow was 10:1 with aerosol and sheath air flow set to 0.3 L/min and 3 L/min, respectively. The resolution was set to 45 channels. Every measurement was repeated at least three times. The measurements were first averaged (a standard deviation of the mean was calculated for every size bin), then the size bin limits were corrected according to the current calibration function of the SMPS. Finally, the average GMD, geometric standard deviation GSD and total particle number concentration and their uncertainties (via linear uncertainty propagation) were determined. The reported size distributions and particle number concentrations have not been corrected for possible coagulation or diffusion losses in the tubes.
To investigate the composition of soot particles, an OC/EC Analyzer from Sunset Lab was used, which classified the carbonaceous material as EC and OC. For the analysis, the EUSAAR2-protocol (Cavalli et al. Citation2010) was modified by extending the last temperature step (850 °C) from 80 s in the original protocol to 120 s in order to ensure complete evolution of all carbon. The charring correction for pyrolized OC was performed by transmittance. OC, EC, and TC (TC = sum of OC and EC) were calculated by the software based on instrument calibration with sucrose solutions. Typical surface loadings of the filters were 1–16 µg C/cm2 EC and 0.2–22 µg C/cm2 OC. The software also reported the uncertainty of OC and EC, calculated as the detection limit of 0.2 µg C/cm2 plus 5% of the carbon mass determined in the analysis.
The aethalometer AE33 measures the change of light attenuation through a filter at seven wavelengths (370, 470, 520, 590, 660, 880, and 950 nm). It corrects for filter loading effects by two spot sampling to eliminate nonlinearities in light absorption (Drinovec et al. Citation2015). To derive the absorption coefficient from the attenuation coefficient
, the scattering correction factor
determined by the manufacturer for the build-in filter tape was used. No other scattering correction was applied. To obtain information about the wavelength dependence of the absorption, the Ångström absorption exponent AAE was calculated according to Drinovec et al. from the absorption at 470 nm and 950 nm only (i.e.,
(Drinovec et al. Citation2015)). The eBC (equivalent BC) mass concentration was determined from
by using the MAC value defined by the manufacturer (7.77 m2/g at 880 nm). As recommended by Petzold et al. (Citation2013) the term eBC and not BC mass concentration was used to clarify that the measured quantity may not be 100% BC. Unless otherwise stated, the aethalometer was operated with a total aerosol flow of 2 L/min and an integration time of 1 s for at least 30 s. The average value for the parameter of interest (e.g. eBC concentration, AAE or
) and the resulting standard deviation was then calculated.
Results and discussion
Diffusion flame: particle size, composition and optical properties
In the diffusion-flame operation mode, three different series of experiments were performed (Series A–B, C–D, and E–I) as summarized in . All size distributions were found to be unimodal with GMD ranging from about 20 nm to 210 nm (see Table S1 in the supporting information). The flame chemistry can be described by the overall fuel-to-air or C/O ratio (molar C/O ratio (Schnaiter et al. Citation2006)) or the fuel-to-air equivalence ratio Φ (comparison of actual molar ratios to stoichiometric ratios of fuel und oxidizer (Slowik et al. Citation2004)). The flame can be termed fuel-rich if C/O > 0.3 (or Φ > 1) and fuel-lean if C/O < 0.3 (or Φ < 1).
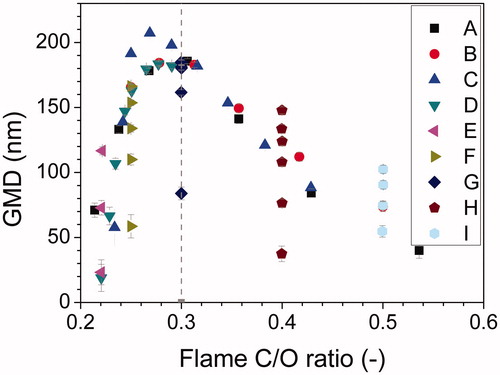
In Series A & B, the oxidation air flow was varied at a constant propane flow (either 60 or 70 mL/min) to obtain different overall C/O ratios. As shown in , size distributions with the largest GMD were observed at overall near stoichiometric conditions (C/O = 0.3). Decreasing the fuel-to-air ratio (C/O < 0.3) by increasing the oxidation air flow above the stoichiometric equivalent (1.43 L/min at 60 mL/min propane) resulted in fuel-lean conditions and smaller GMD. At fuel-rich conditions (C/O > 0.3), in contrast, the GMD increased with decreasing C/O ratio. The particle number concentration is maximal at the operation points with the highest C/O ratio and decreases with decreasing C/O ratio due to shortage of fuel. The eBC mass concentration, in contrast, shows a maximum at near stoichiometric conditions where the largest particles are generated. The latter decreases both towards more fuel-lean conditions because of the decrease in particle size and number concentration and towards more fuel-rich conditions because of decreasing particle size and increasing OC content (see Figure S7 in the supporting information).
Figure 2. GMD (and associated uncertainty) of particle size distribution for particles generated with a diffusion flame as a function of the overall C/O ratio, with the gray dashed line at C/O = 0.3 marking overall stoichiometric conditions. The gas flow rates of each series A–I are summarized in ; the condition of each single operation point can be found in Table S1.
In Series C–D, the C/O ratio was adjusted by adding oxygen to the oxidation air. In this way, the overall fuel-to-oxygen ratio could be decreased without significantly increasing the total flow of the gases in the burner. This is particularly important at high oxidation air flow rates which can cause turbulences and thus result in unstable flames. Here, the same correlation and trends as when varying the oxidation air (series A & B) could be achieved. The only difference, as mentioned before, is that the total flow of the oxidation gases can be kept lower. In series A, 1 L/min additional oxidation air was necessary to decrease the C/O ratio by about 0.2 while in series C only 175 mL/min of additional oxygen would be needed for the same result. This may also be the reason for the larger GMD in series C in the region near stoichiometric combustion () compared to the diffusion flame with much higher total gas flows. In contrast, series D has overall gas flows that do not deviate much from the ones of the diffusion flame conditions without oxygen and does not exhibit this behavior.
In series E–I, the overall propane-to-air ratio was each time held constant, but the flows of propane and oxidation air were varied to change the flame size and thus the quenching position in the flame (the height at which the quenching gas enters the burner is fixed). Decreasing both oxidation air and propane flows at a constant C/O ratio results in smaller flames, with nitrogen quenching the flame closer to the flame tip. Consequently, the particle number concentration and eBC mass concentration decrease while the GMD shifts to smaller particle sizes as can be seen in and Figure S7 in the supporting information. Besides the amount of carbon available for reaction and the flame composition, the flame dimension and quenching height can also influence the physicochemical properties of the particles since they determine their residence time in the flame regions (Bond and Bergstrom Citation2006).
Examples of particle number size distributions for series A are shown in Figure S3 in the supporting information. For all series unimodal size distributions were observed in the examined size range (11–1050 nm). This finding agrees with the results of Kim et al. (Citation2015) who used a miniCAST 6201C (examined C/O ratios = 0.22–0.89) or the findings of Durdina et al. (Citation2016) who used a miniCAST 5201C (C/O = 0.26–0.44) and a miniCAST 6203C at fuel-lean conditions (C/O = 0.15–0.3). No nucleation mode at slightly fuel-rich conditions was observed as found by Schnaiter et al. (Citation2006) who reported bi- and tri-modal size distributions at C/O ratios 0.33–0.44 with nucleation mode CMD at around 30–70 nm or Moore et al. (Citation2014) who observed an additional nucleation mode at 10–30 nm with a miniCAST 4201.
As shown in , there are several possibilities to generate a specific particle size. Of course, the flame conditions do not solely determine the particle size, but they determine also other particle properties like composition, morphology and nanostructure (Vander Wal and Tomasek Citation2004; Mamakos et al. Citation2013; Maricq Citation2014; Moore et al. Citation2014). As soot particles produced by flame generators are increasingly being considered as a standard material for instrument calibration, but the generated soot can vary widely in its characteristics, care must be taken to ensure that its properties are similar to the soot that is being monitored (Maricq Citation2014). For instance, for CPC calibration the morphology and surface chemistry of the particles can influence the wettability with the CPC working fluid and thus the CPC response (Mamakos et al. Citation2013; Kiwull, Wolf, and Niessner Citation2015; Tuch et al. Citation2016). In the case of absorption photometers (e.g. aethalometer, MAAP, PSAP), the optical properties of the soot particles are of primary importance. Thus, flame-generated aerosols need to exhibit high EC and BC fraction, AAE close to 1 and low single scattering albedo (SSA) to be a suitable surrogate for (thermally treated) engine exhaust soot.
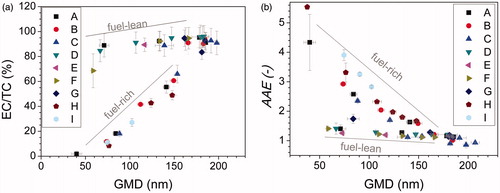
In and , the EC/TC ratio and AAE, respectively, of soot particles at selected operation points are presented. Here, it is obvious what has been mentioned before: particles with the same sizes can have different properties depending on the conditions in the flame. In each figure, two branches can be identified (starting at the maximum GMD) associated with fuel-lean and fuel-rich conditions, respectively. Measurements performed at fuel-lean conditions exhibit high EC/TC content (typically >80%) and low AAE (≤1.5) throughout the investigated particle size range. On the contrary, measurements performed at fuel-rich conditions exhibit high EC/TC ratio and low AAE only at large particle sizes (>150 nm) generated close to stoichiometric conditions. As the GMD decreases to 50 nm the EC/TC ratio falls steeply to almost 0 and the AAE rises above 4.5. Particles with low EC content exhibit a higher AAE due to the high OC content (Schnaiter et al. Citation2006), since OC absorbs stronger at smaller wavelengths. The AAE and the EC/TC ratio correlate well for all soot samples generated with the diffusion flame as shown in Figure S1 in the supporting information. The somewhat larger absolute uncertainty of the results in the “fuel-lean” branch in results from the higher EC concentration at this operation points (uncertainty component equal to 5% of the carbon mass fraction, see Subsection 2.2) and from the low mass loads of some filter samples of small particles. The higher standard deviation of some measurements at small particle sizes in originates also from the low mass concentrations of diluted aerosol combined with an aethalometer integration time of solely 1 s.
Figure 3. Correlation of (a) EC/TC ratio and (b) AAE with GMD of the number size distributions for the particles generated with diffusion flames. The gas flow rates of each series A–I are summarized in ; the condition of each single operation point can be found in Table S1.
The results for fuel-rich conditions agree with previous results from Schnaiter et al. (Citation2006) who analyzed the composition and optical properties of soot produced with a CAST burner at different C/O ratios ranging from very fuel-rich (C/O = 1) to slightly fuel-lean (C/O = 0.25). The authors observed increasing mobility equivalent median diameters (40 nm to about 300 nm), increasing EC content (from about 20% to >90%) as well as decreasing AAE (∼9 to 1.0) with decreasing C/O ratio. Although the particle sizes generated with the new miniCAST BC are different, they follow the same trend with a maximum GMD at fuel-lean near stoichiometric conditions followed by a decrease toward more fuel-rich combustion. Also, the AAE and the EC content follow the same trend (Figure S2) even though the methods used to determine the EC content and the AAE differ in the two studies. In the study of Schnaiter et al., however, the EC content was always coupled to the particle size. The authors did not investigate C/O ratios <0.25 nor the possibility of generating small particles with high EC content and small AAE.
When mapping the operation of a miniCAST 4202, Moore et al. (Citation2014) observed the largest soot mode diameters (∼120 nm) at slightly fuel-lean conditions in accordance with the findings in this study. Concerning the composition of the soot, however, they reported that the EC mass fraction (<10–70%) scaled with the modal diameter of the soot size distribution (20–120 nm) whether the soot size was tuned by changing the oxidation air flow or by adding nitrogen for diluting the propane. Therefore, in contrast to the present study, small particles were always associated with a low EC content even at fuel-lean conditions.
Török et al. (Citation2018) tuned the particle size (miniCAST 5201C) mostly by diluting propane with nitrogen at slightly fuel-rich conditions. The higher the dilution factor the smaller was the GMD (100–300 nm) and the higher the AAE (∼1–3.5) and OC/TC ratio (>10 to ∼50%) of the particles. Investigations with the smaller miniCAST 6201C performed by Kim et al. (Citation2015) revealed a different trend between C/O ratio and particle size than observed in our study. The largest particles (CMD ≈ 130 nm) were generated at the smallest C/O ratio of 0.22 and the particle sizes decreased with increasing C/O ratio until particles with CMD of 16 nm were generated at C/O = 0.89. Nevertheless, with the miniCAST 6201C the EC/TC fraction (<10–77%) increased and AAE (∼1.5–∼5) decreased with increasing particle size (16–130 nm).
Durdina et al. (Citation2016) investigated systematically the operation of the miniCAST 5201C and 6203C generators. In both cases, the EC content of untreated particles (5201C: 36–77%; 6203C: 37–77%) scaled with the particle size (5201C: 63 to ∼160 nm; 6203C: 26–70 nm), however, the correlation as a function of the C/O ratio was different for the two models. The authors attributed this to the different geometries of the burners, e.g. the quench track position and the flow rate of the quench gas. This implies that the particle size, composition and optical properties of the soot do not only depend on the C/O ratio, but also that the burner itself with the fixed geometry of the gas inlets, burning chamber and total gas flows (from the fuel gas to quench or dilution gas) has an influence.
To the best of our knowledge, this is the first time it has been clearly shown that the chemical and optical properties of CAST soot can be decoupled to a large extent from the particle size and therefore particles with high EC fraction and AAE close to 1 can be produced in a size range of <50–200 nm. The key, here, is to work at fuel-lean conditions (Saffaripour et al. Citation2017). Although operation points defined for a specific miniCAST model might not always be directly applicable to other burner models, it might be possible to observe the fuel-lean and fuel-rich branches depicted in in other miniCAST diffusion-flame burners by changing the fuel-to-air ratio of the diffusion flame without diluting the fuel with nitrogen.
Premixed flame: particle size, composition and optical properties
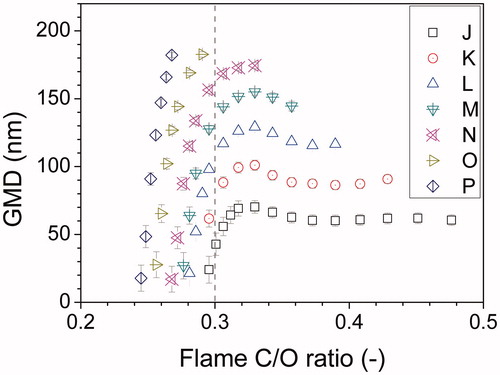
Whereas dilution of propane with nitrogen, as it is carried out in most other CAST models, decreases the particle size by cooling down the flame without changing the overall C/O ratio (Moore et al. Citation2014), adding air in the propane flow changes the overall C/O ratio in the flame as well as the total fuel gas flow. shows that when starting at fuel-rich conditions, as in series J–L, increasing the fraction of air in propane has practically no effect on the GMD of the particle size distribution for C/O ratios down to 0.35. Further mixing air leads to a slight increase of the GMD until C/O = 0.33 followed by a steep decrease. For all other series only parts of the described behavior occur depending on the C/O ratio of the starting point. For series M the increase in the GMD is still visible, while series N started at C/O = 0.33 and thus at the maximum GMD for that series. The two series O and P starting at fuel-lean conditions show only the decreasing behavior as the starting points were chosen at C/O ratios lower than 0.33. The premixed-flame operation mode of the miniCAST BC offers therefore the possibility to generate a specific particle size under several different flame conditions. Here, it must be emphasized that the x-axis of denotes the overall C/O ratio taking also into account the oxygen in the oxidation air flow. The particle number concentration (see Figure S8 in the supporting information) remains nearly constant at C/O ratios larger than 0.4. When increasing the mixing air and thus decreasing the overall C/O ratio, the particle number concentration (as well as the eBC mass concentration) decreases rapidly.
Figure 4. GMD (and associated uncertainties) of particle size distribution for particles generated with a premixed flame as a function of the overall C/O ratio. The gray dashed line at C/O = 0.3 marks the overall stoichiometric conditions. Series J–P possess different starting points (point corresponding to the highest overall C/O ratio). The C/O ratio is tuned by gradually increasing the amount of mixing air in the fuel. The gas flow rates of each series are summarized in ; the condition of each single operation point can be found in Table S2.
In and , the EC/TC ratios and AAEs of soot particles at selected operation points are presented (Series J–P). Similar to the diffusion-flame mode (see ), particles of the same size can exhibit different properties depending on the conditions in the flame under which they were formed. The AAE and the EC content of the generated soot samples are correlated (Figure S1b), i.e. the absorption of soot with high EC content manifests low wavelength dependence (AAE close to 1). The larger absolute uncertainty of the results in the upper part of results from the higher EC concentration at this operation points (uncertainty component equal to 5% of the carbon mass fraction, see Subsection 2.2) and the low mass loads of some filter samples of small particles. The larger standard deviation of the very small particles in originates from the low mass concentrations of diluted aerosol combined with an integration time of solely 1 s of single aethalometer measurements.
Figure 5. Correlation of (a) EC/TC ratio and (b) AAE with GMD of the size distributions for particles generated with premixed flames. The gas flow rates of each series are summarized in ; the condition of each single operation point can be found in Table S2.
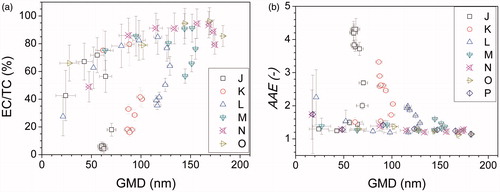
When moving from highly fuel rich C/O ratios towards stoichiometric conditions by adding mixing air to propane (series J–L), the EC content increases and the AAE decreases, while the particle size remains approximately constant. Taking series J as an example, the particles generated at the starting point of the series, i.e. at the highest C/O ratio, are the ones with GMD of about 60 nm, a low EC/TC ratio <5% and a high AAE > 3. When decreasing the C/O ratio by adding more premixing air (moving left in ), the EC/TC ratio increases in , respectively the AAE decreases in when following the points of the series. At near stoichiometric conditions the particles exhibit the highest EC/TC ratio and lowest AAE. Further addition of mixing air to propane and thus further deviation from stoichiometric conditions to a more fuel lean operation results in smaller particle sizes. With decreasing particle size the EC/TC fraction begins to gradually drop while the AAE seems to slightly rise again. Nevertheless, the EC/TC ratio stays quite high while the AAE stays low. In principle, the same behavior is found for all series. Depending on the C/O ratio of the starting point this may already possess high EC/TC content and low AAE. In this case, all points of the series (e.g. O & P) are located in the upper part of (i.e. high EC/TC) and lower part of (i.e. low AAEs). In contrast to the diffusion flame, where it was favorable to work at fuel-lean conditions, with the premixed flame it is recommended to stay close to the overall stoichiometric point or at rather fuel-lean conditions in order to generate soot with high EC/TC ratio and low AAE throughout the size range 20–200 nm.
Most studies on premixed flames examine soot properties as a function of the sampling height above the burner and are performed with ethylene-air-flames, which are normally surrounded by an inert gas sheath flow to stabilize the flame (Maricq Citation2004, Citation2014; Ghazi et al. Citation2013). Thus, a direct comparison with the air-stabilized propane-flame of the miniCAST BC is not possible. Slowik et al. (Citation2004), however, used a premixed propane-nitrogen-oxygen-flame, which was surrounded by a nitrogen-oxygen mixture (30% O2), and thus bears a resemblance to the conditions in the miniCAST BC. Even though the authors only looked at size-selected particles (100–400 nm), they also observed that the soot characteristics were highly dependent on the flame temperature and the equivalence ratio Φ. They distinguished two types of soot: one generated at Φ > 4 and one generated at Φ < 4, with soot generated at Φ > 4 having a lower EC content and BC mass fraction but higher PAH content and fractal dimension. Unlike Slowik et al. (Citation2004), in the experiments with the miniCAST BC no step functions for the aforementioned soot properties were observed and no size selected particles were examined. Yet, the same trend of increasing EC content with decreasing Φ of the premixed flame (without taking the oxygen content of the oxidation air around the premixed flame into account) was observed. All series starting at high overall C/O ratios (>∼0.34) possessed constant EC/TC content and GMD at high Φ of the premixed flame, while later at a certain value Φ between 3 and 14 exhibited a sharp increase or decrease, respectively (Figure S6 in the supporting information). The position of the change seems not to be linked solely to the composition of the premixed flame but the overall flame composition instead (including the oxidation air around the flame), suggesting that both the premixed air and the oxidation air around the flame determine the flame properties and thus the properties of the soot.
In most commercially available miniCAST models, small soot particles are generated by diluting the propane with nitrogen to cool the flame. Since the particle size is directly linked to the EC content (Moore et al. Citation2014), this results in increased PAH fractions. Maricq (Citation2014) found that the BC content of miniCAST soot decreases also significantly with increasing N2 fuel dilution (decreasing soot mobility diameter) even after thermal treatment at 600 °C to remove semi-volatile organic material. The low BC content correlates with the presence of PAH and fullerene fragment ions in the laser ablation mass spectra, which indicates that these are solid particles (cannot be removed by the catalytic stripper [CS]) exhibiting lower light absorption as they are not yet fully carbonized. The design of the new miniCAST BC allows to circumvent this problem. When the latter is operated with a premixed flame at stoichiometric or fuel-lean conditions, particles down to 30 nm with 65% EC/TC and AAE < 1.4 can be produced. This is a considerable advantage whenever model aerosols with high EC or BC fractions are needed for instrument calibration.
Stability, repeatability and influence of sample after-treatment/conditioning
To test the stability of the miniCAST BC, this was operated for more than 3 h at two selected operation points (series O, 0 & 150 mL/min mixing air). During this time no change of the GMD occurred. The relative standard deviation of the GMD was in both cases less than 1%. The particle number concentration remained stable for at least 3 h (relative standard deviation of 4%). Similarly, the AAE remained stable within this time period (relative standard deviation ≤5.5%). In the case of >180 nm particles, however, a relative standard deviation of the particle concentration of 15% was observed due to retention of particles at the nozzle of the dilution unit and in the sampling tube. Repeated analyses performed by switching between these operation points on the same or different days during one month showed relative deviations ≤5.5% from the mean GMD for all particle sizes. For the particle number concentration, deviations from the mean ≤10% were typically observed. The repeatability in particle size and concentration for the miniCAST BC is therefore better than those of the miniCAST 4202 used by Moore et al. (Citation2014) who observed a variation of the soot number concentration by about a factor of two and a variation of the modal diameter smaller than 10%. Moreover, Moore et al. (Citation2014) found higher variabilities at high oxidation air flows and explained this by the smaller particle size and concentration due to increased oxidation. This finding holds also for the miniCAST BC, where at the maximum oxidation air flow of 2 L/min higher deviations were observed. In the case of the miniCAST BC, however, it is rather the high flow and thus high flow velocity in the flame that might cause unstable conditions. Because of this, operation points at fuel-lean premixed conditions generating smaller particle sizes seem to be more stable and reproducible than their size equivalent at fuel-lean conditions but with a high oxidation air flow in diffusion flames.
To further tune the properties of the generated soot, oxygen may be added to the quench gas flow. As summarized in (Series Q–U), oxygen was mixed in the nitrogen to investigate the influence on particle size and composition. Starting with pure nitrogen, the oxygen content in the quench gas was gradually increased while holding the overall quench gas flow constant. The upper limit of 28% oxygen was determined by the lowest flow of nitrogen allowed by the software (5 L/min). A further increase of the oxygen content was impossible without increasing the overall gas flow. As displayed in Figure S10 (supporting information), increasing oxygen in the quench gas from 0% to 28% (by volume) has neither an effect on the particle size distribution nor on the composition of the particles and their optical properties as GMD, EC/TC content and AAE stay constant. This holds for all particles whether generated at fuel-lean, near stoichiometric or fuel-rich conditions. The reason might be that dilution air is either way inserted to the aerosol only a few cm after the introduction of the quench gas. Higher oxygen ratios in the quench gas might be necessary to increase the overall oxygen content to a point where oxidation of the soot can continue even after leaving the flame and cooling of the gas.
For many applications it is useful to remove volatile organic compounds from the generated soot to increase the EC/TC content. This can be done with a volatile particle remover, such as a CS (Mamakos et al. Citation2013; Moore et al. Citation2014; Durdina et al. Citation2016) or a thermodenuder (Maricq Citation2014; Kim et al. Citation2015) operated at temperatures of about 300–600 °C. In most studies, the OC content is correlated with the particle size, with smaller particles having higher OC content as these are either produced at fuel-rich conditions or by diluting propane with nitrogen (Maricq Citation2014; Moore et al. Citation2014; Durdina et al. Citation2016). In some cases, miniCASTs produce OC-rich small particles even at fuel-lean conditions without dilution with nitrogen (Moore et al. Citation2014). By using a thermodenuder or a CS, the authors of the aforementioned studies observed a significant decrease of the OC content of their particles. The OC/TC content could be decreased e.g. from 85% to 65% for 40 nm particles and from 30% to ∼15% for 100 nm particles (Moore et al. Citation2014) or from ∼25% to 7% for 160 nm particles and from 35% to 15% for 60 nm particles (Durdina et al. Citation2016). Operating the miniCAST BC at fuel-lean conditions, particles with low OC/TC content could be generated even without using a volatile particle remover. More specifically, OC/TC <15% at GMD ≥70 nm and OC/TC <35% at GMD ≥30 nm could be generated in the diffusion and premixed flame mode, respectively. To our knowledge, even without volatile particle remover, particles with lower OC could be generated with the miniCAST BC than with other miniCAST models coupled to a volatile particle remover. With the miniCAST BC addition of a thermodenuder at 300 °C has an effect only when treating particles generated under fuel-rich conditions. On the contrary, particles generated under fuel-lean conditions (see Figure S11) were not affected by thermal treatment.
Comparison to real-world diesel and aircraft soot
MiniCAST soot generators are often used to simulate soot emitted from real-world sources, e.g. diesel or aircraft turbofan engines. In this way, stable and reproducible aerosols can be produced to calibrate common aerosol instrumentation used in the laboratory or field. The properties of soot particles generated by the new miniCAST BC are summarized in . For comparison, the properties of diesel engine and aircraft generated soot are also listed. As described in Sections 3.1 and 3.2, the properties of the particles generated by the miniCAST BC depend strongly on the operation conditions, i.e. fuel-lean vs. fuel-rich conditions, diffusion flame vs. premixed flame. The same is also valid for the engine-generated particles. There, even more parameters may influence the particle properties, such as the engine itself, the operation conditions of the engine like pressure, loads and after-treatment and also the fuel (Ess et al. Citation2016; Caroca et al. Citation2011; Cheng et al. Citation2009; Herndon et al. Citation2008; Lobo et al. Citation2015). Engine generated particles can thus exhibit an even higher variability of properties than the miniCAST-generated soot.
Table 3. Summary of the properties of the analyzed miniCAST soot in comparison with diesel and aircraft soot. The miniCAST BC number and mass concentrations have been corrected for the dilution factor (1:91) but not for coagulation or diffusion losses in the tubes.
With the miniCAST BC it is possible to generate particles in the same size ranges as diesel and aircraft engines. As the real-world diesel and aircraft engines emit soot particles of various compositions from low to high EC concentration, a surrogate for them should not only generate particles of the right size but also of similar composition and optical properties. To simulate diesel soot particles, which normally consist of mostly EC (≥60% (Lu et al. Citation2012)) at particle sizes often smaller than 100 nm, the miniCAST BC should be operated either in the diffusion-flame mode at fuel-lean conditions or in the premixed flame mode near stoichiometric conditions (high EC and low AAE). When in contrast aircraft engine soot with high OC (e.g. soot coated with condensed primary organic matter) are to be simulated, fuel-rich settings may be used to achieve the high fraction of OC (Cheng et al. Citation2009; Kinsey et al. Citation2011) or volatile material (Kinsey et al. Citation2010) of 30–90%. Here, it must be noted, however, that the nature of miniCAST OC could well be different than the coating around the soot cores. If, instead, the nonvolatile aircraft particles should be simulated (Lobo et al. Citation2015; Abegglen et al. Citation2016) to test or calibrate measurement instruments, the miniCAST can easily be switched to operation points at fuel-lean conditions generating particles with low OC content.
Summary and conclusions
MiniCAST generated soot is often used as model aerosol for real world combustion particles emitted by diesel or aircraft engines, to validate or calibrate measurement instruments or to study aerosol processes. For this reason, it is important that the soot generator not only operates in a stable and reproducible manner but also that the produced particles are as similar as possible to the particles being modeled. In this study, the particles produced by a new version of the frequently used miniCAST product series were characterized in terms of particle size distributions, EC content and AAE using an SMPS, an EC/OC analyzer (EUSAAR 2 protocol) and a 7-wavelength aethalometer, respectively. In contrast to other miniCAST models which rely exclusively on diffusion flames for particle generation, the miniCAST 5201 BC offers additionally the options to use a partially premixed diffusion flame or add oxygen to the oxidation air in the flame. In this way, particle properties can not only be tuned by varying the oxidation-air-to-propane ratio and thus the molar composition (C/O ratio) in the flame, but also by premixing air to the propane before this enters the burner.
Size distributions with various GMDs can be generated at different overall C/O ratios in both operation modes. The properties (EC content and AAE) of the particles are linked to the overall flame composition, i.e. combustion at overall fuel-rich conditions generates particles with high OC content and high AAE, while particles generated at overall fuel-lean conditions possess higher EC content and lower AAE.
With the diffusion flame, the largest accessible particle size is about 180–210 nm for particles generated at overall near stoichiometric conditions. As expected, these particles exhibit a high EC/TC ratio of >90% and an AAE near 1 indicating their BC-like composition. By operating the miniCAST 5201 BC with fuel-rich diffusion flames, particles (<50–160 nm) with GMD coupled to their EC/TC ratio (2–60%) and AAE (1.1–4.5, with AAE decreasing as particle size increases,) are generated. On the contrary, under fuel-lean conditions particles with GMD down to 60 nm showing high EC/TC ratios (≥80%) and low AAE (<1.4) even without the use of a volatile particle remover could be generated.
Particles produced in fuel-rich premixed flames behave similar to particles generated in the fuel-rich diffusion flames. They cover the whole range of EC/TC fractions (1–90%) and AAE (1.1–4.5) over their particle size range (GMD ≤40–180 nm). The main difference to the fuel-rich diffusion flames is that the EC composition and the AAE are no longer correlated to the particle size. Instead, particles of the same size with various EC compositions and AAE can be generated. Moreover, with premixed flames at overall stoichiometric or fuel-lean conditions it is possible to generate particles down to 30 nm with high EC/TC content (65%) and low AAE (1.4).
To conclude, the miniCAST 5201 Type BC generator allows to decouple to a large extent the soot particle size from the composition (EC/TC ratio) of the particles. It is therefore possible to generate BC-like particles in a broad size range even without the use of a volatile particle remover. This new source could serve in the future as model aerosol for the calibration of engine exhaust CPCs and different equivalent BC measuring instruments. It may thus provide valuable support for future studies of atmospheric aerosols and calibration of BC mass instruments used for regulatory measurements of engine emissions.
This work focused primarily on varying the operation parameters of the miniCAST 5201 Type BC generator, exploring and presenting its potentials and limitations. Further physical and chemical characterization of the soot aerosols would be desirable, in particular for small particles (<100 nm) exhibiting high EC/TC ratios. Optical properties, such as the absorption coefficient and the SSA, of these small particles should be investigated as well as their morphology and nanostructure.
Supplemental Material
Download Zip (1.4 MB)Acknowledgments
The authors would like to thank Dr. Lianpeng Jing (Jing Ltd.) for useful discussions. This work was carried out in the context of the 16ENV02 Black Carbon project of the European Union through the European Metrology Programme for Innovation and Research (EMPIR).
Additional information
Funding
Related Research Data
References
- Abegglen, M., B. T. Brem, M. Ellenrieder, L. Durdina, T. Rindlisbacher, J. Wang, U. Lohmann, and B. Sierau. 2016. Chemical Characterization of Freshly Emitted Particulate Matter from Aircraft Exhaust Using Single Particle Mass Spectrometry. Atmos. Environ. 134:181–97. doi:10.1016/j.atmosenv.2016.03.051.
- Anderson, T. L., D. S. Covert, S. F. Marshall, M. L. Laucks, R. J. Charlson, A. P. Waggoner, J. A. Ogren, R. Caldow, R. L. Holm, F. R. Quant, et al. 1996. Performance Characteristics of a High-Sensitivity Three-Wavelength Total Scatter/Backscatter Nephelometer. J. Atmos. Oceanic Technol. 13 (5):967–86. doi:10.1175/1520-0426(1996)013 < 0967:PCOAHS >2.0.CO;2.
- Argonaut Scientific Corporation. 2018. Miniature Inverted Soot Generator. Accessed June 5, 2018. https://www.argonautscientific.com/products.
- Arnott, W. P., H. Moosmüller, C. F. Rogers, T. Jin, and R. Bruch. 1999. Photoacoustic Spectrometer for Measuring Light Absorption by Aerosol: Instrument Description. Atmos. Environ. 33 (17):2845–52. doi:10.1016/S1352-2310(98)00361-6.
- Birmili, W., J. Sun, K. Weinhold, M. Merkel, F. Rasch, G. Spindler, A. Wiedensohler, S. Bastian, G. Löschau, A. Schladitz, et al. 2015. Atmospheric Aerosol Measurements in the German Ultrafine Aerosol Network (GUAN) Part 3: Black Carbon Mass and Particle Number Concentrations 2009 to 2014. Gefahrstoffe - Reinhaltung Der Luft. 75 (11/12):479–88.
- Bond, T. C., T. L. Anderson, and D. Campbell. 1999. Calibration and Intercomparison of Filter-Based Measurements of Visible Light Absorption by Aerosols. Aerosol. Sci. Technol. 30 (6):582–600. doi:10.1080/027868299304435.
- Bond, T. C., and R. W. Bergstrom. 2006. Light Absorption by Carbonaceous Particles: An Investigative Review. Aerosol Sci. Technol. 40 (1):27–67. doi:10.1080/02786820500421521.
- Bond, T. C., S. J. Doherty, D. W. Fahey, P. M. Forster, T. Berntsen, B. J. Deangelo, M. G. Flanner, S. Ghan, B. Kärcher, D. Koch., et al. 2013. Bounding the Role of Black Carbon in the Climate System: A Scientific Assessment. J. Geophys. Res. Atmos. 118 (11):5380–552. doi:10.1002/jgrd.50171.
- Buseck, P. R., K. Adachi, A. Gelencsér, É. Tompa, and M. Pósfai. 2012. Are Black Carbon and Soot the Same? Atmos. Chem. Phys. Discuss 12 (9):24821–46. doi:10.5194/acpd-12-24821-2012.
- Caroca, J. C., F. Millo, D. Vezza, T. Vlachos, A. De Filippo, S. Bensaid, N. Russo, and D. Fino. 2011. Detailed Investigation on Soot Particle Size Distribution During DPF Regeneration, Using Standard and Bio-diesel Fuels. Ind. Eng. Chem. Res. 50 (5):2650–8. doi:10.1021/ie1006799.
- Cavalli, F., M. Viana, K. E. Yttri, J. Genberg, and J. P. Putaud. 2010. Toward a Standardised Thermal-Optical Protocol for Measuring Atmospheric Organic and Elemental Carbon: The EUSAAR Protocol. Atmos. Meas. Tech. 3 (1):79–89. doi:10.5194/amt-3-79-2010.
- Cheng, M. D., E. Corporan, M. J. Dewitt, and B. Landgraf. 2009. Emissions of Volatile Particulate Components from Turboshaft Engines Pperated with JP-8 and Fischer-Tropsch Fuels. Aerosol Air Qual. Res. 9 (2):237–56. doi:10.4209/aaqr.2008.11.0059.
- Chow, J. C., J. G. Watson, D. Crow, D. H. Lowenthal, and T. Merrifield. 2001. Comparison of IMPROVE and NIOSH Carbon Measurements. Aerosol Sci. Technol. 34 (1):23–34. doi:10.1080/02786820119073.
- Drinovec, L., G. Močnik, P. Zotter, A. S. H. Prévôt, C. Ruckstuhl, E. Coz, M. Rupakheti, J. Sciare, T. Müller, A. Wiedensohler, et al. 2015. The “Dual-Spot” Aethalometer: An Improved Measurement of Aerosol Black Carbon with Real-Time Loading Compensation. Atmos. Meas. Tech. 8 (5):1965–79. doi:10.5194/amt-8-1965-2015.
- Durdina, L., B. T. Brem, A. Setyan, F. Siegerist, T. Rindlisbacher, and J. Wang. 2017. Assessment of Particle Pollution from Jetliners: From Smoke Visibility to Nanoparticle Counting. Environ. Sci. Technol. 51 (6):3534–41. doi:10.1021/acs.est.6b05801.
- Durdina, L., P. Lobo, M. B. Trueblood, E. A. Black, S. Achterberg, D. E. Hagen, B. T. Brem, and J. Wang. 2016. Response Of Real-Time Black Carbon Mass Instruments to Mini-CAST Soot. Aerosol Sci. Technol. 50 (9):906–18. doi:10.1080/02786826.2016.1204423.
- Eckbreth, A. C. 1977. Effects of Laser-Modulated Particulate Incandescence on Raman Scattering Diagnostics. J. Appl. Phys. 48 (11):4473–79. doi:10.1063/1.323458.
- Ess, M. N., H. Bladt, W. Mühlbauer, S. I. Seher, C. Zöllner, S. Lorenz, D. Brüggemann, U. Nieken, N. P. Ivleva, and R. Niessner. 2016. Reactivity and Structure of Soot Generated at Varying Biofuel Content and Engine Operating Parameters. Combust. Flame 163:157–69. doi:10.1016/j.combustflame.2015.09.016.
- EU. 2008. Directive 2008/50/EC of the European Parliament and of the Council of 21 May 2008 on Ambient Air Quality and Cleaner air for Europe. Off. J. Eur. Union 152:1–43.
- Ghazi, R., H. Tjong, A. Soewono, S. N. Rogak, and J. S. Olfert. 2013. Mass, Mobility, Volatility, and Morphology of Soot Particles Generated by a McKenna and Inverted Burner. Aerosol Sci. Technol. 47 (4):395–405. doi:10.1080/02786826.2012.755259.
- Hansen, A. D. A., H. Rosen, and T. Novakov. 1984. The Aethalometer — An Instrument for the Real-Time Measurement of Optical Absorption by Aerosol Particles. Sci. Total Environ. 36:191–196. doi:10.1016/0048-9697(84)90265-1.
- Hays, M. D., and R. L. Vander Wal. 2007. Heterogeneous Soot Nanostructure in Atmospheric and Combustion Source Aerosols. Energy Fuels 21 (2):801–11. doi:10.1021/ef060442h.
- Helsper, C., W. Mölter, F. Löffler, C. Wadenpohl, S. Kaufmann, and G. Wenninger. 1993. Investigations of a New Aerosol Generator for the Production of Carbon Aggregate Particles. Atmos. Environ. Part A, Gen. Top. 27 (8):1271–1275. doi:10.1016/0960-1686(93)90254-V.
- Herndon, S. C., J. T. Jayne, P. Lobo, T. B. Onasch, G. Fleming, D. E. Hagen, P. D. Whitefield, and R. C. Miake-Lye. 2008. Commercial Aircraft Engine Emissions Characterization of In-use Aircraft at Hartsfield-Jackson Atlanta International Airport. Environ. Sci. Technol. 42 (6):1877–83. doi:10.1021/es072029+.
- Heyder, J., J. Gebhart, G. Rudolf, C. F. Schiller, and W. Stahlhofen. 1986. Deposition of Particles in the Human Respiratory Tract in the Size Range 0.005–15 μm. J. Aerosol. Sci. 17 (5):811–25. doi:10.1016/0021-8502(86)90035-2.
- Horvath, H. 1993. Atmospheric Light Absorption- A Review. Atmos. Environ. 27 (3):293–317. doi:10.1016/0960-1686(93)90104-7.
- Jing Ltd. 2018. CAST Combustion Aerosol Standard. Accessed May 1, 2018. http://www.sootgenerator.com/index.htm.
- Kampa, M., and E. Castanas. 2008. Human Health Effects of Air Pollution. Environ. Pollut. 151 (2):362–367. doi:10.1016/j.envpol.2007.06.012.
- Kastelis, N., and E. Zervas. 2008. Analysis of Flat Burners Used to Study Gaseous Pollutants Emitted From Combustion of Hydrocarbons. 2nd International Conference Waste Management Water Pollution, Air Pollution, Indoor Climate Corfu. Greece, World Scientific and Engineering Academy and Society WSEAS Press, October 26–28, 251–56.
- Kennedy, I. M. 2007. The Health Effects of Combustion-Generated Aerosols. Proc. Combust. Inst. 31 (2):2757–2770. doi:10.1016/j.proci.2006.08.116.
- Kim, J., H. Bauer, T. Dobovičnik, R. Hitzenberger, D. Lottin, D. Ferry, and A. Petzold. 2015. Assessing Optical Properties and Refractive Index of Combustion Aerosol Particles Through Combined Experimental and Modeling Studies. Aerosol Sci. Technol. 49 (5):340–50. doi:10.1080/02786826.2015.1020996.
- Kinsey, J. S., Y. Dong, D. C. Williams, and R. Logan. 2010. Physical Characterization of the Fine Particle Emissions from Commercial Aircraft Engines during the Aircraft Particle Emissions Experiment (APEX) 1-3. Atmos. Environ. 44 (17):2147–56. doi:10.1016/j.atmosenv.2010.02.010.
- Kinsey, J. S., M. D. Hays, Y. Dong, D. C. Williams, and R. Logan. 2011. Chemical Characterization of the Fine Particle Emissions from Commercial Aircraft Engines during the Aircraft Particle Emissions Experiment (APEX) 1 to 3. Environ. Sci. Technol. 45 (8):3415–21. doi:10.1021/es103880d.
- Kittelson, D. B. 1998. Engines and Nanoparticles: A Review. J. Aerosol Sci. 29 (5–6):575–88. doi:10.1016/S0021-8502(97)10037-4.
- Kiwull, B., J. C. Wolf, and R. Niessner. 2015. Response Characteristics of PMP Compliant Condensation Particle Counters Toward Various Calibration Aerosols. Aerosol. Sci. Technol 49 (2):98–108. doi:10.1080/02786826.2014.1002603.
- Lobo, P., L. Durdina, G. J. Smallwood, T. Rindlisbacher, F. Siegerist, E. A. Black, Z. Yu, A. A. Mensah, D. E. Hagen, R. C. Miake-Lye, et al. 2015. Measurement of Aircraft Engine Non-volatile PM Emissions: Results of the Aviation-Particle Regulatory Instrumentation Demonstration Experiment (A-PRIDE) 4 Campaign. Aerosol Sci. Technol. 49 (7):472–84. doi:10.1080/02786826.2015.1047012.
- Lu, T., Z. Huang, C. S. Cheung, and J. Ma. 2012. Size Distribution of EC, OC and Particle-Phase PAHs Emissions from a Diesel Engine Fueled with Three Fuels. Sci. Total Environ. 438:33–41. doi:10.1016/j.scitotenv.2012.08.026.
- Mamakos, A., I. Khalek, R. Giannelli, and M. Spears. 2013. Characterization of Combustion Aerosol Produced by a Mini-CAST and Treated in a Catalytic Stripper. Aerosol Sci. Technol. 47 (8):927–936. doi:10.1080/02786826.2013.802762.
- Maricq, M. M. 2004. Size and Charge of Soot Particles in Rich Premixed Ethylene Flames. Combust. Flame 137 (3):340–50. doi:10.1016/j.combustflame.2004.01.013.
- Maricq, M. M. 2014. Examining the Relationship Between Black Carbon and Soot in Flames and Engine Exhaust. Aerosol Sci. Technol. 48 (6):620–29. doi:10.1080/02786826.2014.904961.
- McMurry, P. H. 2000. A Review of Atmospheric Aerosol Measurements. Atmos. Environ. 34 (12–14):1959–99. doi:10.1016/S1352-2310(99)00455-0.
- Melton, L. A. 1984. Soot Diagnostics Based on Laser Heating. Appl. Opt 23 (13):2201–8. doi:10.1364/AO.23.002201.
- Michelsen, H. A., C. Schulz, G. J. Smallwood, and S. Will. 2015. Laser-Induced Incandescence: Particulate Diagnostics for Combustion, Atmospheric, and Industrial Applications. Prog. Energy Combust. Sci. 51:2–48. doi:10.1016/j.pecs.2015.07.001.
- Moore, R. H., L. D. Ziemba, D. Dutcher, A. J. Beyersdorf, K. Chan, S. Crumeyrolle, T. M. Raymond, K. L. Thornhill, E. L. Winstead, and B. E. Anderson. 2014. Mapping the Operation of the Miniature Combustion Aerosol Standard (mini-CAST) Soot Generator. Aerosol. Sci. Technol. 48 (5):467–79. doi:10.1080/02786826.2014.890694.
- Penner, J. E., M. O. Andreae, H. Annegarn, L. Barrie, J. Feichter, D. Hegg, A. Jayaraman, R. Leaitch, D. Murphy, J. Nganga, et al. 2001. Aerosols, Their Direct Indirect Effect. In IPCC Third Assessment Report: Climate Change 2001: The Scientific Basis. Contribution of Working Group I to the Third Assessment Report of the Intergovernmental Panel on Climate Change, ed. J. T. Houghton, Y. Ding, D. J. Griggs, M. Noguer, P. J. van der Linden, X. Dai, K. Maskell, and C.A. Johnson. Cambridge and New York: Cambridge University Press.
- Petzold, A., J. A. Ogren, M. Fiebig, P. Laj, S.-M. Li, U. Baltensperger, T. Holzer-Popp, S. Kinne, G. Pappalardo, N. Sugimoto, et al. 2013. Recommendations for Reporting “Black Carbon” Measurements. Atmos. Chem. Phys. 13 (16):8365–79. doi:10.5194/acp-13-8365-2013.
- Petzold, A., and M. Schönlinner. 2004. Multi-Angle Absorption Photometry - A New Method for the Measurement of Aerosol Light Absorption and Atmospheric Black Carbon. J. Aerosol Sci. 35 (4):421–41. doi:10.1016/j.jaerosci.2003.09.005.
- Popovitcheva, O. B., N. M. Persiantseva, M. E. Trukhin, G. B. Rulev, N. K. Shonija, Y. Ya. Buriko, A. M. Starik, B. Demirdjian, D. Ferry, and J. Suzanne. 2000. Experimental Characterization of Aircraft Combustor Soot: Microstructure, Surface Area, Porosity and Water Adsorption. Phys. Chem. Chem. Phys. 2 (19):4421–26. doi:10.1039/b004345l.
- Pöschl, U. 2005. Atmospheric Aerosols: Composition, Transformation, Climate and Health Effects. Angew. Chemie – Int. Ed. 44 (46):7520–40. doi:10.1002/anie.200501122.
- Puzun, A., S. Wanchen, L. Guoliang, T. Manzhi, L. Chunjie, and C. Shibao. 2011. Characteristics of Particle Size Distributions About Emissions in a Common-Rail Diesel Engine with Biodiesel Blends. Procedia Environ. Sci. 11 (C):1371–8. doi:10.1016/j.proenv.2011.12.206.
- Ramanathan, V., G. Carmichael, V. Ramanathan, G. Carmichael, V. Ramanathan, and G. Carmichael. 2008. Global and Regional Climate Changes Due to Black Carbon. Nature Geosci. 1 (4):221–7. doi:10.1038/ngeo156.
- Saffaripour, M., L. L. Tay, K. A. Thomson, G. J. Smallwood, B. T. Brem, L. Durdina, and M. Johnson. 2017. Raman Spectroscopy and TEM Characterization of Solid Particulate Matter Emitted from Soot Generators and Aircraft Turbine Engines. Aerosol Sci. Technol. 51 (4):518–531. Taylor & Francis: doi:10.1080/02786826.2016.1274368.
- Schnaiter, M., M. Gimmler, I. Llamas, C. Linke, C. Jäger, and H. Mutschke. 2006. Strong Spectral Dependence of Light Absorption by Organic Carbon Particles formed by Propane Combustion. Atmos. Chem. Phys. 6 (10):2981–90. doi:10.5194/acp-6-2981-2006.
- Schnaiter, M., H. Horvath, O. Möhler, K. H. Naumann, H. Saathoff, and O. W. Schöck. 2003. UV-VIS-NIR Spectral Optical Properties of Soot and Soot-Containing Aerosols. J. Aerosol Sci. 34 (10):1421–44. doi:10.1016/S0021-8502(03)00361-6.
- Slowik, J. G., K. Stainken, P. Davidovits, L. R. Williams, J. T. Jayne, C. E. Kolb, D. R. Worsnop, Y. Rudich, P. F. DeCarlo, and J. L. Jimenez. 2004. Particle Morphology and Density Characterization by Combined Mobility and Aerodynamic Diameter Measurements. Part 2: Application to Combustion-Generated Soot Aerosols as a Function of Fuel Equivalence Ratio. Aerosol Sci. Technol. 38 (12):1206–22. doi:10.1080/027868290903916.
- Stipe, C. B., B. S. Higgins, D. Lucas, C. P. Koshland, and R. F. Sawyer. 2005. Inverted Co-flow Diffusion Flame for Producing Soot. Rev. Sci. Instrum. 76 (2):23908. doi:10.1063/1.1851492.
- Sydbom, A., A. Blomberg, S. Parnia, N. Stenfors, T. Sandström, and S. E. Dahlén. 2001. Health Effects of Diesel Exhaust Emissions. Eur. Respir. J. 17 (4):733–46. doi:10.1183/09031936.01.17407330.
- Taylor, P., A. Y. Watson, and P. A. Valberg. 2001. Carbon Black and Soot: Two Different Substances. Am. Ind. Hyg. Assoc. 62 (2):218–28. doi:10.1080/15298660108984625.
- Török, S., V. B. Malmborg, J. Simonsson, A. Eriksson, J. Martinsson, M. Mannazhi, J. Pagels, and P.-E. Bengtsson. 2018. Investigation of the Absorption Ångström Exponent and Its Relation to Physicochemical Properties for Mini-CAST Soot. Aerosol Sci. Technol. 52 (7):757–67. doi:10.1080/02786826.2018.1457767.
- Tuch, T.,. K. Weinhold, M. Merkel, A. Nowak, T. Klein, P. Quincey, M. Stolzenburg, and A. Wiedensohler. 2016. Dependence of CPC Cut-Off Diameter on Particle Morphology and Other Factors. Aerosol Sci. Technol. 50 (4):331–8. doi:10.1080/02786826.2016.1152351.
- Vander Wal, R. L., and A. J. Tomasek. 2004. Soot Nanostructure: Dependence upon Synthesis Conditions. Combust. Flame 136 (1–2):129–140. doi:10.1016/j.combustflame.2003.09.008.
- Vander Wal, R. L., and K. J. Weiland. 1994. Laser-Induced Incandescence: Development and Characterization Towards a Measurement of Soot-Volume Fraction. Appl. Phys. B 59 (4):445–52. doi:10.1007/BF01081067.
- Virkkula, A., N. C. Ahlquist, D. S. Covert, P. J. Sheridan, W. P. Arnott, and J. A. Ogren. 2005. A Three-Wavelength Optical Extinction Cell for Measuring Aerosol Light Extinction and Its Application to Determining Light Absorption Coefficient. Aerosol. Sci. Technol. 39 (1):52–67. doi:10.1080/027868290901918.