
 ?Mathematical formulae have been encoded as MathML and are displayed in this HTML version using MathJax in order to improve their display. Uncheck the box to turn MathJax off. This feature requires Javascript. Click on a formula to zoom.
Abstract
While there are several computational studies on differential mobility analyzers (DMA), there is none for high flow DMA to classify nanoparticles less than 3 nm. A specific design of a high flow DMA, a half mini DMA, is investigated to predict its performance through numerical modeling in the incompressible flow regime. The governing equations for flow field, electric field and aerosol transport are solved using COMSOL 5.3. The transfer function of the half mini DMA is compared with that of a nano DMA (TSI 3085). The results show that both the height of the transfer function and resolution (R) of the half mini DMA are much better than those of nano DMA in sub-2 nm particle size range. Finally, the transfer function of half mini DMA is evaluated for different values of aerosol flow rate to the sheath flow rate (q/Q). Comparison of the simulated transfer function with existing models from Knutson–Whitby and Stolzenburg is also elucidated. It is found that the former model overestimates the resolution; whereas the latter is close to the simulation results for q/Q above 0.067. This work provides a useful method to study the flow regimes and transfer function of a high flow DMA.
Copyright © 2018 American Association for Aerosol Research
EDITOR:
1. Introduction
Differential mobility analyzers (DMA) have been extensively used to measure and classify particles over a wide range of sizes, from micrometers down to nanometers (Knutson and Whitby Citation1975; Zhang and Chen Citation2014). Since the introduction of DMAs, several studies have employed them to understand the airborne particle size distribution and environmental pollutants (Biswas and Wu Citation2005). On the other hand, DMAs serve as a unique technique to synthesize particles with a strict control of size (Jiang, Chen, and Biswas Citation2007) using different aerosol reactors (Stark and Pratsinis Citation2002; Li et al. Citation2016). Several researchers have also used tandem DMAs to understand the collisional growth and charge distribution of particles in the atmosphere (Kulmala et al. Citation2004), as well as several aerosol reactors (Kim et al. Citation2005; Sahu, Park, and Biswas Citation2012; Nie, Wang, and Biswas Citation2017; Sharma et al. Citation2018).
There is a growing interest to extend the lower limit of DMAs to measure nanoparticles made of a cluster of few molecules. To achieve this, different types of DMAs have been developed, namely Caltech radial DMA (RDMA), nanoRDMA, the Grimm nanoDMA and the Karlsruhe-Vienna DMA (Jiang et al. Citation2011). These high resolution DMAs have been used for the measurement of sub-2 nm particles in a variety of applications, such as atmospheric nucleation of aerosols (Kulmala et al. Citation2004), determination of gas phase protein densities (Maißer et al. Citation2011), understanding the early stages of particle formation and growth in aerosol reactors (Wang et al. Citation2014, Citation2015, Citation2017), quantifying sub-2 nm filtration efficiency of fibrous filters (Chen et al. Citation2016; Kim, Kang, and Pui Citation2016).
However, for sub-2 nm particles, the DMA transfer function is broadened due to high diffusivity of these particles (Zhang and Chen Citation2014). High flow DMAs, like the half mini DMA, attempt to solve this problem by decreasing the residence time considerably in the working section of the DMA. A short residence time implies that a high voltage is required to classify these particles, thereby, increasing the resolving power (R) (de la Mora and Kozlowski Citation2013; de la Mora Citation2017). It is important to note that residence time is but one factor in determining R. Stolzenburg (Citation1988) and, later, Flagan (Citation1999), showed that the Peclet number for migration can be reduced to neV/kT. The sheath flow in the half mini DMA, is therefore much higher than that of other typical DMAs (Knutson and Whitby Citation1975; Hummes et al. Citation1996; Cai et al. Citation2017). As a result, the flow can reach sonic conditions in the working section. Moreover, the length of the working section of half mini DMA is reduced significantly as compared to the TSI-short (Hummes et al. Citation1996) or nano DMA (Chen et al. Citation1998). These two improvements decrease the residence time of small particles traversing through the DMA, which greatly inhibit the diffusion loss to achieve a better resolution and stronger voltage signal for sub-2 nm particles (Wang et al. Citation2014). Hence, it is of great significance to investigate its performance, such as the flow behavior of both sheath gas and aerosol, the electrostatic field, and most importantly, the transfer function. Few studies (Attoui et al. Citation2013; Kangasluoma et al. Citation2016; Cai et al. Citation2018) have analyzed the DMA transfer function through experiments using a tandem configuration, where the first DMA was used to classify and obtain monodisperse aerosols under a constant voltage, and the second DMA was used in scanning mode to obtain the size distribution of the classified aerosols to determine the resolution. At the same time, the numerical approach provides a convenient way to predict the performance of the half mini DMA, as well as to optimize the DMA design.
Chen and Pui (Citation1997) developed a comprehensive model to predict the performance of the DMA for nanoparticle measurements. In this model, the flow field is described by Navier Stokes equations assuming axisymmetric geometry and steady state, and Laplace’s equation is used to describe the electric potential. The aerosol flow is regarded as the continuous phase to obey the convective diffusion formulation. This model was used to get the optimized design for nano DMA. Hagwood (Citation1999) proposed a Monte-Carlo based methodology for particle Brownian motion for parabolic and plug flow in a DMA. Deye et al. (Citation1999) used a commercial computational fluid dynamics (CFD) software FLUENT to model the two-dimensional axisymmetric computational domain coupled with a particle trajectories routine in a DMA. Song et al. (Citation2006) solved the Langevin equation for particle motion and used a commercial CFD solver to obtain the flow and electric field to study the performance of the long DMA. Mamakos, Ntziachristoset, and Samaras (Citation2007) numerically solved the convective diffusion equation of particles based on the given flow and electric field, to evaluate the Knutson–Whitby triangular transfer function and the Stolzenburg diffusive transfer function in long and nano DMAs. Martínez-Lozano and Labowsky (Citation2009) solved the same equations from Chen and Pui (Citation1997) by a commercial software COMSOL to verify performance of their isopotential nano DMA. All these studies are focused on the understanding of the transfer function for relatively low flow rates in the working section. To the best of our knowledge, no effort has been made to numerically predict the performance of high flow DMAs like a half mini DMA. As the flow could reach the sonic conditions in the working section of these high flow DMAs (de la Mora and Kozlowski Citation2013), previous numerical models cannot be applied directly, as all the models are based on incompressible flow assumption. The diffusion coefficient and the drag force coefficient are typically estimated for incompressible flow conditions (Friedlander Citation2000). Further, it is also meaningful to understand the flow regime in the working section for experimental operations or structure optimization.
In this article, first, a scaling law analysis is performed to determine the flow regime in the working section of a design of a high flow DMA, the half mini DMA. Details of the numerical model are then described. The transfer function of the half mini DMA is compared with that of a conventional nano DMA (TSI 3085). The performance of both the DMAs are evaluated under different flow rate ratios.
2. Model development
The configuration of a 4/2 type (short bullet) half mini DMA is described in detail. The half mini DMA is operated in a wide range of sheath flow rates ranging from 25 lpm (Cai et al. Citation2018) to over 700 lpm (de la Mora and Kozlowski Citation2013). Therefore, it is imperative to establish the flow regime as the details of the numerical model will accordingly have to be established. In this article, the half mini DMA is modeled for the incompressible flow regime. Several researchers (Fang et al. Citation2014; Wang et al. Citation2014, Citation2015, Citation2017; Carbone et al. Citation2016; Cai et al. Citation2018) have operated the half mini DMA with moderately high sheath flow rates (≤ 250 lpm). Moreover, with the new design of half mini DMA (de la Mora Citation2017), resolution as high as 25 is obtained for sheath flow rates of ∼150 lpm. This further motivates us to model the half mini DMA in the incompressible flow regime.
2.1. Configuration of half mini DMA
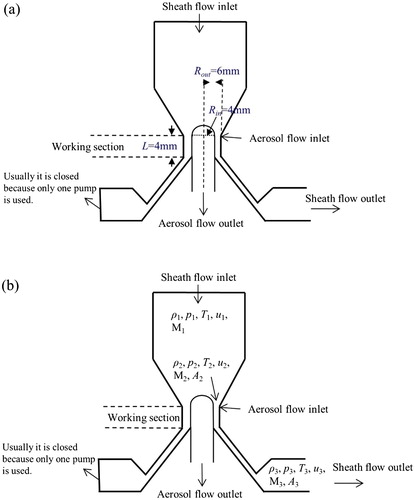
shows the schematic of the 4/2 type (short bullet) half mini DMA. The length of the working section L is 4 mm, and the difference between the outer radius (Rout = 6 mm) and inner radius (Rin = 4 mm) of the DMA is 2 mm. The width of the aerosol inlet silt is 0.254 mm (0.01") (de la Mora Citation2017). The upstream laminar sheath flow mixes with the annular injection of aerosol flow before it comes into the working section. Different voltages can be applied to the inner cylindrical electrode to let the particles with the corresponding mobility exit through the aerosol outlet slit, while the sheath flow exits through the working section and then to the diffuser.
Figure 1. Schematic of the half mini DMA (a) main geometry (b) notations for sheath flow parameters.
2.2. Flow regime calculation
A scaling law analysis is used to distinguish the sheath flow regime in the working section. Since clean air is used as the sheath gas, it is assumed that it is an ideal gas, and the flow is isentropic from the entrance to the exit (Biswas and Flagan Citation1984; de la Mora and Kozlowski Citation2013). The parameters of sheath gas are shown in , where ρ, p, T, u, M and A are, respectively, gas density, pressure, temperature, velocity, Mach number and cross-section area. The subscript 1, 2 and 3 denote the positions at the sheath flow inlet, the working section and the sheath flow outlet, respectively.
For the sheath gas in the working section (cross-section 2) and the exit (cross-section 3), the mass continuity equation can be described by EquationEquation (1)(1)
(1) ,
(1)
(1)
As the assumption that the sheath flow is isentropic (Biswas and Flagan Citation1984), the relation between u2 and u3 or ρ2 and ρ3 can be given as follows
(2)
(2)
(3)
(3)
where, γ is the adiabatic index of the sheath gas. EquationEquations (2)
(2)
(2) and Equation(3)
(3)
(3) are solved to obtain the Mach number at any cross-section, which determines the flow compressibility of the sheath gas with different flow rates. Combining EquationEquations (1–3), we get
(4)
(4)
Here, T3 is assumed to be the atmospheric temperature (293 K), and lists all the known variables. Therefore, M2 is calculated as a function of the sheath flow rate Q3 (Q3 = Q).
Table 1. Different variables used to understand the flow regime in the working section.
2.3. Numerical model
The sheath flow is described by the constant-density (or incompressible) Navier Stokes equations which are included in the online supplementary information (SI). In order to decrease the computational time without reducing the numerical accuracy, a two-dimensional axisymmetric geometry is selected (Chen and Pui Citation1997; Martínez-Lozano and Labowsky Citation2009). For boundary conditions of the flow fields, both the inlet and outlet aerosol flow rates are set equal to q. At the aerosol inlet, the initial velocity profile is set as the mean speed corresponding the aerosol flow rate (q) over the area of the inlet surface. The orientation of the jet for the aerosol flow is normal to the inlet surface. The flow rate at the aerosol outlet and the sheath outlet is set to be q and Q, respectively. For the sheath flow inlet, the gauge pressure is set to be zero as the boundary condition. The effect of gauge pressure and the inlet length of the trumpet on the flow field discussed in detail in the SI.
When solving for the electric field, the electric potential φ is obtained by solving the Laplace’s equation as given below:
(5)
(5)
The electric intensity E vector is given as
(6)
(6)
For the boundary conditions for Equation (5), the inner electrode is assigned a negative voltage, and the outer surface is grounded.
The aerosol particles are assumed to be in continuous phase in the DMAs. This implies that they are a component of the fluid phase, and not in the transition or free molecular regime. The convective diffusion equation used to describe the number concentration (N) of the particles is given as
(7)
(7)
where, Zp and D are the particle electric mobility and the particle diffusion coefficient, respectively, which are calculated as
(8)
(8)
(9)
(9)
where, Cslip is the slip correction factor provided in Friedlander (Citation2000), n is the number of elementary charges on the particle, e is the elementary charge, μ is the dynamic viscosity of sheath gas, dp is the particle mobility diameter, k is the Boltzmann constant, and T is the sheath flow temperature assumed to be 293 K here. The boundary conditions for the aerosol number concentration, N, is set to zero at the wall. N is assumed to be uniformly distributed at the aerosol inlet, and the gradient of N is assumed to be zero at the aerosol outlet, the inlet and outlet of the sheath flow. The Navier Stokes equations and EquationEquations (5–9) are solved using the commercial CFD software COMSOL 5.3. The simulation zone is discretized using a free triangular mesh with a finer mesh for the zone between the inlet and outlet of the DMA. A sensitivity analysis of mesh size is performed first, and the reader is referred to the SI for details on refined mesh, optimal mesh size, and numerical diffusion considerations.
3. Results and discussion
This section describes the sheath flow rates for compressible and incompressible flow regimes, followed by the discussion of the results from the numerical model. First, the flow, electric, and particle concentration fields are examined. Then, the transfer function and performance of the half mini DMA is compared with the nano DMA.
3.1. Flow regime and Mach number
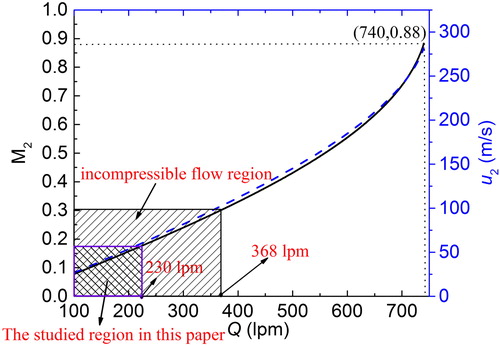
shows the change in Mach number (M2) and gas velocity (u2) in the working section as a function of the sheath flow rate (Q). Owing to the translation of random thermal energy () into directed kinetic energy (
) as the gas is accelerated to high velocity by a large pressure drop, the temperature (T) and density (ρ) change while the mass is conserved. As a result, Mach number and velocity do not vary in the same way, and the curves deviate from one another. The incompressible flow is defined as the regime where resulting density and temperature change are sufficiently small that they can be neglected. The consideration of temperature is important here, because it determines the speed of sound, which is the normalizing factor used in calculating the Mach number (M). also points out for the incompressible flow regime, i.e. M < 0.3, Q should be less than 368 lpm. The highest flow rate simulated in this work is 230 lpm, thus validating the incompressible flow regime assumption. This value of sheath flow rate used is consistent with several experimental studies (Fang et al. Citation2014; Wang et al. Citation2014, Citation2015, Citation2017; Carbone et al. Citation2016; Cai et al. Citation2018). On the other hand, there are several studies where the maximum reported value of Q (Qmax_rep) is about 740 lpm (de la Mora Citation2011); thus requiring compressible flow simulations. This is the subject of a following paper to be done by the authors.
Figure 2. Flow regime in the working section. Black-solid line: Mach number vs. flow rate; Blue-dashed line: velocity vs. flow rate.
3.2. Flow, electric and concentration fields
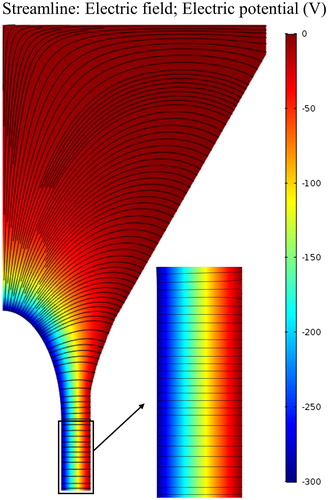
shows the sheath flow field within the lower part of trumpet and the whole cylindrical region for q = 9 lpm and Q = 136 lpm (Wang et al. Citation2014). The aerosol inlet and outlet sections are enlarged to show the velocity magnitude and streamline. illustrates the axial velocity profiles at different locations. shows that the axial velocity profile of the main flow (Q = 136 lpm) within the working section of the DMA is flat, with two boundary layers at the inner and outer electrode. As q increases, the boundary layer thickness increases towards the outer wall, and decreases slightly towards the inner wall. This is due to the larger radial inertia of the entering aerosol jet, which pushes the main sheath flow towards the inner electrode. shows the contour of electric potential and streamline of electric field with a ˗300 V applied voltage. The electric field is found to be uniform in the working section.
Figure 3. The flow fields of half mini DMA (a) velocity magnitude field below the trumpet, and streamlines shown near the aerosol inlet and outlet slit (q = 9 lpm, Q = 136 lpm) (b) different locations in the working section (c) the axial velocity profile at different z as increasing q (Q = 136 lpm).
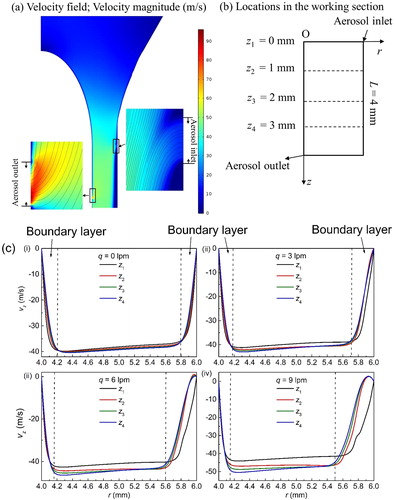
Figure 4. Electric field with the applied voltage (˗300V) on the inner electrode.
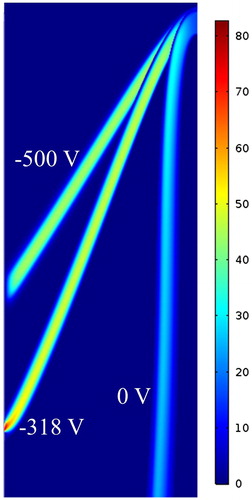
illustrates the convective flux for the aerosol as a function of increasing applied voltage. Increasing the voltage directs the flow direction of charged particles towards the inner electrode.
Figure 5. Convective flux (mol·m−2·s−1) fields of aerosol with increasing magnitude of the inner electrode voltage in working section (dp = 1.4 nm, q = 9 lpm, Q = 136 lpm).
3.3. Transfer function of half mini DMA compared with nano DMA
The transfer function (Ω) is the key parameter to determine the DMA performance. Ω is defined as the ratio of inlet to outlet aerosol convective flux as
(10)
(10)
where,
and
are the particle flow velocity and surface element (Chen and Pui Citation1997). It is important to note that the calculated Ω considers only the working section of both the half mini and nano DMA (Knutson and Whitby Citation1975; Chen and Pui Citation1997; Martínez-Lozano and Labowsky Citation2009).
A dimensionless mobility of the classified particles (Z˜) is defined as the ratio of the particle mobility (Z) to the centroid electrical mobility () of the transfer function
(11)
(11)
The centroid electrical mobility () is given by
(12)
(12)
In EquationEquation (12)(12)
(12) ,
is the voltage where Ω reaches its maximum value. Hence, the DMA resolution (R) is defined as
(13)
(13)
where,
is the full width of the transfer function at 50% of its maximum value (Flagan Citation1999).
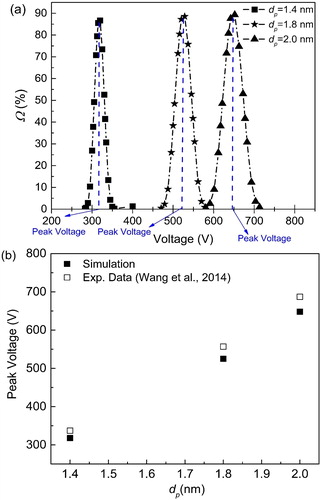
Here, our simulation conditions for the flow rates (q = 9 lpm and Q = 136 lpm) and the particle mobility sizes are assumed to be same as the experimental case 1 and 3 by Wang et al. (Citation2014). The particles are assumed to carry a single elementary charge. shows the transfer function with increasing applied voltage to classify particles of different dp. It can be observed that the larger particles need a larger applied voltage for classification. The transfer functions are triangular in shape with the appearance of tails on both sides, and rounding of the top, due to the high diffusion coefficient of sub-2 nm particles. In , the simulation peak voltages, at which the transfer function is maximum for each particle diameter, are compared with the experimental data (Wang et al. Citation2014). The changing trend of the simulation and experimental data agrees well, and the relative errors between the simulation and the experimental voltages are below 5.7%. Two mechanisms may explain this difference. First, the direction of the aerosol flow through its inlet slit may not be perfectly axisymmetric in the experiments, but our model assumes the aerosol flow to be symmetric in two-dimensional computational domain. Second, the flow rate in experiment was not measured directly, but was calculated based on the mobility values of monodisperse organic ions (Ude and de la Mora Citation2005). The difference of the gas properties used in the experiment and simulation may also contribute to this small deviation.
Figure 6. (a) Transfer function vs. voltage for two different values of dp. (b) Comparison between the simulated and experimental peak voltages for different particle diameters.
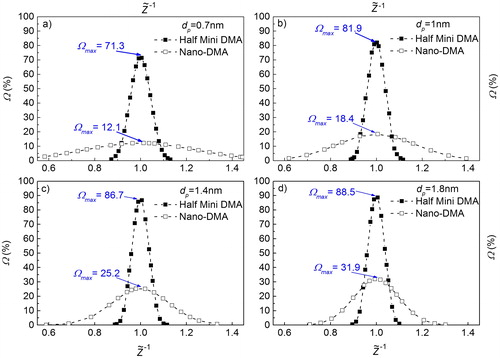
Fang et al. (Citation2014) observed that the half mini DMA can detect particles whose mobility diameter is as low as 0.7 nm. In order to further evaluate the classifying performance of half mini DMA for such small particles, Ω is calculated for dp ranging from 0.7 to 1.8 nm, and compared with the results from the numerical model for nano DMA (Biswas et al. Citation2018), as shown in . The flow rates of nano DMA are q = 1 lpm and Q = 15 lpm, to let the ratio of q to Q equal for both the DMAs. As can be seen from , the peak value (height) of the transfer function for half mini DMA, Ωmax, increases from 71.3% to 88.5% as dp increases. However, the maximum value of Ωmax is 31.9% for nano DMA, even for particle size of 1.8 nm in . Ωmax of the half mini DMA is 71.3% for 0.7 nm particles, which means that over 70% of the inlet particles can be collected through the aerosol outlet by applying a corresponding peak voltage. In contrast, only 12.1% of the inlet particles can exit through the aerosol outlet of a commercial nano DMA. The reason that the half mini DMA has much lower diffusion broadening than nano DMA is attributed to significant reduction in the particle residence time in the working section of the half mini DMA. This is achieved significantly by shortening the length of the working section, and enhancing the sheath flow rate dramatically.
Figure 7. Comparison of transfer function (Ω) between half mini DMA and nano DMA for sub-2 nm particles. Ω only counts the particle transmission in the DMA work section.
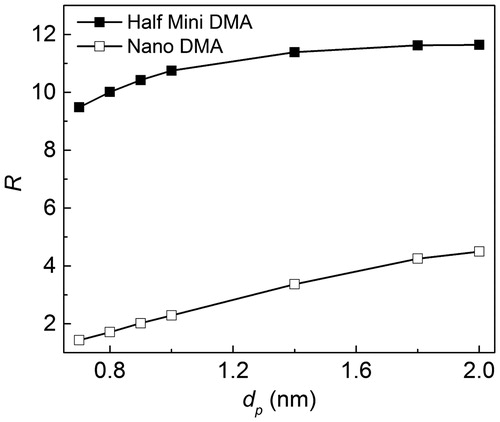
shows resolution (R) for sub-2 nm particles for both the half mini and nano DMA. It is found that, for dp = 1.4 nm, the simulated R of half mini DMA equals 11.4, which is close to the experimental value of 10 (Wang et al. Citation2014). For the half mini DMA, R goes up gradually from dp = 0.7 nm to 2 nm. On the other hand, R for a nano DMA increases with dp linearly. For the dp range from 0.7 to 2.0 nm. The value of R of the half mini DMA is greater than 9.4, while R of the nano DMA varies from 1.4 to 4.5, which clearly shows that the resolution is much better for the classification of sub-2 nm particles.
Figure 8. The comparison of resolution (R) of half mini DMA and nano DMA under different particle mobility sizes (q/Q = 9/136).
It should be noted that the recent experimental work (Cai et al. Citation2018) shows the transmission of sub-2 nm particles of half mini DMA are much lower than those calculated by our simulations, indicating that the particle loss in other sections of the DMA play an important role. In this study, the transmission efficiency of sub-2 nm particles for both the half mini DMA and nano DMA were constrained to the working sections only. This is due to the lack of detailed information of the inlet and outlet configuration, and the corresponding dimensions; and more importantly, the computational burden caused by adding an asymmetrical aerosol inlet to the simulated geometry. Therefore, in our numerical model, the particle loss in the inlet annular chamber and the outlet aerosol tube is not considered.
Further, because of the axisymmetric geometry of our model in this article, the influence of non-uniform aerosol inlet flow on the half mini DMA transfer function was not evaluated. Attention should be paid here that a non-uniform distribution of the aerosol inlet flow would result in a local change of voltage-mobility relationship, where the classified particles become less monodisperse, reducing the DMA resolution. The non-uniform distribution is important for previous versions of the half mini DMA, which is greatly improved in the newer models by using a circular ring at the aerosol inlet (de la Mora Citation2017).
3.4. Performance under different flow rate ratios (q/Q)
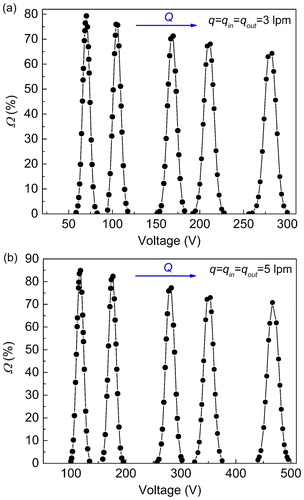
To evaluate the performance of half mini DMA under different flow rates, the ratio of q to Q is varied. The particle mobility size is fixed at 1.4 nm and q is chosen to be 3 lpm and 5 lpm. shows the transfer function versus DMA voltage for increasing Q. It is found that as V increases, the maximum value of transfer function decreases. This verifies numerically the changing trend of the experimental data reported in by de la Mora and Kozlowski (Citation2013).
Figure 9. Transfer function vs. voltage for half mini DMA (a) q = 3 lpm (b) q = 5 lpm.
compares the simulated transfer function to the theoretical transfer function by Knutson and Whitby (Citation1975) and Stolzenburg (Stolzenburg Citation1988; Stolzenburg and McMurry Citation2008). shows that the peak values for Ω are 100% for all the Knutson–Whitby transfer functions which are triangular in shape, and do not consider the effect of diffusion. The width of each triangle shrinks with decreasing q/Q. The simulated resolutions in are 7.3 and 18.4, which are both smaller than 10 and 40, as predicted by Knuston–Whitby for q/Q = 1/10 and 1/40, respectively. It is important to note that even though the resolution for the case with q/Q = 1/40 is greater than that with q/Q = 1/10; the overall height of the transfer function is lower. The decrease in the height of the transfer function is attributed to the tail occupying an additional area. In order to keep the total area under the curve constant, the peak height decreases to compensate for this increase in area. Now, for a high sheath flow rate, and q/Q = 1/40, the width of the triangular transfer function is smaller as compared to that for q/Q = 1/10. Therefore, the appearance of the tail will lead to larger drop in the overall height to keep the overall area constant.
Figure 10. The simulation (half mini DMA) and theoretical transfer function for different q/Q (q = 3 lpm) at dp = 1.4 nm under (a) the non-diffusion theory (Knutson and Whitby Citation1975) (b) the diffusion theory (Stolzenburg Citation1988; Stolzenburg and McMurry Citation2008).
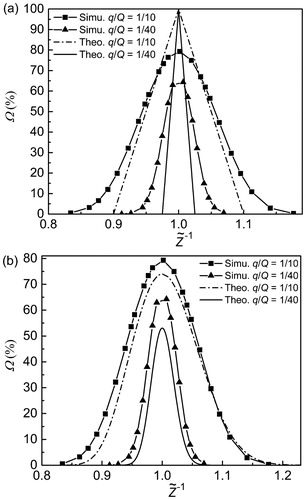
compares the simulated transfer function to the Stolzenburg diffusive transfer function. The height of the Stolzenburg transfer function decreases as q/Q is reduced, which is consistent with our modeling results. Ωmax for Stolzenburg transfer function is as high as 70% and 50% at q/Q = 1/10 and 1/40, respectively, however, the simulation results show the maximum value of 80% and 65% with higher width of the transfer function. This shows that our modeling results predict higher particle transmission ability of the working section of the half mini DMA than the theoretical prediction by Stolzenburg (Citation1988).
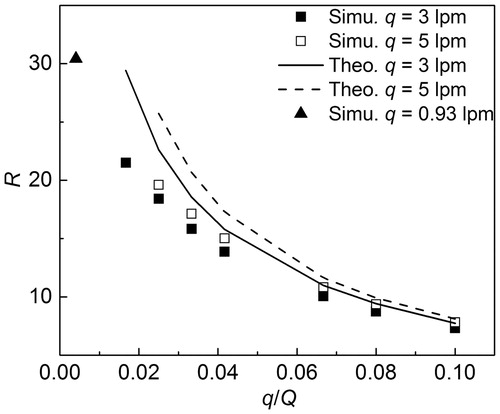
compares the simulated and theoretical values by Stolzenburg (Citation1988) for resolution (R) at different q/Q. R is 7.3 and 7.8 for q = 3 and 5 lpm, respectively, at q/Q = 0.1, while R increases to 18.4 and 19.6 for q = 3 and 5 lpm, respectively, at q/Q = 0.025. The theoretical R closely follows the trend with the simulated R. Particularly, for higher values of q/Q, the simulated R agrees very well with the theoretical values. A possible reason for this slight deviation at high Q could be that there still exists small intrinsic numerical diffusion issues with the computational code. Besides, some assumptions of the theoretical derivation of the diffusion transfer function, such as the neglecting of diffusion in the streamwise direction, and the neglecting of cross-stream shear (Stolzenburg and McMurry Citation2008), could cause higher prediction of R than that obtained by models. The largest Q that could be obtained by the convergent solution of COMSOL here is 230 lpm. It was found that the simulated R for q/Q = 0.93/230 is 30.4, whereas it is found to be larger than 50 for the same q/Q but Q ∼ 740 lpm (de la Mora and Kozlowski Citation2013; de la Mora and Barrios-Collado Citation2017). This mismatch may be due to the compressible flow at Q ∼ 740 lpm, as compared to our simulations which are performed in the incompressible flow regime. To further this understanding, future work will be focused on modeling the compressible sheath flow in high flow DMAs.
Figure 11. The simulation and theoretical resolution of half mini DMA for different q/Q at dp = 1.4 nm. Note that the simulation point denoted by triangular corresponding to q = 0.93 lpm and Q = 230 lpm.
4. Conclusions
A numerical model is developed to predict the performance of a high flow DMA, the half mini DMA (Rout = 6 mm, Rin = 4 mm, L = 4 mm) for the first time. A numerical model is developed to solve the flow field, electric field, coupled with the aerosol transport, and the equations are solved by COMSOL 5.3. The simulation is done in the incompressible flow regime for a sheath flow rate (Q) less than 368 lpm (corresponding to M = 0.3). The electric field is found to be uniform in the working section. Then, the transfer function of half mini DMA is evaluated, and the simulated peak voltages and resolution are found to be in good agreement with the experimental values. For particles in the sub-2 nm range, the height of the transfer function of the half mini DMA is over 5.8 times larger than that of a nano DMA at dp = 0.7 nm. Even for 1.8 nm particles, the ratio of these two heights is still more than 2.7 times for q/Q = 9/136. The resolution of both half mini DMA and nano DMA increases with increasing dp. But the resolution of half mini DMA is much better that that of nano DMA. For example, the magnitude of R is less than 2 at dp = 0.7 nm for a nano DMA, but R is over 9 for the same dp for the high flow half Mini DMA.
The transfer function of the half mini DMA is investigated under different q/Q. The height of the transfer function is found to decrease as the magnitude of Q increases at fixed q. The comparison of the simulated transfer function with the theoretical models by Knuston and Whitby (Citation1975) and Stolzenburg (Citation1988) shows that the height of the simulated transfer function Ω is higher than that obtained by Stolzenburg’s theoretical model where particle diffusion was considered. The simulated resolution of the half mini DMA closely follows the trend with the Stolzenburg’s theoretical model, but predicts slightly lower resolution for smaller values of q/Q. This deviation can be attributed to the intrinsic numerical diffusion of the particle transport computational codes, and some assumptions, such as neglecting of diffusion in the streamwise direction, and neglecting of cross-stream shear in Stolzenburg’s theoretical model.
Nomenclature
| A | = | area of the cross-section of DMA, m2 |
| Cp | = | specific heat capacity at constant pressure, J·kg−1·K−1 |
| Cslip | = | slip correction |
| e | = | elementary charge, C |
| E | = | electric field intensity, V/m |
| dp | = | particle mobility diameter, nm |
| ds | = | surface element, m2 |
| D | = | diffusion coefficient, m2/s |
| g | = | gravity acceleration, m/s2 |
| k | = | Boltzmann constant, m2·kg·s−2·K−1 |
| L | = | length of the working section of DMA, mm |
| M | = | Mach number of the sheath gas |
| n | = | number of elementary charges on the particle |
| N | = | particle concentration, #/m3 |
| p | = | pressure of the sheath gas, Pa |
| q | = | aerosol flow rate, lpm |
| qin | = | aerosol flow rate at inlet slit, lpm |
| qout | = | aerosol flow rate at outlet slit, lpm |
| Q | = | sheath flow rate, lpm |
| Qmax_report | = | maximum sheath flow rate of a pump reported in the literature, lpm |
| Rg | = | ideal gas constant, J/(kg·K) |
| Rin | = | radius of the inner cylinder of DMA, mm |
| Rout | = | radius of the outer cylinder of DMA, mm |
| R | = | DMA resolution |
| T | = | temperature of the sheath gas, K |
| T0 | = | upstream stagnation temperature of the sheath gas, K |
| u | = | velocity magnitude of the sheath gas, m/s |
| u | = | velocity of the sheath gas, m/s |
| v | = | velocity of the particles, m/s |
| V | = | DMA voltage on the inner electrode, V |
| V* | = | DMA voltage at Ωmax, V |
| Z | = | classified particle electrical mobility, cm2/(V·s) |
| Z˜ | = | non-dimensional classified particle electrical mobility |
| Z* | = | transfer function centroid electric mobility, cm2/(V·s) |
| Zp | = | particle electric mobility, cm2/(V·s) |
| γ | = | adiabatic index of the sheath gas |
| μ | = | dynamic viscosity of sheath gas, Pa·s |
| ρ | = | density of the sheath gas, kg/m3 |
| φ | = | electric potential, V |
| = | full width of the transfer function at 50% of its maximum value | |
| Ω | = | transfer function |
| Ωmax | = | height of transfer function (or the maximum value of Ω) |
Subscript
| 1 | = | sheath inlet |
| 2 | = | working section |
| 3 | = | sheath outlet |
Supplemental Material
Download MS Word (1.2 MB)Acknowledgments
Dr. Juan Fernández de la Mora is gratefully acknowledged for reviewing the manuscript and providing valuable comments.
Additional information
Funding
Related Research Data
References
- Attoui, M., M. Paragano, J. Cuevas, and J. F. de la Mora. 2013. Tandem DMA generation of strictly monomobile 1–3.5 nm particle standards. Aerosol Sci. Technol. 47(5):499–511. doi: 10.1080/02786826.2013.764966.
- Biswas, P., and C.-Y. Wu. 2005. Nanoparticles and the environment. J. Air Waste Manage. Assoc. 55:708–746. doi: 10.1080/10473289.2005.10464656.
- Biswas, P., and R. C. Flagan. 1984. High-velocity inertial impactors. Environ. Sci. Technol. 18:611–616. doi: 10.1021/es00126a009.
- Biswas, P., Y. Wang, and M. Attoui. 2018. Sub-2nm particle measurement in high-temperature aerosol reactors: A review. Curr. Opin. Chem. Eng. 21:60–66. doi: 10.1016/j.coche.2018.03.004.
- Cai, R., D.-R. Chen, J. Hao, and J. Jiang. 2017. A miniature cylindrical differential mobility analyzer for sub-3 nm particle sizing. J. Aerosol Sci. 106:111–119. doi: 10.1016/j.jaerosci.2017.01.004.
- Cai, R., M. Attoui, J. Jiang, F. Korhonen, J. Hao, T. Petäjä, and J. Kangasluoma. 2018. Characterization of a high-resolution supercritical differential mobility analyzer at reduced flow rates. Aerosol Sci. Technol. 52(11):1332–1343. doi: 10.1080/02786826.2018.1520964.
- Carbone, F., M. Attoui, and A. Gomez. 2016. Challenges of measuring nascent soot in flames as evidenced by high-resolution differential mobility analysis. Aerosol Sci. Technol. 50(7):740–757. doi: 10.1080/02786826.2016.1179715.
- Chen, D.-R., and D. Y. Pui. 1997. Numerical modeling of the performance of differential mobility analyzers for nanometer aerosol measurements. J. Aerosol Sci. 28(6):985–1004. doi: 10.1016/S0021-8502(97)00004-9.
- Chen, D.-R., D. Y. Pui, D. Hummes, H. Fissan, F. Quant, and G. Sem. 1998. Design and evaluation of a nanometer aerosol differential mobility analyzer (nano-DMA). J. Aerosol Sci. 29(5–6):497–509. doi: 10.1016/S0021-8502(97)10018-0.
- Chen, S., W. Liu, and S. Li. 2016. Effect of long-range electrostatic repulsion on pore clogging during microfiltration. Phys. Rev. E 94:063108. doi: 10.1103/PhysRevE.94.063108.
- de la Mora, J. F. 2011. Sub-3 nm aerosol measurement with DMAs and CNCs. In Aerosol measurement: Principles techniques, and applications, ed. P. Kulkarni, P. A. Baron, and K. Willeke, 697–722. 3rd ed. John Wiley & Sons, New York.
- de la Mora, J. F. 2017. Expanded flow rate range of high-resolution nanoDMAs via improved sample flow injection at the aerosol inlet slit. J. Aerosol Sci. 113:265–275. doi: 10.1016/j.jaerosci.2017.07.020.
- de la Mora, J. F., and C. Barrios-Collado. 2017. A bipolar electrospray source of singly charged salt clusters of precisely controlled composition. Aerosol Sci. Technol. 51:778–786. doi: 10.1080/02786826.2017.1302070.
- de la Mora, J. F., and J. Kozlowski. 2013. Hand-held differential mobility analyzers of high resolution for 1–30 nm particles: Design and fabrication considerations. J. Aerosol Sci. 57:45–53. doi: 10.1016/j.jaerosci.2012.10.009.
- Deye, G., P. Gao, P. Baron, and J. Fernback. 1999. Performance evaluation of a fiber length classifier. Aerosol Sci. Technol. 30:420–437. doi: 10.1080/027868299304471.
- Fang, J., Y. Wang, M. Attoui, T. S. Chadha, J. R. Ray, W.-N. Wang, Y.-S. Jun, and P. Biswas. 2014. Measurement of Sub-2 nm clusters of pristine and composite metal oxides during nanomaterial synthesis in flame aerosol reactors. Anal. Chem. 86(15):7523–7529. doi: 10.1021/ac5012816.
- Flagan, R. C. 1999. On differential mobility analyzer resolution. Aerosol Sci. Technol. 30:556–570. doi: 10.1080/027868299304417.
- Friedlander, S. K. 2000. Smoke, dust, and haze: Fundamentals of aerosol dynamics. Topics in chemical engineering. New York: Oxford University Press.
- Hagwood, C. 1999. The DMA transfer function with Brownian motion a trajectory/Monte-Carlo approach. Aerosol Sci. Technol. 30:40–61. doi: 10.1080/027868299304877.
- Hummes, D., S. Neumann, H. Fissan, and F. Stratmann. 1996. Experimental determination of the transfer function of a differential mobility analyzer (DMA) in the nanometer size range. Part. Part. Syst. Char. 13:327–332. doi: 10.1002/ppsc.19960130513.
- Jiang, J., D.-R. Chen, and P. Biswas. 2007. Synthesis of nanoparticles in a flame aerosol reactor with independent and strict control of their size, crystal phase and morphology. Nanotechnology 18(28):285603. doi: 10.1088/0957-4484/18/28/285603.
- Jiang, J., M. Attoui, M. Heim, N. A. Brunelli, P. H. McMurry, G. Kasper, R. C. Flagan, K. Giapis, and G. Mouret. 2011. Transfer functions and penetrations of five differential mobility analyzers for sub-2 nm particle classification. Aerosol Sci. Technol. 45(4):480–492. doi: 10.1080/02786826.2010.546819.
- Kangasluoma, J., M. Attoui, F. Korhonen, L. Ahonen, E. Siivola, and T. Petäjä. 2016. Characterization of a herrmann-type high-resolution differential mobility analyzer. Aerosol Sci. Technol. 50(3):222–229. doi: 10.1080/02786826.2016.1142065.
- Kim, C., S. Kang, and D. Y. Pui. 2016. Removal of airborne Sub-3 nm particles using fibrous filters and granular activated carbons. Carbon 104:125–132. doi: 10.1016/j.carbon.2016.03.060.
- Kim, S., K. Woo, B. Liu, and M. Zachariah. 2005. Method of measuring charge distribution of nanosized aerosols. J. Colloid Interface Sci. 282(1):46–57. doi: 10.1016/j.jcis.2004.08.066.
- Knutson, E., and K. Whitby. 1975. Aerosol classification by electric mobility: Apparatus, theory, and applications. J. Aerosol Sci. 6(6):443–451. doi: 10.1016/0021-8502(75)90060-9.
- Kulmala, M., H. Vehkamäki, T. Petäjä, M. Dal Maso, A. Lauri, V.-M. Kerminen, W. Birmili, and P. McMurry. 2004. Formation and growth rates of ultrafine atmospheric particles: A review of observations. J. Aerosol Sci. 35(2):143–176. doi: 10.1016/j.jaerosci.2003.10.003.
- Li, S., Y. Ren, P. Biswas, and D. T. Stephen. 2016. Flame aerosol synthesis of nanostructured materials and functional devices: Processing, modeling, and diagnostics. Progress Energy Combus. Sci. 55:1–59. doi: 10.1016/j.pecs.2016.04.002.
- Maißer, A., V. Premnath, A. Ghosh, T. A. Nguyen, M. Attoui, and C. J. Hogan. 2011. Determination of gas phase protein ion densities via ion mobility analysis with charge reduction. Phys. Chem. Chem. Phys. 13(48):21630–21641. doi: 10.1039/C1CP22127B.
- Mamakos, A., L. Ntziachristos, and Z. Samaras. 2007. Diffusion broadening of DMA transfer functions. Numerical validation of stolzenburg model. J. Aerosol Sci. 38(7):747–763. doi: 10.1016/j.jaerosci.2007.05.004.
- Martínez-Lozano, P., and M. Labowsky. 2009. An experimental and numerical study of a miniature high resolution isopotential DMA. J. Aerosol Sci. 40:451–462. doi: 10.1016/j.jaerosci.2009.01.004.
- Nie, Y., Y. Wang, and P. Biswas. 2017. Mobility and bipolar diffusion charging characteristics of crumpled reduced graphene oxide nanoparticles synthesized in a furnace aerosol reactor. J. Phys. Chem. C 121(19):10529–10537. doi: 10.1021/acs.jpcc.7b00189.
- Sahu, M., J. Park, and P. Biswas. 2012. In situ charge characterization of TiO2 and Cu–TiO2 nanoparticles in a flame aerosol reactor. J. Nanoparticle Res. 14:678. doi: 10.1007/s11051-011-0678-3.
- Sharma, G., S. Dhawan, N. Reed, R. Chakrabarty, and P. Biswas. 2018. Collisional growth rate and correction factor for TiO2 nanoparticles at high temperatures in free molecular regime. J. Aerosol Sci. 127:27–37. doi: 10.1016/j.jaerosci.2018.10.002.
- Song, D. K., H. M. Lee, H. Chang, S. S. Kim, M. Shimada, and K. Okuyama. 2006. Performance evaluation of long differential mobility analyzer (LDMA) in measurements of nanoparticles. J. Aerosol Sci. 37(5):598–615. doi: 10.1016/j.jaerosci.2005.06.003.
- Stark, W. J., and S. E. Pratsinis. 2002. Aerosol flame reactors for manufacture of nanoparticles. Powder Technol. 126(2):103–108. doi: 10.1016/S0032-5910(02)00077-3.
- Stolzenburg, M. R. 1988. An ultrafine aerosol size distribution measuring system. PhD diss., Department of Mechanical Engineering, University of Minnesota.
- Stolzenburg, M. R., and P. H. McMurry. 2008. Equations governing single and tandem DMA configurations and a new lognormal approximation to the transfer function. Aerosol Sci. Technol. 42(6):421–432. doi: 10.1080/02786820802157823.
- Ude, S., and J. Fernández de la Mora. 2005. Molecular monodisperse mobility and mass standards from electrosprays of tetra-alkyl ammonium halides. J. Aerosol Sci. 36(10):1224–1237. doi: 10.1016/j.jaerosci.2005.02.009.
- Wang, Y., J. Fang, M. Attoui, T. S. Chadha, W.-N. Wang, and P. Biswas. 2014. Application of half mini dma for Sub 2 nm particle size distribution measurement in an electrospray and a flame aerosol reactor. J. Aerosol Sci. 71:52–64. doi: 10.1016/j.jaerosci.2014.01.007.
- Wang, Y., J. Kangasluoma, M. Attoui, J. Fang, H. Junninen, M. Kulmala, T. Petäjä, and P. Biswas. 2017. The high charge fraction of flame-generated particles in the size range below 3nm measured by enhanced particle detectors. Combust. Flame 176:72–80. doi: 10.1016/j.combustflame.2016.10.003.
- Wang, Y., P. Liu, J. Fang, W.-N. Wang, and P. Biswas. 2015. Kinetics of Sub-2 nm TiO2 particle formation in an aerosol reactor during thermal decomposition of titanium tetraisopropoxide. J. Nanoparticle Res. 17:147. doi: 10.1007/s11051-015-2964-y.
- Zhang, J., and D. Chen. 2014. Differential mobility particle sizers for nanoparticle characterization. J. Nanotechnol. Eng. Med. 5(2):020801. doi: 10.1115/1.4028040.