
 ?Mathematical formulae have been encoded as MathML and are displayed in this HTML version using MathJax in order to improve their display. Uncheck the box to turn MathJax off. This feature requires Javascript. Click on a formula to zoom.
Abstract
Lab-scale soot nanoparticle generators are used by the aerosol research community to study the properties of soot over a broad range of particle size distributions, and number and mass concentrations. In this study, a novel miniature inverted-flame burner is presented and its emitted soot particles were characterized. The burner consisted of two co-annular tubes for fuel and co-flow air and the flame was enclosed by the latter. The fuel used was ethylene. A scanning mobility particle sizer (SMPS) and an aerodynamic aerosol classifier (AAC) were used to measure mobility and aerodynamic size distribution of soot particles, respectively. Particle morphology was studied using transmission electron microscopy (TEM). The elemental carbon (EC) and organic carbon (OC) content of the soot were measured using thermal-optical analysis (TOA). The burner produced soot particles with mobility diameter range of 66–270 nm, aerodynamic diameter range of 56–140 nm, and total concentration range of 2 × 10⁵–1 × 107 cm−3. TEM images showed that most soot particles were sub-micron soot aggregates. Some soot superaggregates, typically larger than 2 µm in length, were observed and their abundance increased with ethylene flow rate. TOA showed that the concentration of EC in the generated soot increased with ethylene flow rate, and the soot was observed to have high EC fraction at high ethylene flow rates. The miniature inverted-flame burner was demonstrated to produce soot nanoparticles over a range of concentrations and sizes with high EC content, making it a practical device to study soot nanoparticle properties in different applications.
Copyright © 2019 American Association for Aerosol Research
1. Introduction
Black carbon (BC) particles generated by incomplete combustion are known to have a strong climate forcing potential (Menon et al. Citation2002; Ramanathan and Carmichael Citation2008), and negative impacts on human health, including premature mortality (Anenberg et al. Citation2010; Lelieveld et al. Citation2015). The research community employs combustion-based aerosol generators, such as burners using gaseous fuels, to study the properties of BC particles for various applications such as optical studies (Zhang et al. Citation2008; Cross et al. Citation2010), instrument calibration (Onasch et al. Citation2012), and soot morphology studies (Pagels et al. Citation2009; Ghazi et al. Citation2013; Ghazi and Olfert Citation2013). Soot generators are used in research as a stable source of soot nanoparticles and can produce particles over a broad range of size, and number and mass concentrations. One such commercial soot generator is the miniature combustion aerosol standard (MiniCAST), from Jing Ltd. (Zollikofen BE, Switzerland), which is commonly used for laboratory measurement of soot properties (Giechaskiel et al. Citation2010; Gysel et al. Citation2012; Mamakos et al. Citation2013; Maricq Citation2014; Moore et al. Citation2014). The MiniCAST soot generator has been used in a wide range of applications to study calibration of BC mass instruments (Durdina et al. Citation2016), chemical structure and morphology of soot from aircraft turbine engines (Saffaripour et al. Citation2017), hygroscopic growth and droplet activation of soot particles (Henning et al. Citation2012), physical, chemical, and optical properties of soot from combustion engines (Mamakos et al. Citation2013), optical properties of soot particles as atmospheric aerosols (Utry et al. Citation2014; Bescond et al. Citation2016), cloud formation in the presence of soot as ice nuclei in a cloud chamber (Crawford et al. Citation2011), and diesel particulate filters (DPF) (Obeid, Lizarraga, et al. Citation2014; Obeid, Tsampas, et al. Citation2014).
Another commonly used soot generator for research is the inverted-flame burner originally developed by Stipe et al. (Citation2005). Due to the inverted design, the buoyancy of the hot gaseous products opposes the downward flow of reactants and prevents flame instabilities. Therefore, the flame is visually very stable and the concentration and size of soot particles are steady (Stipe et al. (Citation2005) reported a maximum standard deviation of less than 4% for the concentration over a period of 6 h). The inverted-flame burner has been used to investigate chemical structure and morphology of soot from aircraft turbine engines (Saffaripour et al. Citation2017), calibration of BC mass instruments (Dickau et al. Citation2015), effective density and morphology of soot (Ghazi et al. Citation2013; Tavakoli and Olfert Citation2014), soot aggregate restructuring due to coatings (Ghazi and Olfert Citation2013), morphology of soot superaggregates (Chakrabarty et al. Citation2012), and optical properties of soot (Coderre et al. Citation2011; Link et al. Citation2011). Despite its wide use in lab-scale studies, this type of burner is not commercially available and is relatively large in size which makes its handling difficult and limits its application in field calibration of diagnostic instruments. The burner also needs an additional stage of dilution which adds to its complexity.
In the present study, the properties of soot generated by a novel, commercially-available, miniature inverted-flame burner were characterized in terms of particle mobility and aerodynamic diameter size distributions, soot morphology, and elemental and organic carbon (OC) content of the soot particles. The main advantages of this burner are its portability, simplicity, low fuel consumption, and relatively low cost compared to other soot generators. The data presented in this paper can be used by the combustion and aerosol research communities to help select operating conditions best suited for their specific application. The miniature inverted-flame burner can be used as a stable source of soot nanoparticles for a wide range of applications (such as instrument calibration, atmospheric studies, soot filtration studies, and soot morphology studies), where the ability to tune particle size distributions, and number and mass concentrations over broad ranges is desired.
2. Experimental setup
The schematic of the miniature inverted-flame burner is shown in . The burner consisted of two co-annular tubes for fuel and co-flow air. The inner fuel tube and the outer co-flow air tubes were made from stainless steel and quartz, respectively. An annular-shaped bluff body was attached to the outlet of the fuel tube to stabilize the flame. In this study, ethylene was selected as the fuel of choice due to its high sooting propensity compared to other gaseous fuels such as methane or propane. The generated flame was an inverted diffusion flame enclosed by the quartz tube. A portion of the co-flow air near the flame was used for the combustion of the fuel while the rest of the co-flow air in the vicinity of the quartz tube diluted the combustion products downstream of the flame, without the need for secondary dilution. Prior to combustion, the co-flow air passed through a series of porous stainless-steel discs, with pore size of 40 µm, centered with the fuel tube to ensure an air flow with parallel streamlines. A helical copper tubing with an OD of 19.1 mm connected to the exhaust outlet of the burner allowed heat transfer between the hot exhaust gases and the surrounding air and brought the sample to safe temperatures.
Figure 1. Schematic and isometric view of the miniature inverted-flame burner showing its overall dimensions and main components. 1: fuel tube, 2: top cap, 3: co-flow air inlet, 4: porous discs, 5: co-flow air tube (quartz tube), and 6: exhaust outlet.
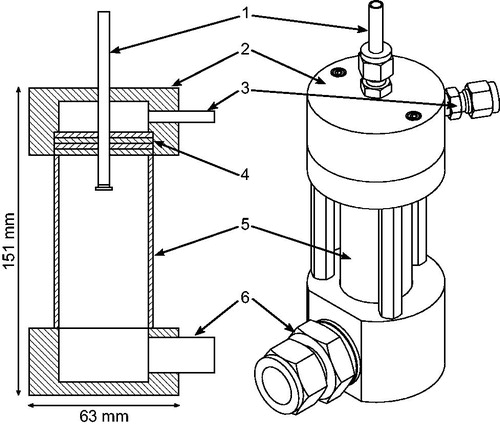
In designing the burner, three different sizes for the fuel tube and the co-flow air tube were tested to investigate the effect of geometry on flame stability and emission of soot particles. summarizes the details of each geometry. Experiments showed that only the large geometry could generate a flame with a wide range of soot particle concentrations. Preliminary investigation showed that in the case of very low global equivalence ratio (Φ), i.e. the actual fuel-to-air ratio to the stoichiometric fuel-to-air ratio, the flame had a closed tip with very low soot particle concentration. However, when the equivalence ratio exceeded a certain threshold, the flame tip opened and generated high concentrations of soot particles. Small and medium sized geometries resulted in a closed tip flame and only generated soot particles with very low concentrations (∼7 × 10³–∼2 × 104 cm−3) due to oxidation near the tip of the flame. In this paper, we only focus on the burner with the large geometry, which is identical in geometry to the commercial version of the burner from Argonaut Scientific Corporation (Edmonton, AB, Canada, Model MISG–1).
Table 1. Summary of three different geometries tested during the design of the burner.
shows the schematic of the experimental setup that was used to characterize the soot particles generated using the miniature inverted-flame burner. Ethylene and dry particle-free air were provided to the burner and their flow rates were adjusted using mass flow controllers (Cole-Parmer, Vernon Hills, IL, USA, Model 32907-67 and Omega, Norwalk, CT, USA, Model FMA-2608A, respectively). Both mass flow controllers had reference temperature and pressure of 25 °C and 101,325 Pa, respectively. Care was taken to avoid condensation of water vapor in the exhaust products when the sample was brought to room temperature by adjusting the ethylene and air flow rates (see section 3 for more details).
Figure 2. Schematic of the experimental setup used to characterize the size, morphology, and carbon content of the particles.
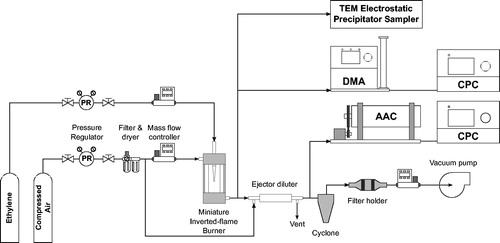
Soot particles were characterized in terms of their mobility and aerodynamic diameter, morphology, and organic/elemental carbon (EC) content. Mobility diameter size distribution of soot particles was measured using a scanning mobility particle sizer (SMPS), which consisted of a differential mobility analyzer (DMA; TSI Inc., Shoreview, MN, USA, Model 3081) and a condensation particle counter (CPC; TSI Inc., Shoreview, MN, USA, Model 3776). The measurement range of the particle mobility diameter using the SMPS was 15 to 661 nm when the aerosol and the sheath air flow rates were 0.30 L/min and 3.00 L/min, respectively. The mobility diameter size distribution was measured using the inversion scheme in TSI’s Aerosol Instrument Manager (AIM, version 9.0) software. The multiple charging correction to the mobility diameter size distribution was done following the algorithm explained by He and Dhaniyala (Citation2013). Multiple charging correction generally increases the median (or mode) of the mobility diameter size distribution, while decreasing the total particle number concentration. With the high particle concentration observed in most cases, a delay time between consecutive measurements, sufficient to reach a concentration reading of less than 1 particle/cm3 in the CPC, was employed. Without this delay, the remnants of soot particles in the SMPS from the previous measurement would appear as an additional mode at the beginning of the mobility diameter size distribution and would alter the reported mean mobility diameter and total concentration of particles. An impactor, with a 0.071-cm orifice, at the inlet of the DMA had a D50 of 1.29 µm and effectively removed particles larger than this size. Frequent cleaning of the impactor plate and orifice was necessary due to high concentrations of large soot particles, which eventually caused significant pressure drop across the impactor.
Aerodynamic diameter size distribution of soot particles was measured using a tandem arrangement of an aerodynamic aerosol classifier (AAC; Cambustion Ltd., Cambridge, UK) and a CPC (TSI Inc., Model 3776). The AAC consists of two co-axial cylinders rotating with the same angular velocity. The particle classification in the AAC is based on the balance of centrifugal and drag forces acting on the particles in the small gap between the two cylinders (Tavakoli and Olfert Citation2013). Particles are classified based on their relaxation time, τ, which can be easily related to their aerodynamic equivalent diameter, da, as follows:
(1)
(1)
where, Cc is the Cunningham slip correction factor, ρ0 is the standard density (1000 kg/m3), and μ is the gas viscosity. An aerodynamic diameter size range of 30 nm to 2.5 µm was achieved when the aerosol and sheath air flow rates were 0.3 and 3.00 L/min, respectively. The upper limit of the aerodynamic diameter size distribution was bound to 2.5 µm, which is the maximum size that the CPC can measure reliably. The AAC resolution in the relaxation time space, R, was 10, which is defined as
(2)
(2)
where, Qsh is the sheath air flow rate and Qa is the aerosol flow rate. The data inversion of Johnson et al. (Citation2018) was implemented in the AAC software to calculate the aerodynamic diameter size distribution of the AAC-CPC measurements.
Due to high particle concentration for most burner conditions and to maintain the particle concentration within the measurement limit of the CPC, an ejector diluter (Dekati Ltd., Kangasala, Finland, Model DI-1000) was used upstream of the AAC. Dry particle-free air was supplied to the diluter at 200 kPa gauge pressure and the excess air was vented after dilution. The average dilution factor of the ejector diluter was ∼12.7 for various operating conditions of the burner by comparing the CO2 mole fraction of the undiluted and diluted samples using a non-dispersive infrared CO2 analyzer (Li-Cor Corp., Lincoln, NE, USA, Model 840A).
Morphology of soot particles was studied using transmission electron microscopy (TEM). A high-efficiency electrostatic precipitator (ESPnano, Spokane, WA, USA, Model 100) was used to collect soot particles on ultra-thin carbon film supported by 400 mesh copper electron-microscopy grids (Ted Pella Inc., Redding, CA, USA, Model 01824). The samples were characterized using a JEOL JEM 2100 transmission electron microscope, operating at an accelerating voltage of 200 kV. Images were captured using a Gatan CCD camera with a magnification ranging from 25,000 to 800,000 times.
The mass concentration of OC and EC was measured by collecting soot particles on 47 mm pre-fired quartz fiber filters which were analyzed by thermal-optical analysis (TOA) following the NIOSH 5040 protocol using a Sunset Labs analyzer. The filters were held in a dual-stage stainless-steel filter holder (URG Corp., Chapel Hill, NC, USA, Model 2000-30FXT). The OC measured on the second filter stage, assumed to be from gas-phase condensation, was used to account for the effect of gas-phase OC absorption when determining the net OC concentration measured on the first filter stage. The soot sample was drawn through the filter holder using a mass flow controller (Alicat Scientific, Tucson, AZ, USA, Model MCR-50SLPM-D) and a vacuum pump (GAST Inc., Benton Harbor, MI, USA, Model DAA-P501). The mass flow controller was set at 26 SLPM, where SLPM is the flow rate in L/min at the flow controller’s reference temperature and pressure of 25 °C and 101,325 Pa, respectively. Total sample volume was calculated by acquisition of the flow rate data from the mass flow controller over the time interval of the sample collection. Due to high mass concentration of the soot particles and to allow sufficiently long collection time, an ejector diluter identical to the one described earlier was used upstream of the filter holder. Moreover, particles larger than 2.1 µm were removed using a cyclone (BGI Instruments, Butler, NJ, USA, Model 3825) between the ejector diluter and the filter holder.
3. Results and discussion
A range of ethylene flow rates from 0.080 to 0.130 SLPM and air flow rates from 6.0 to 10.0 SLPM were tested to investigate the flame shape and stability. shows an overview of the tested ethylene and air flow rates in a matrix form. Particular care was taken to avoid any condensation of water vapor in the exhaust products when the sample cooled down to room temperature (i.e., 20 °C). As mentioned earlier, the global equivalence ratio for all tested conditions was below unity and a portion of the co-flow air was consumed for the combustion reaction in the inverted diffusion flame while the remainder diluted the exhaust products. Calculations showed that when the molar ratio (or volume flow rate ratio) of air to ethylene is above ∼65, the partial pressure of water vapor in the products is below its saturation pressure at room temperature. Therefore, condensation of water vapor was avoided by adjusting the ratio of air to ethylene flow rate to be greater than 65. The dark gray color in indicates conditions where condensation is expected, while the light gray color shows conditions with no expected condensation. The range of operation for flow conditions with expected condensation may be extended slightly but requires dilution of the sample at the burner outlet with a separate dilution system, such as an ejector diluter, to avoid condensation; however, the lower limit of the air flow rate will be bound as explained below.
Figure 3. Overview of the tested ethylene and air flow rates. Dark gray and light gray colors indicate flow conditions where condensation of water vapor in the exhaust products is or is not expected, respectively. Letters indicate the shape of the flame checked visually for open (O), partially open (PO), and closed (C) tip. CB indicates curled flame base.
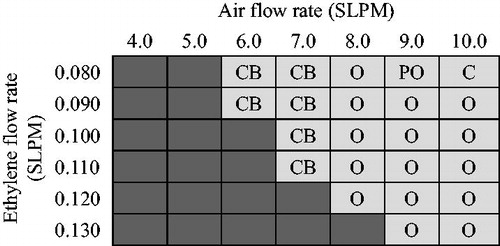
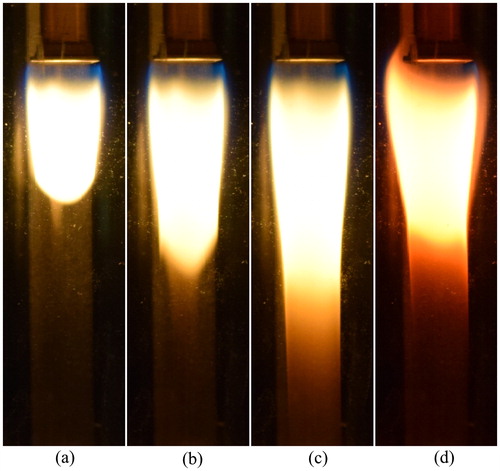
At each tested flow condition, the shape and appearance of the flame was visually checked. also shows conditions where the flame tip was open, partially open, or closed and shows example images of each case. Qualitatively, a closed tip flame indicated very low concentration of soot particles, due to oxidation of most particles within the flame, while an open tip flame generated high concentrations of soot particles. When the co-flow air flow rate was at or below 7.0 SLPM, the flame base had a curled shape which moved upstream and past the bluff body and caused gradual formation and deposition of large soot agglomerates at the fuel tube outlet and eventually made the flame asymmetric (). Stipe et al. (Citation2005) reported a similar issue with their large inverted-flame burner and argued that it occurs due to excessive heating of the bluff body which, in turn, preheats the fuel. Although this misshape did not radically change the performance of the burner, such flow conditions were not considered as optimal operating points of the burner, and they were avoided in this study.
Figure 4. Image of flame shape with (a) closed tip, (b) partially open tip, (c) open tip, and (d) curled base.
3.1. Particle mobility diameter size distributions
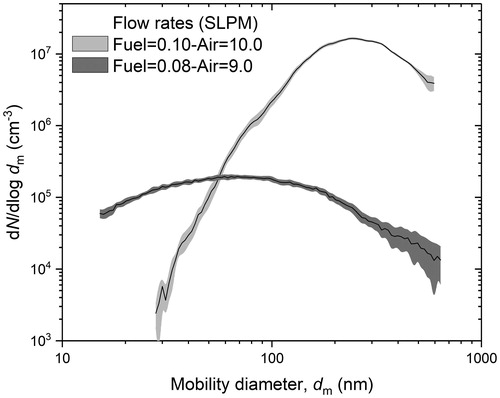
Previous studies have mentioned the difficulty of obtaining a repeatable particle size distribution from soot generators due to long stabilization time, cyclic operation, or condensation of water vapor in sampling lines (Kayes and Hochgreb Citation1998; Graskow et al. Citation1999). To reduce the impact of these factors, water condensation was avoided by adjusting the fuel and air flow rates as noted earlier. Moreover, the particle concentration fluctuated significantly for about 1 h after the burner was started but became very stable after ∼90 min. Data presented here were acquired after warm-up time of ∼2 h. Subsequent to the initial warm-up time, when the flow conditions were changed, an extra 10–15 min was considered to allow the burner to reach steady state for the new condition. After the burner was in a thermal steady-state, the particle size distribution did not change significantly, as shown in . The figure shows eight consecutive SMPS scans over a period of ∼90 min (with 10-min interval between scans) after the initial warm-up time for two representative fuel and air flow conditions where the mobility diameter size distribution has a large and small mode. In the case of fuel and air flow rates of 0.100 and 10.0 SLPM, respectively, the mode of the size distribution was ∼250 nm, the average total particle concentration was 8 × 106 cm−3 with a standard deviation of 2 × 105 cm−3, and the relative standard deviation was ∼2.7%. In the case of fuel and air flow rates of 0.080 and 9.0 SLPM, respectively, the mode of the size distribution was ∼66 nm, the average total particle concentration was 2 × 105 cm−3 with a standard deviation of 1.9 × 104 cm−3, and the relative standard deviation was ∼9.3%. In the latter case, the total particle concentration was relatively low and the SMPS measurements had more scatter compared to the former case, where the total particle concentration was high. All particle mobility diameter size distributions shown hereafter are an average of multiple consecutive SMPS scans during the steady-state operation of the burner.
Figure 5. Repeatability of particle size distribution during steady state (after the initial warm-up time of the burner) for two representative cases: ethylene and air flow rates of 0.100 and 10.0 SLPM, respectively, and ethylene and air flow rates of 0.080 and 9.0 SLPM, respectively. In each case, the solid line is the average mobility diameter size distribution and the shaded band is the standard deviation.
shows the flow conditions with an open or partially open flame tip in and their corresponding global equivalence ratios as well as mode, total particle concentration, and geometric standard deviation of the mobility diameter size distributions. As the right tail of the mobility diameter size distribution in most flow conditions was measured partially by the SMPS, we chose to report the mode of a lognormal fit of the data points instead of their count median or geometric mean diameters. For the same reason, we report the total particle concentration and geometric standard deviation of the lognormal fit of the data points. shows four representative flow conditions which will be subject to a more detailed analysis. The air flow rate was constant at 10 SLPM in all four conditions, while the fuel flow gradually increased.
Figure 6. Burner flow conditions for open or partially open tip flames with corresponding (a) global equivalence ratio, (b) total particle concentration of lognormal fit, (c) mode diameter of lognormal fit, and (d) geometric standard deviation of lognormal fit.
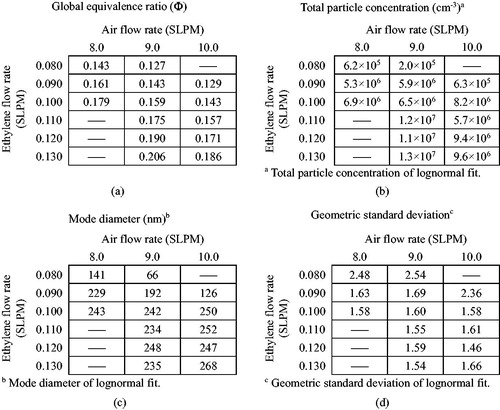
Table 2. Four representative flow conditions with corresponding global equivalence ratio and mobility diameter size distribution parameters.
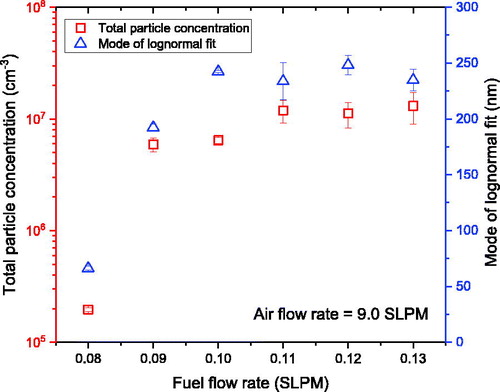
The trend of the change of mode of mobility diameter and total concentration of particles as the fuel flow rate increases is clearly seen in . For example, when the fuel flow rate increased from 0.080 to 0.130 SLPM and the air flow rate was held constant at 9.0 SLPM, the mode of the mobility diameter of the particles increased sharply before reaching a relatively constant value. Similarly, as the fuel flow rate increased, the total particle concentration increased sharply by two orders of magnitude until it reached a relatively constant value. This observation is in agreement with those of Ghazi et al. (Citation2013) and Stipe et al. (Citation2005) for the large inverted-flame burner, where a sharp increase in the particle mean diameter and concentration was reported as the fuel flow rate increased until they plateaued to constant values.
Figure 7. Total concentration and mode of mobility diameter of particles for fuel flow rates from 0.08 to 0.130 SLPM and a constant air flow rate of 9.0 SLPM.
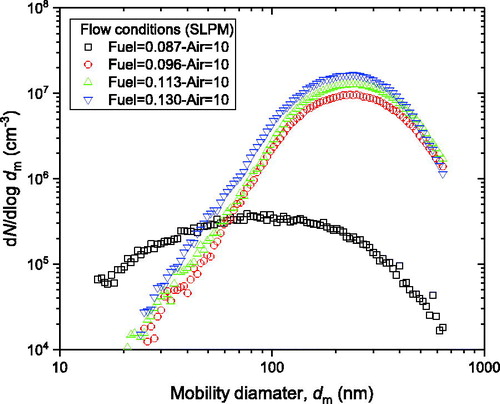
shows the particle mobility diameter size distributions for the four representative conditions in . It is clear that the mode and the total concentration of particles increased when the fuel flow rate was increased. Particularly, the particle concentration increased by orders of magnitude with an initial slight increase in the fuel flow rate, followed by relatively modest increases with subsequent increases in the fuel flow rate.
Figure 8. Mobility size distribution for four representative flow conditions.
3.2. Transmission electron microscopy
shows sample TEM images for three representative burner conditions with air flow rate of 10.0 SLPM and fuel flow rates of 0.087, 0.096, and 0.130 SLPM. A set of 59, 75, and 54 particles were investigated for the specified burner conditions, respectively. The majority of soot particles had a maximum Feret diameter less than 1 µm and had an aggregate structure (), typical of particles from combustion sources. High-magnification images of these soot aggregates showed that the primary particles had a graphitic layer structure (), similar to soot particles from diesel engines, non-premixed flames of liquid fuels, and other combustion sources (Vander Wal and Tomasek Citation2004; Vander Wal et al. Citation2007; Botero et al. Citation2016).
Figure 9. Sample TEM images of soot particles showing typical soot aggregates in (a) and (b), graphitic layer structure of primary particles in (c), and clustered superaggregates in (d)–(f).
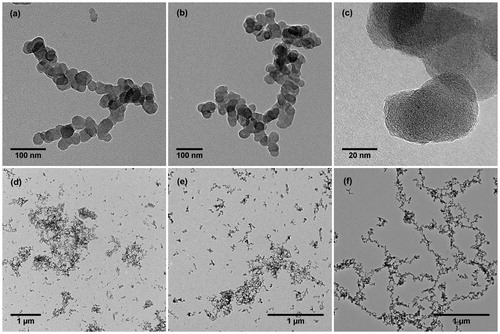
Besides the sub-micron soot aggregates, clustered superaggregates of soot typically larger than 2 µm maximum Feret diameter were observed in relatively low numbers in all studied samples (). As the ethylene flow rate increased, so did the abundance of these superaggregates.
Kim et al. (Citation2006) reported the formation of superaggregates in laminar diffusion flames and suggested that it occurs over four distinct growth stages: Stages 1 and 3 are diffusion limited cluster aggregation (DLCA) in three and two dimensions, respectively; Stages 2 and 4 are percolation in three and two dimensions, respectively. Similar to our results, Chakrabarty et al. (Citation2012) also reported the formation of superaggregates in the size range of 2 to 10 µm maximum Feret diameter in a large inverted methane diffusion flame. Their results confirmed that the growth mechanism of superaggregates in an inverted flame was consistent with DLCA mechanism followed by transition into percolation stage. Chakrabarty et al. (Citation2012) suggested that a stagnation plane is formed at the tip of the inverted flame due to the opposing effect of upward buoyancy force and downward flow forces. This stagnation plane confines the aggregates and enhances their residence time to evolve into percolation stage to form superaggregates.
Note that Ghazi et al. (Citation2013) reported the existence of soot particles with a “compact” structure and smaller indistinguishable primary particles from a large inverted methane diffusion flame; however, with the current burner and fuel type, we did not observe such particles under the TEM.
3.3. Aerodynamic diameter size distributions
shows the aerodynamic diameter size distribution for the four representative conditions in . As mentioned earlier, the aerodynamic diameter size distribution is only shown up to 2.5 µm, which is the upper size limit of the CPC. Data points with a concentration of zero are not shown on the plot due to the logarithmic scale of y-axis. Similar to the results of mobility diameter size distributions, shows that as the ethylene flow rate increased, the aerodynamic median diameter of soot particles increased from 56 nm to a relatively constant value of 140 nm. The same trend was seen for the concentration of soot particles, where it increased by orders of magnitude with a slight increase in the fuel flow rate until it reached a relatively constant concentration with subsequent increases in the fuel flow rate. A shoulder was observed in the aerodynamic diameter size distributions for particle sizes larger than 400 nm, which became more pronounced with increasing ethylene flow rate. Presumably, this shoulder is due to superaggregates whose aerodynamic diameter is less than one micron due to a rapid decrease in the effective density of soot particles as their size increases (Maricq and Xu Citation2004; Ghazi et al. Citation2013). Such a shoulder may not be observed in the mobility diameter size distributions because of the 661-nm size limit of the DMA.
Figure 10. Aerodynamic diameter size distribution for four representative flow conditions.
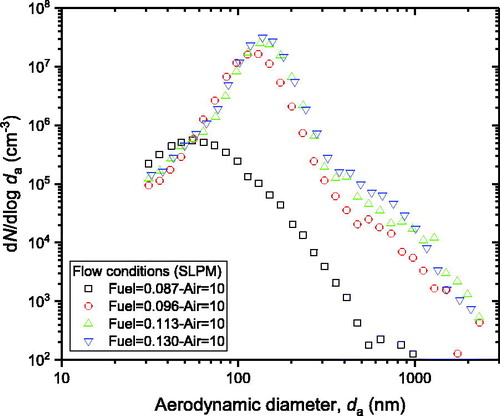
The AAC results suggest that for applications where users are interested in soot nanoparticles, high ethylene flow rates could be avoided or large superaggregates could be removed from the aerosol using an impactor or a cyclone.
It should be noted that there is good agreement between the total number concentration of particles measured by the AAC and the SMPS. The total particle number concentration measured by the SMPS for ethylene flow rates of 0.087, 0.096, 0.113, and 0.130 SLPM () were 3.5 × 10⁵, 5.3 × 10⁶, 7.0 × 10⁶, and 8.7 × 106 cm−3, respectively. The total particle number concentration for the same ethylene flow rates were 2.6 × 10⁵, 4.6 × 10⁶, 6.5 × 10⁶, and 8.0 × 106 cm−3, respectively, when measured by the AAC. These results show that the agreement between the total number concentration of particles measured by the AAC and the SMPS is generally within the ±10% uncertainty of the CPC.
3.4. Elemental and organic carbon measurements
The EC and OC content of the soot particles for the four representative burner conditions in were measured and the results are summarized in . For the measurement of the OC content, two pre-fired quartz fiber filters were used: the first filter collects particulate-phase OC and EC and adsorbed gas-phase OC, whereas the second filter was presumed to only be exposed to gas phase species and thus the measured OC from this filter would represent adsorbed gas-phase OC. Therefore, the amount of OC on the second filter was subtracted from that of the first filter to obtain an estimate of the particle-phase OC content. For each condition, three sets of filters (front and backer) were collected and two punches from each filter were analyzed by TOA. The uncertainties in were calculated based on propagation of precision and bias uncertainties. The precision uncertainty was estimated based on the six measurement repeats (three filters with two punches). The bias uncertainties of the OC and EC readings, Bm, were estimated according to the specification of Sunset Labs analyzer in terms of mass of OC or EC per unit area as
(3)
(3)
where all measurements are in units of µg/cm2. These values were converted to concentration uncertainties through measurement of the filter stain area and the sampled aerosol volume.
Table 3. Concentration of OC on the first and second filters, particle-phase OC, EC, and EC/TC ratio for the four representative burner conditions.
The results of the EC and OC analysis showed that a large fraction of the soot from the burner was EC. Similar to the trend observed for the particle mobility and aerodynamic diameter size distributions, the concentration of EC increased with fuel flow rate while the concentration of measured particulate-phase OC was comparatively small (in fact, the uncertainty is larger than the measurement) and did not change significantly with fuel flow rate, leading to high ratios of EC to total carbon (TC) at high fuel flow rates. A major contributor to the uncertainty of EC/TC ratio is the large uncertainty in the particulate-phase OC. These results show that the miniature inverted-flame burner, operated at these fuel and air flow rates, can be used as source of nanoparticles for applications where high EC content is required.
4. Conclusion
The emitted soot particles from a novel miniature inverted-flame burner were characterized in terms of their mobility and aerodynamic diameter size distributions, morphology, and OC and EC content. Different ethylene and air flow rates were tested to study the flame appearance and the characteristics of the soot generated. The results showed that particle mobility diameter and concentration increased sharply with ethylene flow rate and reached a relatively constant mobility diameter and concentration of ∼230 nm and ∼8.7 × 106 cm−3, respectively, at high ethylene flow rates. Thus, users can adjust the fuel flow rate to produce a wide range of particle number and mass concentrations. Moreover, the particle aerodynamic diameter and concentration showed a trend similar to that observed for the particle mobility diameter. The TOA showed that most of the emission content from the burner was EC. The concentration of EC increased with ethylene flow rate while the concentration of OC was comparatively small, leading to high ratios of elemental to total carbon at high ethylene flow rates. Transmission electron microscopy images of soot particles from the flame showed that the majority of soot particles were sub-micron in size and had aggregate structure. Large clustered superaggregates, typically larger than 2 µm, were observed for all studied samples, and their abundance increased with ethylene flow rate. Thus, if users wish to use the burner as a source of soot nanoparticles, then high fuel flow rates could be avoided or large superaggregates could be removed using an impactor or a cyclone. This novel miniature inverted-flame burner can be used by the research community as a stable source of soot particles in applications where high EC content is desired, such as instrument calibration. Portability, simple design, and low fuel consumption are the main advantages of this burner, which make it ideal for field applications. While this study focused on ethylene as the fuel, future studies could investigate other gaseous fuels and characterize the generated soot particles produced by those fuels.
Acknowledgments
The authors also thank Brett Smith of National Research Council of Canada and Dr. Xuejun Sun of Cell Imaging Facility at the University of Alberta for their help in conducting thermal-optical analysis and in preparing TEM images, respectively.
Additional information
Funding
Related Research Data
References
- Anenberg, S. C., L. W. Horowitz, D. Q. Tong, and J. J. West. 2010. An estimate of the global burden of anthropogenic ozone and fine particulate matter on premature human mortality using atmospheric modeling. Environ. Health Perspect. 118 (9):1189–95. doi: 10.1289/ehp.0901220.
- Bescond, A., J. Yon, F. X. Ouf, C. Rozé, A. Coppalle, P. Parent, D. Ferry, and C. Laffon. 2016. Soot optical properties determined by analyzing extinction spectra in the visible near-UV: Toward an optical speciation according to constituents and structure. J. Aerosol Sci. 101:118–32. doi: 10.1016/j.jaerosci.2016.08.001.
- Botero, M. L., D. Chen, S. González-Calera, D. Jefferson, and M. Kraft. 2016. HRTEM evaluation of soot particles produced by the non-premixed combustion of liquid fuels. Carbon 96:459–73. doi: 10.1016/j.carbon.2015.09.077.
- Chakrabarty, R. K., H. Moosmüller, M. A. Garro, and C. B. Stipe. 2012. Observation of superaggregates from a reversed gravity low-sooting flame. Aerosol Sci. Technol. 46 (1):1–3. doi: 10.1080/02786826.2011.608389.
- Coderre, A. R., K. A. Thomson, D. R. Snelling, and M. R. Johnson. 2011. Spectrally resolved light absorption properties of cooled soot from a methane flame. Appl. Phys. B 104 (1):175–88. doi: 10.1007/s00340-011-4448-9.
- Crawford, I., O. Möhler, M. Schnaiter, H. Saathoff, D. Liu, G. McMeeking, C. Linke, M. Flynn, K. N. Bower, P. J. Connolly, et al. 2011. Studies of propane flame soot acting as heterogeneous ice nuclei in conjunction with single particle soot photometer measurements. Atmos. Chem. Phys. 11 (18):9549–61. doi: 10.5194/acp-11-9549-2011.
- Cross, E. S., T. B. Onasch, A. Ahern, W. Wrobel, J. G. Slowik, J. Olfert, D. A. Lack, P. Massoli, C. D. Cappa, J. P. Schwarz, et al. 2010. Soot particle studies-instrument inter-comparison-project overview. Aerosol Sci. Technol. 44 (8):592–611. doi: 10.1080/02786826.2010.482113.
- Dickau, M., T. J. Johnson, K. Thomson, G. Smallwood, and J. S. Olfert. 2015. Demonstration of the CPMA-electrometer system for calibrating black carbon particulate mass instruments. Aerosol Sci. Technol. 49 (3):152–8. doi: 10.1080/02786826.2015.1010033.
- Durdina, L., P. Lobo, M. B. Trueblood, E. A. Black, S. Achterberg, D. E. Hagen, B. T. Brem, and J. Wang. 2016. Response of real-time black carbon mass instruments to mini-CAST soot. Aerosol Sci. Technol. 50 (9):906–18. doi: 10.1080/02786826.2016.1204423.
- Ghazi, R., and J. S. Olfert. 2013. Coating mass dependence of soot aggregate restructuring due to coatings of oleic acid and dioctyl sebacate. Aerosol Sci. Technol. 47 (2):192–200. doi: 10.1080/02786826.2012.741273.
- Ghazi, R., H. Tjong, A. Soewono, S. N. Rogak, and J. S. Olfert. 2013. Mass, mobility, volatility, and morphology of soot particles generated by a McKenna and inverted burner. Aerosol Sci. Technol. 47 (4):395–405. doi: 10.1080/02786826.2012.755259.
- Giechaskiel, B., M. Cresnoverh, H. Jörgl, and A. Bergmann. 2010. Calibration and accuracy of a particle number measurement system. Meas. Sci. Technol. 21 (4):045102. doi: 10.1088/0957-0233/21/4/045102.
- Graskow, B. R., D. B. Kittelson, M. R. Ahmadi, and J. E. Morris. 1999. Exhaust particulate emissions from a direct injection spark ignition engine. SAE Technical Paper, no. 1999-01-1145. Warrendale, PA: SAE International. doi: 10.4271/1999-01-1145.
- Gysel, M., M. Laborde, A. A. Mensah, J. C. Corbin, A. Keller, J. Kim, A. Petzold, and B. Sierau. 2012. Technical note: The single particle soot photometer fails to reliably detect PALAS soot nanoparticles. Atmos. Meas. Tech. 5 (12):3099–107. doi: 10.5194/amt-5-3099-2012.
- He, M., and S. Dhaniyala. 2013. A multiple charging correction algorithm for scanning electrical mobility spectrometer data. J. Aerosol Sci. 61:13–26. doi: 10.1016/j.jaerosci.2013.03.007.
- Henning, S., M. Ziese, A. Kiselev, H. Saathoff, O. Möhler, T. F. Mentel, A. Buchholz, C. Spindler, V. Michaud, M. Monier, et al. 2012. Hygroscopic growth and droplet activation of soot particles: Uncoated, succinic or sulfuric acid coated. Atmos. Chem. Phys. 12 (10):4525–37.doi: 10.5194/acp-12-4525-2012.
- Johnson, T. J., M. Irwin, J. P. R. Symonds, J. S. Olfert, and A. M. Boies. 2018. Measuring aerosol size distributions with the aerodynamic aerosol classifier. Aerosol Sci. Technol. 52 (6):655–65. doi: 10.1080/02786826.2018.1440063.
- Kayes, D., and S. Hochgreb. 1998. Investigation of the dilution process for measurement of particulate matter from Spark-Ignition engines. SAE Technical Paper 982601. Warrendale, PA: SAE International. doi: 10.4271/982601.
- Kim, W., C. M. Sorensen, D. Fry, and A. Chakrabarti. 2006. Soot aggregates, superaggregates and gel-like networks in laminar diffusion flames. J. Aerosol Sci. 37 (3):386–401. doi: 10.1016/j.jaerosci.2005.05.022.
- Lelieveld, J., J. S. Evans, M. Fnais, D. Giannadaki, and A. Pozzer. 2015. The contribution of outdoor air pollution sources to premature mortality on a global scale. Nature 525 (7569):367–71. doi: 10.1038/nature15371.
- Link, O., D. R. Snelling, K. A. Thomson, and G. J. Smallwood. 2011. Development of absolute intensity multi-angle light scattering for the determination of polydisperse soot aggregate properties. Proc. Combust. Inst. 33 (1):847–54. doi: 10.1016/j.proci.2010.06.073.
- Mamakos, A., I. Khalek, R. Giannelli, and M. Spears. 2013. Characterization of combustion aerosol produced by a Mini-CAST and treated in a catalytic stripper. Aerosol Sci. Technol. 47 (8):927–36. doi: 10.1080/02786826.2013.802762.
- Maricq, M. M. 2014. Examining the relationship between black carbon and soot in flames and engine exhaust. Aerosol Sci. Technol. 48 (6):620–29. doi: 10.1080/02786826.2014.904961.
- Maricq, M. M., and N. Xu. 2004. The effective density and fractal dimension of soot particles from premixed flames and motor vehicle exhaust. J. Aerosol Sci. 35 (10):1251–74. doi: 10.1016/j.jaerosci.2004.05.002.
- Menon, S., J. Hansen, L. Nazarenko, and Y. Luo. 2002. Climate effects of black carbon aerosols in China and India. Science 297 (5590):2250–53. doi: 10.1126/science.1075159.
- Moore, R. H., L. D. Ziemba, D. Dutcher, A. J. Beyersdorf, K. Chan, S. Crumeyrolle, T. M. Raymond, K. L. Thornhill, E. L. Winstead, and B. E. Anderson. 2014. Mapping the operation of the miniature combustion aerosol standard (Mini-CAST) soot generator. Aerosol Sci. Technol. 48 (5):467–79. doi: 10.1080/02786826.2014.890694.
- Obeid, E., L. Lizarraga, M. N. Tsampas, A. Cordier, A. Boréave, M. C. Steil, G. Blanchard, K. Pajot, and P. Vernoux. 2014. Continuously regenerating diesel particulate filters based on ionically conducting ceramics. J. Catal. 309:87–96. doi: 10.1016/j.jcat.2013.09.004.
- Obeid, E., M. N. Tsampas, S. Jonet, A. Boréave, L. Burel, M. C. Steil, G. Blanchard, K. Pajot, and P. Vernoux. 2014. Isothermal catalytic oxidation of diesel soot on yttria-stabilized zirconia. Solid State Ion. 262:253–6. doi: 10.1016/j.ssi.2013.12.015.
- Onasch, T. B., A. Trimborn, E. C. Fortner, J. T. Jayne, G. L. Kok, L. R. Williams, P. Davidovits, and D. R. Worsnop. 2012. Soot particle aerosol mass spectrometer: Development, validation, and initial application. Aerosol Sci. Technol. 46 (7):804–17. doi: 10.1080/02786826.2012.663948.
- Pagels, J., A. F. Khalizov, P. H. McMurry, and R. Y. Zhang. 2009. Processing of soot by controlled sulphuric acid and water condensation—Mass and mobility relationship. Aerosol Sci. Technol. 43 (7):629–40. doi: 10.1080/02786820902810685.
- Ramanathan, V., and G. Carmichael. 2008. Global and regional climate changes due to black carbon. Nat. Geosci. 1 (4):221–27. doi: 10.1038/ngeo156.
- Saffaripour, M., L.-L. Tay, K. A. Thomson, G. J. Smallwood, B. T. Brem, L. Durdina, and M. Johnson. 2017. Raman spectroscopy and TEM characterization of solid particulate matter emitted from soot generators and aircraft turbine engines. Aerosol Sci. Technol. 51 (4):518–31. doi: 10.1080/02786826.2016.1274368.
- Stipe, C. B., B. S. Higgins, D. Lucas, C. P. Koshland, and R. F. Sawyer. 2005. Inverted co-flow diffusion flame for producing soot. Rev. Sci. Instrum. 76 (2):023908. doi: 10.1063/1.1851492.
- Tavakoli, F., and J. S. Olfert. 2013. An instrument for the classification of aerosols by particle relaxation time: Theoretical models of the aerodynamic aerosol classifier. Aerosol Sci. Technol. 47 (8):916–26. doi: 10.1080/02786826.2013.802761.
- Tavakoli, F., and J. S. Olfert. 2014. Determination of particle mass, effective density, mass–mobility exponent, and dynamic shape factor using an aerodynamic aerosol classifier and a differential mobility analyzer in tandem. J. Aerosol Sci. 75:35–42. doi: 10.1016/j.jaerosci.2014.04.010.
- Utry, N., T. Ajtai, M. Pintér, Z. Bozóki, and G. Szabó. 2014. Wavelength-dependent optical absorption properties of artificial and atmospheric aerosol measured by a multi-wavelength photoacoustic spectrometer. Int. J. Thermophys. 35 (12):2246–58. doi: 10.1007/s10765-014-1746-6.
- Vander Wal, R. L., and A. J. Tomasek. 2004. Soot nanostructure: Dependence upon synthesis conditions. Combust. Flame 136 (1–2):129–40. doi: 10.1016/j.combustflame.2003.09.008.
- Vander Wal, R. L., A. Yezerets, N. W. Currier, D. H. Kim, and C. M. Wang. 2007. HRTEM study of diesel soot collected from diesel particulate filters. Carbon 45 (1):70–7. doi: 10.1016/j.carbon.2006.08.005.
- Zhang, R., A. F. Khalizov, J. Pagels, D. Zhang, H. Xue, and P. H. McMurry. 2008. Variability in morphology, hygroscopicity, and optical properties of soot aerosols during atmospheric processing. Proc. Natl. Acad. Sci. USA 105 (30):10291–96. doi: 10.1073/pnas.0804860105.