
 ?Mathematical formulae have been encoded as MathML and are displayed in this HTML version using MathJax in order to improve their display. Uncheck the box to turn MathJax off. This feature requires Javascript. Click on a formula to zoom.
Abstract
Residues of hazardous substances, such as chemical compounds with low vapor pressure, radioactive particles, or biological contamination can remain on surfaces for a prolonged period of time. The fate of these particles partially depends on the aerodynamic resuspension rates from the surfaces that are a function of particle and surface properties as well as the environmental conditions. The aerodynamic resuspension can be used for non-contact surface sampling. The removal rates of microscopic explosive trimethylenetrinitramine (RDX) particles from smooth glass surfaces in a controlled flow environment are investigated in this paper. The shear stress in the flow cell is calculated using computational fluid dynamics as a function of velocity. The RDX particle samples are prepared by dry transfer. Particle sizes and morphologies are measured by 3D scanning electron microscopy (SEM) and optical profilometry. The resuspension rates are calculated based on the changes in the total coverage area before and after exposure to aerodynamic forces. These rates are correlated with wall shear stresses, particle size, and morphology. For non-spherical particles, the removal rates are proportional to the particle shape factor defined as a ratio of particle height to the projected equivalent diameter.
Copyright © 2019 American Association for Aerosol Research
1. Introduction
Chemical, Biological, Radiological, Nuclear, and Explosive (CBRNE) events result in population exposure to harmful particulate matter (PM). The fate of PM such as dust and residues determines long-term population exposure. The delayed hazard is linked to the re-aerosolization activity of the post-event particles and residual contamination on the scene (Alavi et al. Citation2011; Halasz et al. Citation2002) which have the potential to be hazardous to people for a prolonged time period. Recent reviews (Boor, Siegel, and Novoselac Citation2013; Gradoń Citation2009; Henry and Minier Citation2014; Ziskind Citation2006) emphasize the crucial role of resuspension for many processes like sediment dynamics (Coleman and Nikora Citation2008), dust resuspension (Kok et al. Citation2012; Tsai and Chiou Citation1999), resuspension of airborne particles (Hu et al. Citation2008; Kim et al. Citation2010), biological contamination (Du et al. Citation2013; Johnson, Li, and Assemi Citation2007), and forensics (Keedy et al. Citation2012; Phares et al. Citation2000). The resuspension process can take place in various conditions/environments, and the multidisciplinary aspect of this phenomena makes it challenging to study it from a theoretical, numerical and experimental point of view. In addition to CBRNE contamination, non-contact surface sampling has received interest for the detection of trace explosives and illicit materials, as this method allows for rapid sampling of large surfaces compared to traditional swabbing methods (Ariessohn and Novosselov 2012 Krasnobaev and Bunker Citation2005; Novosselov et al. 2013; Syage and Hanold Citation2008). In conventional trace particle collection and analysis methods (referred to as the “swab test”) the surface of interest is sampled with swab material and analyzed ex-situ using a benchtop instrument. In non-contact aerodynamic sampling, particles are liberated from the surface by a drag force acting on the particle in the flow boundary layer and collected for analysis or analyzed in their aerosol state (Phares et al. Citation2000; Smedley, Phares, and Flagan Citation1999). This method could provide several advantages in operation and collection repeatability; however, a comprehensive understanding of particle/surface interaction in the aerodynamic system is poorly understood due to the difficulty in characterizing particle morphologies, surface properties, and environmental conditions on their resuspension rates.
The particles are resuspended from the surface by a combination of lift and drag forces acting on the particle in the boundary layer. Several authors (e.g., Fillingham et al. Citation2019; Phares et al. Citation2000; Phares, Smedley, and Flagan Citation2000) have investigated particle resuspension as a function of flow properties in the vicinity of the particle. Typically, size-controlled microspheres are used as surrogates as their regularity is conducive to experimental and numerical investigations. Several efforts describe the use of engineered particles for use as standards for trace explosive particles. Fletcher et al. (Citation2008b) presented a methodology for fabricating polymer microspheres using inkjet printing containing high explosives for use as detector calibration standards. Phares et al. (Citation2000) studied the captured polystyrene spheres laced with 2,4,6-trinitrotoluene (TNT). Fletcher et al. (Citation2008a) examined the removal of fluorescent polystyrene spheres by air jets from polycarbonate filters and muslin cloth surfaces. The fluorescence of polystyrene spheres aided their identification on the surfaces. It is challenging to determine the inception mechanism for resuspension of particles with complex shapes. Rabinovich and Kalman (Citation2009) investigated the incipient motion associated with resuspension of various spherical (zirconium, glass, iron, and alumina) and non-spherical particles (plastic, sand, and salt); their analysis developed the power-law relationships of non-dimensional groups of Reynolds and Archimedes numbers showing that non-spherical particles are harder to remove than spheres. The power-law expressions are different from ones reported for silica microspheres (Fillingham et al. Citation2019) partially due to the difference in particle size and sample preparation. The adhesion of organic explosive residues have been studied by Chaffee-Cipich, Sturtevant, and Beaudoin (Citation2013), Yu et al. (Citation2017), and Zakon et al. (Citation2012), these studies have shown that adhesion force of explosive residues, including RDX, is significantly greater than of surrogate particles of the same size.
Existing literature addresses lift vs. drag forces requirements for aerodynamic spherical particle resuspension. Hubbe (Citation1984) has demonstrated that the effect of an aerodynamic force acting parallel to the wall is greater than the normal force; thus the lift detachment mechanism for removal may be neglected. Sharma et al. (Citation1992) have demonstrated that in the hydrodynamic scenario the particle detachment mechanism for spherical glass and polystyrene particles in size range of 5 µm to 40 µm is indeed rolling and not sliding or lifting mechanisms. Numerical modeling of the forces acting on the spherical particle (Fillingham et al. Citation2019) shows that the contribution of lift force is an order of magnitude lower than drag force (which contributes to sliding or rolling); however, these conclusions may not apply to the particles with high contact length.
The reaerosolization of explosive residues is described only in a few peer-reviewed studies (e.g., Keedy et al. Citation2012). These studies compared aerodynamic resuspension of polystyrene microspheres and trace explosive particles by varying the jet properties of the impinging jet. The process is complicated due to irregular particle shapes (Verkouteren Citation2007), so the effect of particle morphology in aerodynamic resuspension needs further investigation.
A particle under shear flow experiences aerodynamic drag and lift forces, which may result in particle detachment from the surface. The force and moment balance acting on the particle depends on system properties that are difficult to estimate. shows a model of a particle on a smooth surface in shear flow; particle dimensions are denoted as long cord (L), short cord (I), and height (S). The forces considered in the moment balance are the adhesion force (Fad), the gravitational force (), the drag force (
), and the lift force (Fl). Particle detachment depends on the relationship between these forces, the contact radius (
), and several other factors, such as the distance between the applied force and the surface (h), the surface roughness (
), the particle-surface charges, and the environmental factors. In this work, the effect of the surface roughness, electrostatic forces and relative humidity (RH) are neglected as all experiments are performed at RH < 10% levels. Angle of airflow will likely impact resuspension as it defined the spread of aerodynamic forces on the surface. In the case of impinging flow, jet angle, stand-off, and nozzle parameters will likely impact particle resuspension as these variables determine the properties of wall jet and thus the wall stresses (Fillingham, Murali and Novosselov Citation2017; Murali Citation2016).
Figure 1. For spherical particles, all the three dimensions (S, I, and, L) are equal. The long dimension is aligned with the flow direction in this diagram. For irregular particles, the dimensions vary depending on their orientation, elongation, and sphericity.
Wall shear stress (τw) has been linked to aerodynamic particle removal, as it is proportional to the velocity gradient at the wall; it is convenient for characterizing flow independent of particle size. Smedley, Phares, and Flagan (Citation1999) and Phares, Smedley, and Flagan (Citation2000) used a normally-impinging axisymmetric air jet to quantify the removal rates of monodisperse particles. The shear velocity, related to shear stress, is also used to define resuspension (Ibrahim, Dunn, and Qazi Citation2008; Taheri and Bragg Citation1992). The uncertainties of impact-induced resuspension caused by particle rolling or otherwise traveling along the surface can be mitigated by studying only the leading edge of particle deposition (Braaten Citation1994; Ibrahim and Dunn Citation2006; Ibrahim, Dunn, and Brach Citation2003, Citation2004). Young, Hargather, and Settles (Citation2013) used a sparse particle deposition, wherein particles interacted with the applied aerodynamic shear stress independent of other particles and concluded that removal efficiency becomes independent of particle separation distance for a distance greater than 10 particle diameters. Keedy et al. (Citation2012) characterized the aerodynamic wall shear stress required for resuspension efficiency for trace explosives from a smooth glass surface. However, the study did not account for the shear stress distribution from the surface, which varies significantly with particle location (Fillingham, Murali and Novosselov Citation2017).
In summary, two observations can be made with respect to the state-of-the-art in the aerodynamic resuspension. First, the majority of studies investigate the resuspension of model particles in various environmental scenarios. Most experiments have been performed in uniform wind-tunnel-like flows where the aerodynamic shear stress can be quantified. The thresholds for resuspension of irregular shape trace explosive particle have not been quantified. Second, though some information about the shape of trace explosives particle has been presented (e.g., Verkouteren Citation2007), the aerodynamic resuspension studies do not typically consider 3D particle morphology. The projected area is typically used to characterize the particle size, ignoring z-dimension which is important as it determines the frontal area of the particle and its aerodynamic drag.
This paper presents an analysis of resuspension of non-spherical RDX particles in an aerodynamic flow cell. Wall shear stresses are calculated using numerical simulations. Particle morphologies are evaluated using optical and scanning electron microscopy. Particle dimensions and their shape factors are related to resuspension rates as a function of shear stress.
2. Experimental methods
2.1. Flow cell design
shows an aerodynamic flow cell used in this work. The flow cell is 3D printed using PolyLactic Acid filament (PLA). The geometry consists of a cylindrical inlet, a transitional section, and the rectangular test section. The inlet section has an inner diameter of 7 mm and a length of 15 mm; the contraction section has a length of 45 mm, the height of the channel is 1 mm. Standard 25 × 75 mm glass slides (Sigma-Aldrich, St. Louis, MO) were used. The average roughness of the glass slides is measured using a contact profilometer (Marsurf XR20, Mahr GmbH, Germany), the detailed analysis is presented in the SI section S.3. The test particles were deposited on the lower glass slide. The upper glass slide acts as a wall and provided access for microscopic visualization.
Figure 2. The aerodynamic flow cell used to interrogate the removal rates of RDX particles.
shows a schematic of the experimental setup. The compressed filtered air provides flow for the experiments. The flow rate is controlled by a needle valve and monitored by a digital flow meter (TopTrak 820, Sierra Instruments, Inc., Monterey, CA, USA). The pressure at the inlet of the flow cell is measured with a precision gauge (DPGAB-04, Dwyer Instruments, Inc., Michigan City, IN, USA), these measurements are used as the input for the computational fluid dynamics (CFD) simulation used to calculate the shear stress. The relative humidity in the experiment is measured by the RH meter, typically below 5%. At the beginning of each experiment creeping flow (at ∼10% of the experimental flow rate) is used to dehumidify the system for 3–4 min. This step is required as the dry air removes moisture in the setup without removing particles. Each test is conducted until the particle removal reaches maximum for a given condition. In a preliminary study, we found that the removal efficiency stopped increasing after flow exposure of 30 s. Before each experiment, all parts of the flow cell are cleaned with methanol and dried with pressurized air to minimize the introduction of stray particles into the experiments.
Figure 3. The aerodynamic flow cell setup for studying the removal rates from a glass surface. Removal rates are evaluated microscopically.
2.2. Sample preparation
For consistent sample preparation, the dry transfer protocol (Chamberlain Citation2002) is used. A 1000 µg/mL solution of RDX in a 50/50 mixture of acetonitrile/methanol solvent (M83330-05, AccuStandard, Inc, New Haven, CT, USA) is used. A 10 µL drop of the standard solution is deposited on a 20 mm × 20 mm Teflon Strip (300LSE, 3M, Inc., Maplewood, MN, USA). The Teflon strips are then stored in a desiccator for 24 h before the formed crystals are transferred onto the test surface by swiping with the applied force of ∼7kN. Using this protocol, large crystals of RDX are generated on the Teflon, which fragments into smaller particles (1–100 µm) during the transfer procedure.
2.3. Microscopic analysis
2.3.1. Optical microscopy
The removal efficiency of particles is evaluated microscopically by imaging the sample area (leading edge) before and after each test. The images were taken using an Olympus BX 60 microscope with 20× long focal length objective fitted with a digital camera (OptixCam Summit D3K2) at 14 MP resolution using the ToupCam software. Multiple regions of ∼2 × 2 mm are recorded and stitched together using an image analysis software (Structure, iMicrotech Inc., Brooklyn, NY, USA). Birefringence of RDX crystals (McCrone Citation1950) is used to distinguish RDX from other particles that may have been deposited on the surfaces. RDX particles are measured and sorted into 1-micron size bins. A total of about 100 experiments are performed, and approximately 3600 particle removal events are observed. The particles smaller than 5 µm are found to cluster on the substrate due to agglomeration during the deposition or due to fractionation of the larger particles. The analysis of these particles presents a challenge for the imaging software resulting in higher standard deviations in their size distribution and the resuspension analysis.
2.3.2. Scanning electron microscopy
The complex morphology of the trace explosive particles presents a challenge for modeling the forces acting on the particle. Several studies (Chaffee-Cipich, Sturtevant, and Beaudoin Citation2013; Oxley et al. Citation2016; Xu et al. Citation2015; Yu et al. Citation2017; Zakon et al. Citation2012) used atomic force microscopy (AFM), optical profilometer and scanning electron microscopy (SEM) to study morphology and evaluate the adhesion of various energetic materials. Though these studies provide valuable insight on the adhesion properties of different energetic materials like RDX, Trinitrotoluene (TNT) and others, they do not account for morphological variability of the particles. In the aerodynamic resuspension, the height of the particle is especially important as it determines the drag force acting on the particle. In the current work, the height is evaluated by 3D electron micrographs taken using an FEI Sirion XL30 (FEI, Hillsboro, OR, USA). Samples of RDX are dry deposited on to thin micro cover glass (72230-01, Electron Microscopy Science, Hatfield, PA, USA) using the dry transfer protocol. The sample is then sputter-coated with gold at 9 mA for 60 s (13 nm deposition) before the SEM observations. Angled electron micrographs are taken at every 15 degrees to evaluate the vertical dimension of the particles. The height is quantified by measuring the change in the visible area at different imaging angles. The magnification is adjusted to provide sufficient resolution to minimize sizing uncertainty.
The 2D equivalent diameter of the particle is evaluated by binary thresholding using a MATLAB code in the top down imaging. A geometric 3D reconstruction algorithm (Kapur and Casasent Citation2000) evaluates the error based on magnification and corrects the height measurement accordingly. Size-controlled microspheres (440345, Sigma-Aldrich) are used to calibrate the algorithm. Based on ten repeated measurements of the microspheres, the method yielded an accuracy of ± 0.5 µm. The sizing errors for explosive particles were evaluated based on 25 measurements and are within ± 10% for particles greater than 8 µm and are within ± 40% for particles smaller than 8 µm.
3. Results and discussion
3.1. Morphological analysis – shape factor
SEM analysis shows that that the RDX particles deposited by dry transfer protocol on the glass surface can be consistently classified based on their 2D equivalent diameters. See . Particles smaller than 10 µm are found to be spheroidal or parabolic ellipsoids in shape. As the size increases, the particles become more elongated and can be represented by ellipsoids. The majority of particles >30 µm, based on their 2D projected areas, have flattened shape, i.e., platelets or flakes. These particles appear to have a large contact area making them harder to dislodge from the surface. It is likely that both types of particles (below 10 µm and greater than 30 µm) are artifacts of a sample preparation procedure and are not present in the real world scenarios. For example, analysis of the C4 residues in fingerprints indicates the prevalence of particles in a 20-micron size range (Verkouteren, Coleman, and Cho Citation2010), particles of similar size and morphology have also been reported in gunshot residues (Wolten et al. Citation1979) and post-blast explosive residues (Abdul-Karim et al. Citation2016). Our analysis of particles in 10–25 µm size range show similarity with particles in the previous reports; these particles are compact and often can be represented as elongated ellipsoids.
Figure 4. The morphology of RDX particles, the images are taken at tilt-angle of 45 degrees. Smaller particles are harder to resolve as they agglomerate. Smaller particles are close to spheroidal shape, and particles greater than 30 microns resemble platelets or flakes.
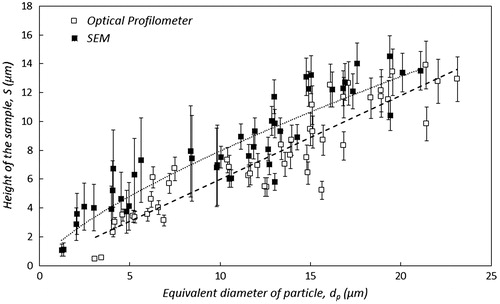
To quantify particle morphology, 3D shape factor is used. In aerodynamic resuspension scenario, the balance of moments acting on particles highly depends on the height of the particle as it is used for drag force calculation and the moment of the drag force (Dominik and Tielens Citation1995). The height estimation cannot be performed by a 2D analysis without the assumption of the particle shape. Using SEM, we characterize the height (S), maximum (L), and minimum (I) chord lengths for 50 representative particles. Optical profilometry (VK-X250, Keyence Corporation, Itasca, IL, USA) with the submicrometer lateral resolution is used to confirm the height measurements for similarly prepared samples; these measurements cannot be used to evaluate the morphology of the particle near the surface. Thus, the method is only used to validate the height measurement obtained by the angled SEM method. shows the comparison of particle heights calculated using both techniques. Glass microsphere calibration shows particle diameter to be equal to the height for both techniques. The height of RDX particles in the 10–25 µm region increases with their equivalent 2D diameter. The SEM data is in good agreement with the profilometer measurements.
Figure 5. The comparison of RDX particle height measured using an SEM and an optical profilometer. Glass microspheres are used for calibration. The method of calculating height from the SEM micrographs shows good correlation with measurements from the optical profilometer.
To characterize the morphology of the RDX particles, we define the shape factor parameter as the ratio of the height of the particle to the square root of the product of the maximum and minimum chord length associated with the particle. This definition is also commonly referred to as Corey Shape Factor (McNown and Malaika Citation1950).
(1)
(1)
where S is height, L is the long chord dimension, and and I is the short chord dimension.
plots the circularity and the shape factor for RDX particles that have been dry deposited on a glass surface. A total of about 3300 particles are optically evaluated, and circularity is computed using optical microscopy. The projected areas are equated to their perimeters to evaluate the circularity as shown in EquationEquation (2)(2)
(2) .
(2)
(2)
where A is the projected area of the particle and P is the perimeter of the particle.
Figure 6. Morphology of RDX particle generated by dry deposition on the glass surface evaluated using (a) circularity via optical microscopy and (b) CSF from SEM: as the particle size increases, the shape factor of RDX particle decreases, the particle height remains nearly constant, and the particle projected area increases.
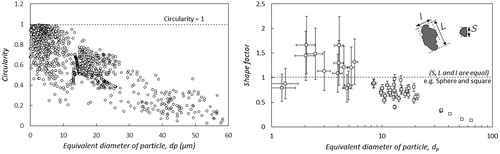
The high-resolution images are taken to reduce the errors caused by the low pixel density of the particle. Shape factor is calculated for about 50 individual particles using angled SEM. Particles smaller than 8 µm are found to be either agglomerated or closely deposited next to each other. The errors associated with their sizes are ∼40%. These particles are approaching spherical shape (CSF∼1). Particles in the 8–25 µm range transition from prolate to oblate ellipsoids (S> CSF
For particles with a 2D equivalent diameter >30 µm, the shape factor reduces, and the height of the particle remains relatively constant as the equivalent diameter increases. Particles greater than 50 µm appear as flakes and are observed to fractionate under the aerodynamic forces.
The size and shape of the particle determine the force and momentum balance acting on the particle during the aerodynamic resuspension (see ). Though the threshold values for the removal mechanism have previously been proposed (Henry and Minier Citation2014; Hubbe Citation1984; Sharma et al. Citation1992), the relations of flow properties to the resuspension of trace explosive residues have not been investigated in detail. In the current work, we analyzed residues in terms of (i) the total projected area coverage (PAC) distribution as a function of particle equivalent diameter and (ii) particle mass distribution estimated from the particle shape factor and equivalent diameter. shows the normalized PAC and mass distribution plotted against the equivalent diameters of RDX particles from optical microscopy measurements. In PAC analysis, two-dimensional cross-sections or projections are measured using optical microscopy. The particles are sorted into 1 µm bins. The product of particle frequencies in each bin and their measured area are taken as the PAC value in the probability density plot for each bin; these are shown as open triangles. Two methods are used to estimate the normalized particle volume (mass) distribution: (i) directly from the individual 3D SEM (solid squares), and (ii) from PAC measurement normalized by the average shape factor of particles in that size bin (PAC X SF), shown as open squares. Both methods estimate particle volume; the mass can be calculated assuming the nominal RDX density of 1.82 g/cm3. This approach differs from the previous studies where particle shapes were approximated as predetermined, i.e., conical, spherical, cylindrical or some geometric shapes (Verkouteren, Coleman, and Cho Citation2010). The limited number of particles accessible for 3D SEM imaging (n∼50) introduce statistical error; however, the trends for direct 3D SEM analysis and the shape factor normalized PAC calculations are in good agreement for particles in the 10–25 µm size range.
Figure 7. Normalized distributions of particles by projected area coverage – primary axis and mass (volume) – secondary axis. The particle mass is calculated from 3D SEM measurements and by PAC measurements normalized by the shape factor.
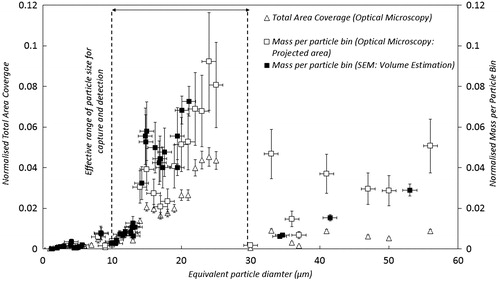
The RDX residue particles in the 10–25 micron size range have a similar shape to the trace explosive particles in the fingerprint laden with trace explosive particles. The frequency of these particles in the dry transfer method is fairly high. The total mass fraction of particles in the 10–25 micron range is ∼ 15–30%, the entire size range is 1–100 micron as shown in . Particles smaller than 10 microns are relatively abundant and difficult to quantify unless high magnification microscopy is used. However, their total PAC and mass in the dry transfer deposition are very low. Particles greater than 30 microns have a low profile and a large contact area. For the evaluation of particle resuspension trends, we evaluate the particles in the entire size spectrum.
3.2. Experimental results – effect of shape on removal efficiency
The removal efficiency was determined by optical microscopy as the ratio of the PAC before and after 60 s of exposure to a constant velocity (shear stress) values. shows that the removal efficiency increases with the shape factor. This is not surprising, as the greater ratio of particle height to contact length (h/a) results in the greater ratio of drag force to adhesion force in the particle force balance. The sample preparation and deposition method used in this study yielded a maximum particle height ∼18m. For flake-like (platelet) particles the contact area that determine the adhesion force is significantly larger than the frontal area that is related to the drag force. In the first approximation, for two particles with the same PAC (same contact area thus same adhesion force), the particle with the greater height experiences greater drag force. In general, the drag force can be determined as a combination of a pressure difference across the particle and shear force on the surface of the particle. (O'Neill Citation1968) showed that for a spherical microparticle in a viscous shear flow, a modified Stokes law could be used to describe the drag force,
where
is the fluid viscosity, and
is the fluid velocity at the center of the particle. The constant 1.7009 is determined from an exact solution to account for the boundary layer velocity profile. As particle diameter increases the Vc increases based on the boundary layer development resulting in non-linear trend in particle resuspension. Though both analytical and numerical solutions for simple shapes can be developed, the drag force analysis is significantly more difficult for particles with complex morphology as the assumptions about the particle shape and orientation are required.
Figure 8. Removal of RDX particles as a function of the average shape factor in each 1 micron bin. As the shape factor increases, the size of the particle decreases, and the average removal efficiency increases. Particles with CSF > 1 are found to aggregate and breakdown is observed, but the contribution is not significant.
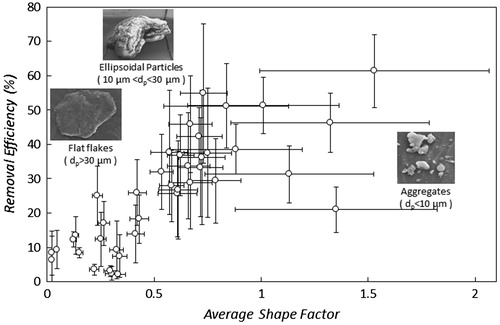
In the current study, the particles smaller than 10 µm have a shape factor ∼1; however, the sample preparation resulted in aggregation of the particles smaller than 10 µm. These aggregates were observed to break down under shear stress making it difficult to obtain reliable data; thus this behavior was not quantified. The data for particles greater 10 µm, show that for non-spherical particles, the removal rates increase with the particle shape factor, i.e., directly proportional to the particle height or inversely proportional to the particle projected area.
3.3. Experimental results – determining the critical shear stress for particle detachment
From the practical perspective of aerodynamic sampling and the analysis of the fate of trace explosive particles on the surfaces, the morphology of larger flake-like particles from dry deposition method does not agree with the published data related to fingerprint or post-blast residues. In an analysis of removal threshold, we consider only particles in the 10–25 µm size range. These particles exhibited similar morphology to fingerprint residues and did not form significant aggregates. Formation of “new” aggregates after the exposure to flow was not observed, likely due to low deposition density, thus lower particle collision rate, and the effect of lift force acting on the resuspended particles in the flow cell. Saltation and creep mechanisms that could have contributed to the particle aggregation were observed only for a small fraction of particles (not quantified here). Limiting the study to the leading edge deposition region minimizes the effect of the particle transport and their redeposition from the upstream location.
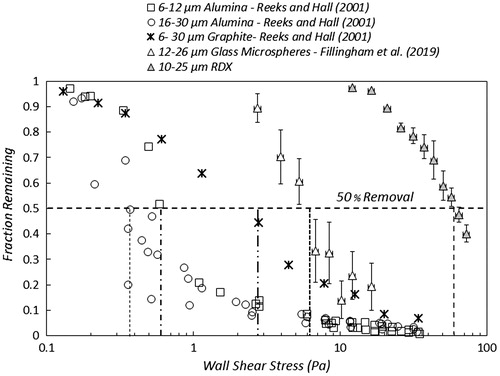
The complex particle morphology and ambiguity about interface boundary conditions present significant challenges in the modeling of the particle-surface-flow interaction; however, some experimental data exits in the literature. Reeks and Hall (Citation2001) documented resuspension of spherical alumina particles (6–30 µm) and irregular graphite particles (6–30 µm) from a polished stainless-steel plate. Later (Goldasteh, Ahmadi, and Ferro Citation2012) use their data to extend the “bumpy particle” model (Ahmadi and Guo Citation2007; Soltani and Ahmadi Citation1999) by accounting for randomness associated with irregular particle shape and surface roughness. compares the resuspension of 6–30 µm graphite particles and alumina spheres (Reeks and Hall Citation2001) with our flowcell experiments including 10–25 µm RDX particles and 12–26 µm soda lime microspheres (Fillingham et al. Citation2019). The data are compared on wall shear stress basis assuming air density at standard pressure and temperature (ρair = 1.225 kg/m^3). There are obvious differences between the particles and the surface types investigated here and in the previous reports, the experimental procedure is also significantly different: (i) the exposure in our experiments is 60 s while the data from Reeks and Hall (Citation2001) is collected after 1 s exposure; based on our observations, the difference in exposure flow may not be significant, (ii) more important is that in both the current study and the results (Fillingham et al. Citation2019), the particles were aged on the surface for 24 h. The aging procedure results in particle deformation yielding greater contact area, thus the greater removal force requirements (Kottapalli Citation2017). For both experimental setups, the removal of the irregular particles requires greater shear stress. The removal threshold of the organic RDX residue requires ∼30× greater shear stress that of the irregular graphite particles ().
Figure 9. Comparison of aerodynamic resuspension of irregular particles: 10–25 µm particles of RDX, glass microsphere (Fillingham et al. Citation2019) from and 6–30 µm graphite and alumina particles (Reeks and Hall Citation2001). The RDX residues more than an order of magnitude greater shear stress for 50% removal in comparison to irregular graphite particles.
Numerical simulations were performed to determine the wall shear stress in the flow cell as a function of the inlet boundary conditions. The CFD study covers the flow rates (velocity) up to 50% threshold for RDX particle resuspension. The key results are: (i) shear stress values are nearly uniform in the test region and are a function of the flow rate in the cell; (ii) Re = 4000–7000 (the range of study) corresponds to the transition to turbulence region (White Citation1986), thus the transient Detached Eddy Simulation (DES) was chosen. The laminar sublayer is modeled using the Shear Stress Transport (SST) k-ω turbulence model (Menter Citation1994, Citation1993). A non-dimensional wall distance of defines the viscous sublayer, which thickness in the similarity coordinates is typically assigned to To resolve the flow in the viscous sublayer, we use at least three cells within this region, with the first grid point located at a distance of
1. The computational domain mesh consists of quadrilateral elements. The typical height of an element near the wall of the flow cell surface is about 4 microns. The calculation methodology is detailed in the SI section S.1.
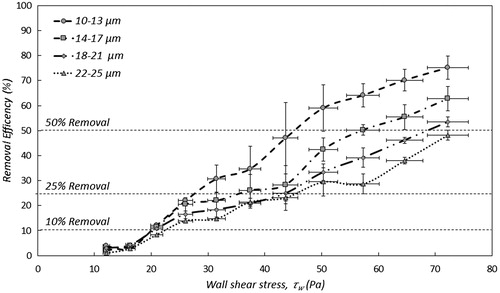
shows the removal efficiency of particles plotted against the wall shear stress. The RDX particles in the 10–25 µm range (equivalent diameter) are split into 4 bins to obtain sufficient statistics for each size bin. Three removal thresholds are plotted: 10%, 25%, and 50%. For example, the shear stress required for 50% removal for particles in the 0–13 size bin is ∼45 Pa; for 22–25 µm particles is ∼70Pa. The horizontal error bar is calculated by using the average numerical deviation caused by a change in boundary conditions for numerical simulation, which is determined by the experiments. The likely reason for the increased threshold for larger particles is their increasing contact area with the substrate. The limitation of the current flow cell setup is apparent in the limited range of the shear stresses. These values can be increased with flow cell modification or by using the impinging jet setup as previously reported (Fillingham, Murali and Novosselov Citation2017; Phares, Smedley, and Flagan Citation2000; Tu and Wood Citation1996).
Figure 10. Removal efficiency of RDX particles from the smooth glass slide as a function of wall shear stress. The particles are sorted into 4 µm bins to provide sufficient statistical information. The average number of particles in each bin is Navg = 483 and the minimum Nmin = 398.
Wall shear stress values are a convenient parameter for characterizing the flow boundary layer independently of particle size and morphology. shows the critical wall shear stress associated with RDX particle detachment from the glass slide vs. the size of the particle and the comparison with the removal threshold of the soda lime microspheres from (Fillingham et al. Citation2019)
Figure 11. The critical wall shear stress required for 50% removal of RDX particles dry transferred onto a glass slide and silica microspheres deposited by gravitational settling on a glass slide. The for RDX particles is proportional to dP0.61 while it is proportional to dP−0.58 for silica microspheres.
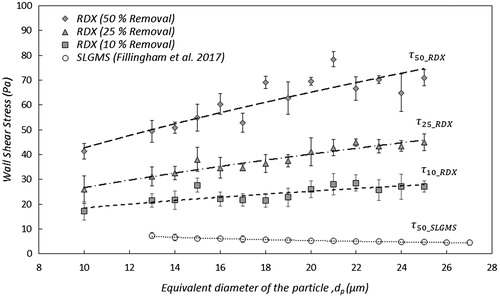
For microspheres, the threshold shear stress required for resuspension decreases as particle diameter increases. When a perfect sphere is exposed to aerodynamic drag, the force is proportional to the dp2 while the contact length (and thus the adhesion force) is proportional to dp. Thus, the larger particles are resuspended at lower shear stress. Other second order effects make this relationship non-linear. In the case of a non-spherical particle, such as an RDX residue particle, the trend is more complicated. The required shear stress for particle removal increases with the projected particle diameter. This can be attributed to a more rapid increase in the contact length than the height of the ellipsoid-like particles. EquationEquations (3)–(6) show the empirical relationships of critical shear stress for different thresholds for soda lime glass microspheres and RDX particles from the smooth glass surface in Pascals as a function of the particle diameter in micrometers.
(3)
(3)
(4)
(4)
(5)
(5)
(6)
(6)
4. Conclusions
In this work, we investigate the morphology and removal of RDX particles from a smooth glass surface using controlled aerodynamic particle detachment experiments. Morphological analysis of RDX particles by 3D SEM imaging is used to determine the particle shape. In the dry transfer deposition, the shape of the particles varies from spheroidal to ellipsoidal to platelets and flakes as the particle size increases. Particles in the 10–25 µm size range have a similar shape to the reported trace explosive particle residues. The average height to projected area diameter ratio for dry transferred RDX particles in the 10–25 micron range is ∼0.6. RDX particles are harder to remove in comparison to the glass microspheres. The best fit shows that the critical wall shear stress for 10%, 25%, and 50% removal of RDX particles is proportional to respectively. Unlike for the microspheres, the threshold wall shear stress for RDX removal increases with an increase in the diameter of the particle. This trend can be explained by (i) a larger contact area, thus the adhesion forces (ii) greater contact length in the moment balance, (iii) in transition to sliding vs. the removal of the rolling mechanism. The effects of surface and particle properties, relative humidity, and electrostatic attraction are not investigated but are likely to play a significant role in particle resuspension. This work can be used as baseline for future resuspension studies, designs of practical systems, and model validation studies.
Supplemental data for this article can be accessed on the publisher's website.
Download PDF (706.3 KB)Additional information
Funding
Related Research Data
References
- Abdul-Karim, N., C. S. Blackman, P. P. Gill, R. M. Morgan, L. Matjacic, R. Webb, and W. H. Ng. 2016. Morphological variations of explosive residue particles and implications for understanding detonation mechanisms. Anal. Chem. 88 (7):3899. doi:10.1021/acs.analchem.6b00080.
- Ahmadi, G., and S. Guo. 2007. Bumpy particle adhesion and removal in turbulent flows including electrostatic and capillary forces. J. Adhes. 83 (3):289–311. doi:10.1080/00218460701239174.
- Alavi, G., M. Chung, J. Lichwa, M. D’alessio, and C. Ray. 2011. The fate and transport of RDX, HMX, TNT and DNT in the volcanic soils of Hawaii: A laboratory and modeling study. J. Hazard. Mater. 185 (2-3):1600–1604. doi:10.1016/j.jhazmat.2010.10.039.
- Ariessohn, P. C., and I. V. Novosselov. 2012. Aerosol collection apparatus and methods. US Patent 8539840, 09/24/2013. https://patents.google.com/patent/US8539840B2/en
- Boor, B. E., J. A. Siegel, and A. Novoselac. 2013. Monolayer and multilayer particle deposits on hard surfaces: Literature review and implications for particle resuspension in the indoor environment. Aerosol Sci. Technol. 47 (8):831–847. doi:10.1080/02786826.2013.794928.
- Braaten, D. A. 1994. Wind tunnel experiments of large particle reentrainment-deposition and development of large particle scaling parameters. Aerosol Sci. Technol. 21 (2):157–169. doi:10.1080/02786829408959705.
- Chaffee-Cipich, M. N., B. D. Sturtevant, and S. P. Beaudoin. 2013. Adhesion of explosives. Anal. Chem. 85 (11):5358. doi:10.1021/ac302758n.
- Chamberlain, R. T. 2002. Dry transfer method for the preparation of explosives test samples: Google Patents. US Patent 6470730B1. https://patents.google.com/patent/US6470730B1/en
- Coleman, S. E., and V. I. Nikora. 2008. A unifying framework for particle entrainment. Water Resour. Res. 44. Article W04415. doi:10.1029/2007WR006363.
- Dominik, C., and A. G. G. M. Tielens. 1995. Resistance to rolling in the adhesive contact of two elastic spheres. Philos. Mag. A 72 (3):783–803. doi:10.1080/01418619508243800.
- Du, Y., C. Shen, H. Zhang, and Y. Huang. 2013. Effects of flow velocity and nonionic surfactant on colloid straining in saturated porous media under unfavorable conditions. Transp. Porous Media 98 (1):193–208. doi:10.1007/s11242-013-0140-3.
- Fillingham, P., H. Murali, and I. V. Novosselov. 2017. Nondimensional parameter for characterization of wall shear stress from underexpanded axisymmetric impinging jets. J. Fluids Eng. 139 (11):111102. doi:10.1115/1.4037035.
- Fillingham, P., X. Zhan, K. Kottapalli, and I. V. Novosselov. 2019. Characterization of adhesion force in aerodynamic particle resuspension. J. Aerosol Sci. 128:89–98. doi:10.1016/j.jaerosci.2018.11.006.
- Fletcher, R., N. Briggs, E. Ferguson, and G. Gillen. 2008a. Measurements of air jet removal efficiencies of spherical particles from cloth and planar surfaces. Aerosol Sci. Technol. 42 (12):1052–1061. doi:10.1080/02786820802402237.
- Fletcher, R. A., J. A. Brazin, M. E. Staymates, B. A. Benner, and J. G. Gillen. 2008b. Fabrication of polymer microsphere particle standards containing trace explosives using an oil/water emulsion solvent extraction piezoelectric printing process. Talanta 76 (4):949–955. doi:10.1016/j.talanta.2008.04.066.
- Goldasteh, I., G. Ahmadi, and A. Ferro. 2012. A model for removal of compact, rough, irregularly shaped particles from surfaces in turbulent flows. J. Adhes. 88 (9):766–786. doi:10.1080/00218464.2012.694278.
- Gradoń, L. 2009. Resuspension of particles from surfaces: Technological, environmental and pharmaceutical aspects. Adv. Powder Technol. 20 (1):17–28. doi:10.1016/j.apt.2008.10.009.
- Halasz, A., C. Groom, E. Zhou, L. Paquet, C. Beaulieu, S. Deschamps, A. Corriveau, S. Thiboutot, G. Ampleman, C. Dubois, and J. Hawari. 2002. Detection of explosives and their degradation products in soil environments. J. Chromatogr. A 963 (1-2):411–418. doi:10.1016/S0021-9673(02)00553-8.
- Henry, C., and J.-P. Minier. 2014. Progress in particle resuspension from rough surfaces by turbulent flows. Prog. Energy Combust. Sci. 45:1–53. doi: 10.1016/j.pecs.2014.06.001.
- Hu, B., J. D. Freihaut, W. P. Bahnfleth, and B. Thran. 2008. Measurements and factorial analysis of micron-sized particle adhesion force to indoor flooring materials by electrostatic detachment method. Aerosol Sci. Technol. 42(7):513–520. doi:10.1080/02786820802209129.
- Hubbe, M. A. 1984. Theory of detachment of colloidal particles from flat surfaces exposed to flow. Colloids Surf. 12:151–178. doi:10.1016/0166-6622(84)80096-7.
- Ibrahim, A. H., and P. F. Dunn. 2006. Effects of temporal flow acceleration on the detachment of microparticles from surfaces. J. Aerosol Sci. 37(10):1258–1266. doi:10.1016/j.jaerosci.2006.01.007.
- Ibrahim, A. H., P. F. Dunn, and R. M. Brach. 2003. Microparticle detachment from surfaces exposed to turbulent air flow: Controlled experiments and modeling. J. Aerosol Sci. 34 (6):765–782. doi:10.1016/S0021-8502(03)00031-4.
- Ibrahim, A. H., P. F. Dunn, and R. M. Brach. 2004. Microparticle detachment from surfaces exposed to turbulent air flow: Effects of flow and particle deposition characteristics. J. Aerosol Sci. 35 (7):805–821. doi:10.1016/j.jaerosci.2004.01.002.
- Ibrahim, A. H., P. F. Dunn, and M. F. Qazi. 2008. Experiments and validation of a model for microparticle detachment from a surface by turbulent air flow. J. Aerosol Sci. 39 (8):645–656. doi:10.1016/j.jaerosci.2008.03.006.
- Johnson, W. P., X. Li, and S. Assemi. 2007. Deposition and re-entrainment dynamics of microbes and non-biological colloids during non-perturbed transport in porous media in the presence of an energy barrier to deposition. Adv. Water Resour. 30 (6-7):1432–1454. doi:10.1016/j.advwatres.2006.05.020.
- Kapur, J. P., and D. P. Casasent. 2000. Geometric correction of SEM images. Proc. SPIE 4044, Hybrid Image and Signal Processing VII, (17 July 2000), AEROSENSE 2000, Orlando, FL, USA, April 24–28.
- Keedy, R., E. Dengler, P. Ariessohn, I. Novosselov, and A. Aliseda. 2012. Removal rates of explosive particles from a surface by impingement of a gas jet. Aerosol Sci. Technol. 46 (2):148–155. doi:10.1080/02786826.2011.616920.
- Kim, Y., A. Gidwani, B. E. Wyslouzil, and C. W. Sohn. 2010. Source term models for fine particle resuspension from indoor surfaces. Build. Environ. 45 (8):1854–1865. doi:10.1016/j.buildenv.2010.02.016.
- Kok, J. F., E. J. R. Parteli, T. I. Michaels, and D. B. Karam. 2012. The physics of wind-blown sand and dust. Rep. Progr. Phys. 75 (10):106901. doi:10.1088/0034-4885/75/10/106901.
- Kottapalli, K. 2017. Aerodynamic removal and characterization of particulate trace residues on model surfaces: University of Washington Libraries. https://digital.lib.washington.edu/researchworks/handle/1773/40642.
- Krasnobaev, L. Y., and S. N. Bunker. 2005. Virtual wall gas sampling for an ion mobility spectrometer: Google Patents. US Patent 20040155181. https://patents.google.com/patent/US20040155181
- McCrone, W. C. 1950. Crystallographic data. 32. Rdx (cyclotrimethylenetrinitramine). Anal. Chem. 22 (7):954–955. doi:10.1021/ac60043a040.
- McNown, J. S., and J. Malaika. 1950. Effects of particle shape on settling velocity at low Reynolds numbers. Trans. Am. Geophys. Union 31 (1):74–82. doi:10.1029/TR031i001p00074.
- Menter, F. R. 1994. Two-equation eddy-viscosity turbulence models for engineering applications. AIAA J. 32 (8):1598. doi:10.2514/3.12149.
- Menter, F. R. 1993. Zonal two equation kappa-omega turbulence models for aerodynamic flows. 23rd Fluid Dynamics, Plasmadynamics, and Lasers Conference, Fluid Dynamics and Co-located Conferences. NASA-TM-111629: Sponsoring organization. NASA Ames Research Center.
- Murali, H. 2016. Characterization of wall shear stress of underexpanded impinging jets. M.S. Thesis. Novosselov, I. V., J. Riley, U. Shumlak, eds. ProQuest Dissertations Publishing. http://hdl.handle.net/1773/38054
- Novosselov, I. V., P. C. Ariessohn, E. D. Dengler, and M. Hickner. 2012. Particle interrogation devices and methods: Google Patents. US Patent 8539840. https://patents.google.com/patent/US8539840B2/en
- O'Neill, M. E. 1968. A sphere in contact with a plane wall in a slow linear shear flow. Chem. Eng. Sci. 23:1293–1298. doi:10.1016/0009-2509(68)89039-6.
- Oxley, J. C., J. L. Smith, G. L. Kagan, G. Zhang, and D. S. Swanson. 2016. Energetic material/polymer interaction studied by atomic force microscopy. Propellants Explos. Pyrotech. 41 (4):623–628. doi:10.1002/prep.201500161.
- Phares, D. J., J. K. Holt, G. T. Smedley, and R. C. Flagan. 2000. Method for characterization of adhesion properties of trace explosives in fingerprints and fingerprint simulations. J. Forensic Sci. 45:774–784. doi.
- Phares, D. J., G. T. Smedley, and R. C. Flagan. 2000. The wall shear stress produced by the normal impingement of a jet on a flat surface. J. Fluid Mech. 418:351–375. doi:10.1017/S002211200000121X.
- Rabinovich, E., and H. Kalman. 2009. Incipient motion of individual particles in horizontal particle–fluid systems: A. Experimental analysis. Powder Technol. 192 (3):318–325. doi:10.1016/j.powtec.2009.01.013.
- Reeks, M. W., and D. Hall. 2001. Kinetic models for particle resuspension in turbulent flows: Theory and measurement. J. Aerosol Sci. 32 (1):1–31. doi:10.1016/S0021-8502(00)00063-X.
- Sharma, M. M., H. Chamoun, D. S. H. S. R. Sarma, and R. S. Schechter. 1992. Factors controlling the hydrodynamic detachment of particles from surfaces. J. Colloid Interface Sci. 149 (1):121–134. doi:10.1016/0021-9797(92)90398-6.
- Smedley, G. T., D. J. Phares, and R. C. Flagan. 1999. Entrainment of fine particles from surfaces by gas jets impinging at normal incidence. Exp. Fluids 26 (4):324–334. doi:10.1007/s003480050295.
- Soltani, M., and G. Ahmadi. 1999. Detachment of rough particles with electrostatic attraction from surfaces in turbulent flows. J. Adhes. Sci. Technol. 13 (3):325–355. doi:10.1163/156856199X00668.
- Syage, J. A., and K. A. Hanold. 2008. Multiple trace portal detection systems: Google Patents. US Patent US20060196249. https://patents.google.com/patent/US20060196249
- Taheri, M., and G. M. Bragg. 1992. A study of particle resuspension in a turbulent flow using a preston tube. Aerosol Sci. Technol. 16 (1):15–20. doi:10.1080/02786829208959534.
- Tsai, C.-J., and S.-F. Chiou. 1999. Measurement of emission factor of road dust in a wind tunnel. J. Aerosol Sci. 30:S227–S228. doi:10.1016/S0021-8502(99)80125-6.
- Tu, C. V., and D. H. Wood. 1996. Wall pressure and shear stress measurements beneath an impinging jet. Exp. Therm. Fluid Sci. 13 (4):364–373. doi:10.1016/S0894-1777(96)00093-3.
- Verkouteren, J. R. 2007. Particle characteristics of trace high explosives: RDX and PETN. J. Forensic Sci. 52 (2):335–340. doi:10.1111/j.1556-4029.2006.00354.x.
- Verkouteren, J. R., J. L. Coleman, and I. Cho. 2010. Automated mapping of explosives particles in composition c‐4 fingerprints. J. Forensic Sci. 55 (2):334–340. doi:10.1111/j.1556-4029.2009.01272.x.
- White, F. M. 1986. Fluid mechanics. New York, N.Y: McGraw Hill.
- Wolten, G., R. Nesbitt, A. Calloway, G. Loper, and P. Jones. 1979. Particle analysis for the detection of gunshot residue. I: Scanning electron microscopy/energy dispersive x-ray characterization of hand deposits from firing. J. Forensic Sci. 24:409–422. doi:10.1520/JFS10848J.
- Xu, X., J. Mares, L. J. Groven, S. F. Son, R. G. Reifenberger, and A. Raman. 2015. Nanoscale characterization of mock explosive materials using advanced atomic force microscopy methods. J. Energ. Mater. 33 (1):51–65. doi:10.1080/07370652.2014.889780.
- Young, R. M., M. J. Hargather, and G. S. Settles. 2013. Shear stress and particle removal measurements of a round turbulent air jet impinging normally upon a planar wall. J. Aerosol Sci. 62:15–25. doi:10.1016/j.jaerosci.2013.04.002.
- Yu, H., T. Becker, N. Nic Daeid, and S. Lewis. 2017. Fundamental studies of the adhesion of explosives to textile and non-textile surfaces. Forensic Sci. Int. 273:88–95. doi:10.1016/j.forsciint.2017.02.008.
- Zakon, Y., N. G. Lemcoff, A. Marmur, and Y. Zeiri. 2012. Adhesion of standard explosive particles to model surfaces. J. Phys. Chem. C 116 (43):22815–22822. doi:10.1021/jp303622n.
- Ziskind, G. 2006. Particle resuspension from surfaces: Revisited and re-evaluated. Rev. Chem. Eng. 22 (1-2):1–123. doi:10.1515/REVCE.2006.22.1-2.1.