
 ?Mathematical formulae have been encoded as MathML and are displayed in this HTML version using MathJax in order to improve their display. Uncheck the box to turn MathJax off. This feature requires Javascript. Click on a formula to zoom.
Abstract
The Spider differential mobility analyzer (DMA) is a novel, miniaturized radial DMA developed to provide size classification in the 10–500 nm range for applications requiring high portability and time resolution. Its external dimensions are ∼12 cm in diameter by 6 cm in height (excluding tubing); it weighs ∼350 g, and is designed to operate at 0.6–1.5 L/min sheath and 0.3 L/min sample flowrates. It features a new sample inlet geometry that is designed to produce a uniform azimuthal particle distribution at the entrance of the classifier, optimized sample/sheath flow streams introduction in the classifier to minimize particle delays, and extension of the electric field interaction volume for ∼30% enhanced dynamic range. Based on three-dimensional finite element simulations of flows, electric fields, and particle trajectories, we demonstrate that the Spider DMA transfer functions can be predicted with high fidelity using a parameterized fit based on the Stolzenburg semi-analytical model. Experimental characterization of the instrument response with size-selected particles confirmed close agreement with model prediction; mobility size response is linear over three orders of magnitude in mobility span. Electrical ground shielding of the external surfaces of the DMA has been found to be necessary to avoid particle losses associated with field effects as the high voltage operating limit is approached. The mean deviation between the reference size of polystyrene latex spheres and the Spider DMA measurement is less than 2%, corroborating its high sizing precision and potential for high quality size distribution measurements.
Copyright © 2019 American Association for Aerosol Research
EDITOR:
Introduction
Differential mobility classification is arguably one of the most widespread measurement methods in the field of aerosol science and technology, being used both in the production of calibration aerosols, and in size distribution measurements of submicron particles (Flagan Citation1998). A differential mobility analyzer (DMA) separates charged particles in a gas according to their migration velocities, in the presence of an applied electric field of strength,
The ratio of these quantities is the particle electrical mobility,
:
(1)
(1)
where
is particle charge (expressed as multiples of the elementary charge, i.e.,
),
is the gas dynamic viscosity,
is the mobility-equivalent particle diameter, and
is the Cunningham slip correction factor. Hence, for a known particle charge state, particle size can be deduced by measuring particle mobility.
The most commonly used mobility analyzer is the cylindrical DMA based on the design of Knutson and Whitby (Citation1975), in which mobility classification takes place in an axial flow and applied electric field in the annulus between two co-axial cylindrical electrodes. New cylindrical DMA designs have emerged in recent years (Chen et al. Citation1998; Heim et al. Citation2004; Rosell-Llompart et al. Citation1996; Winklmayr et al. Citation1991), while alternate designs employ parallel disk electrodes, i.e., radial DMAs (RDMAs; Brunelli, Flagan, and Giapis Citation2009; Fissan et al. Citation1996, Citation1998; Zhang et al. Citation1995), and rectangular planar electrodes (Santos et al. Citation2009). Most of these developments focused on increasing the DMA resolution, or extending the sizing range to smaller sizes, down to 1 nm in diameter. Because the limit of the DMA resolution is proportional to the ratio of the sheath flow to the aerosol flow, the resulting instruments have increasingly been large, costly, and complex.
While these instruments have served the needs for measurements of fundamental aerosol properties in the laboratory, they became impractical for many field measurements and health effect studies. Climate studies are becoming increasingly reliant on unmanned aerial vehicles, which have the potential to provide valuable assessment of particle concentrations aloft, and in inaccessible locations, yet need more portable instruments than are now available. Community health studies require dense networks that are presently not feasible owing to the size, and costs of present instruments. Although surrogate measurements by optical sensors are being used to estimate PM2.5 exposure from measurements of only the largest () particles in this size range, the quality of the data they produce is questionable, and degrades with time in use (Johnson et al. Citation2018). Moreover, even perfect PM2.5 measuring devices provide limited insight into the dose that an individual may receive, since many inhaled particles do not deposit in the airways, but, rather, are exhaled back into the air. Quantitative evaluation of human exposures to ambient particles, as well as unraveling the effects of atmospheric aerosols on clouds and climate, require portable instruments of known, verifiable precision and accuracy.
In response to growing demand for instrument portability, a number of recent studies have focused on the development of more compact and lightweight DMAs (Kulkarni, Qi, and Fukushima Citation2016; Liu and Chen Citation2016; Ranjan and Dhaniyala Citation2007, Citation2008; Steer et al. Citation2014). Barmpounis et al. (Citation2016) developed an ultra-lightweight cylindrical DMA (150 g) by employing low-density polymers coated with a thin metallic film to provide electric conductivity to the electrode surfaces. Portable mobility spectrometers that have been commercialized include the Nano-scan 3910 (TSI Inc., Shoreview, MN, USA; Tritscher et al. Citation2013) and the Portable Aerosol Mobility Spectrometer (Kanomax Inc., Andover, NJ, USA; Kulkarni, Qi, and Fukushima Citation2016). These classifiers have been designed for low-flow operation to reduce size and power requirements, but this limits precision due to low counting statistics, and/or time resolution (i.e., the time needed to complete a size distribution measurement), a critical issue in airborne particle size distribution measurements.
In this study, we describe the “Spider DMA,” a novel, miniaturized RDMA, from its design using finite element simulations through its experimental characterization testing in stepping-mode voltage operation. The design optimizes instrument volume, weight, and power consumption, while maintaining sufficient counting statistics and time resolution for rapid size distribution measurements in order to enable the high spatial and temporal resolution required for deployment in moving platforms, such as remotely piloted aircrafts, drones, tethered balloons, or ground vehicles.
Materials and methods
Instrument design
Design criteria
The design criteria for the DMA are classification capacity in the 10–500 nm particle size range, compact size, lightweight construction, and low power consumption. The radial flow design offers an inherently compact and simple construction, in which classification takes place in an inward, radial flow between two parallel disk electrodes (Zhang et al. Citation1995). Aerosol is introduced near the outer radius of the ground electrode, and those particles of the selected electrical mobility migrate across the sheath flow and exit at the center of the high voltage electrode. In steady-state operation, the DMA classifies particles within a narrow mobility range that is determined by the instrument geometry and operating parameters. For ideal radial DMAs, in which the flows are strictly parallel to the electrodes, the mobility with the highest transmission probability, is given by
(2)
(2)
where
is the RDMA sheath flowrate,
is the excess flowrate,
is the spacing between high voltage and ground electrodes,
is the applied voltage, and
and
are the radii of the classifier inlet and outlet, respectively (Zhang et al. Citation1995).
An inherent design limitation in classification of larger, less mobile particles is that the electric field strength, must be held low enough to avoid electrostatic breakdown of the air, which occurs at about 3 kV/mm for dry air and sea-level pressures; however, this limit may be lower at high relative humidity, or lower air pressure, or may be triggered by non-idealities (“hotspots”) in the actual electric field. To avoid electrostatic breakdown, DMAs are typically operated to a maximum field strength of 1 kV/mm, which is also the case in our design. For flight operation, the maximum field strength may need to be adjusted as altitude or humidity change. Thus, DMAs that extend into the larger particle size range are typically large.
Another factor that influences DMA size is the precision with which the DMA can resolve small differences in mobility. The resolution of a DMA is defined as the ratio of the mobility of particles transmitted with the highest efficiency to the full range of mobilities of particles transmitted at the half of that peak efficiency. In the absence of diffusion, and for balanced flows,Footnote1 the ideal DMA resolution is determined by the flow ratio:
(3)
(3)
where
and
are the aerosol inlet and classified sample flowrates, respectively.
While a resolution of 10 is employed for many fundamental and calibration studies, the nature and dynamics of ambient size distributions can often be captured at lower resolution. According to EquationEquations (2)(2)
(2) and Equation(3)
(3)
(3) , lowering the operating resolution at a given sample flow allows the RDMA radius or operating voltage to be reduced while maintaining the particle count rate. In systems combing a DMA with a particle counter for size distribution measurements, the aerosol flowrate in the classifier is typically equal to the counter sample flowrate. The design sample flowrate for our combined system, which consists of the Spider DMA and the Aerosol Dynamics Inc. “MAGIC” water CPC (Hering et al. Citation2019; Hering, Spielman, and Lewis Citation2014), is 0.3 L/min; this flowrate is sufficient to provide adequate counting statistics over the particle size range for which this instrument is designed. The reduction in size will reduce the residence time and enable fast scans when operated as a scanning electrical mobility spectrometer (which will be the topic of a future paper). Given this sample flowrate, and a target resolution in the range of 2–5, the required sheath flowrate is in the 0.6–1.5 L/min range.
Radial flow mobility classification
shows an axisymmetric section-cut view of the Spider DMA classification region. Polydisperse aerosol particles enter the classifier from its outer radius through a narrow, 1 mm annular slot at ground potential. The sheath-air flow is introduced in direct opposition to the particle flow, which results in a stagnation surface that separates the two flows that minimizes flow perturbations. The two flows impinge on one another within an annular gap of about 1 mm height and 1 mm width, thereby minimizing delays associated with the formation of boundary layers near the confining walls of the instrument. To ensure good separation of the incoming sheath and aerosol flows, and to maintain laminar flow, the flows enter the classification region through an aerodynamic diffuser that also comprises a dielectric spacer between the high voltage and ground electrodes. To avoid accumulation of particle charge on the diffuser surface, a dielectric material with electrostatic dissipative properties (Semitron® ESd 225 Acetal, Professional Plastics Inc., Fullerton, CA, USA, surface resistivity of ∼5 × 10⁹ Ω/square) is employed.
Figure 1. Schematic of the Spider DMA classification region, shown in axisymmetric section cut view.
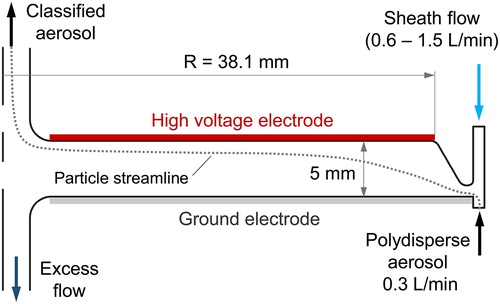
Downstream of the diffuser, the aerosol and sheath flows enter the main part of the classifier that consists of a 38.1 mm radius high voltage electrode disk, positioned at 5 mm distance from its ground potential counterpart. The resulting classification region volume is approximately 22.8 cm3, which yields a mean residence time of ∼1.0 s for 1.0 L/min sheath and 0.3 L/min sample flowrates. Based on the selected electrode spacing, the maximum operating voltage of the DMA is 5000 V. As they are advected in a radially inward direction, charged particles drift across the gap between the electrodes; those within a narrow range of mobilities reach the classifier outlet at the center of the counter (high voltage) electrode illustrated with a dashed line in .
In order to maximize the dynamic sizing range within the classifier volume, the Spider DMA classification region differs substantially from that of the original RDMA of Zhang et al. (Citation1995). Zhang et al. (Citation1995) not only introduced particles at a larger radius than in the present instrument, but also exposed them to only a fraction of the available electrostatic field. The present design employs particle-field interaction in the entire classification volume, while utilizing enhanced field strength in the entrance of the classification region. The effect of the field in this area, where particle velocities are the lowest, is particularly important, allowing a relatively longer time for electrophoretic migration that extends the sizing range of the instrument.
Inlet flow distribution
To attain the resolution and transmission efficiency of an ideal DMA, the sheath and aerosol sample flows must attain a uniform azimuthal distribution around the classifier entrance. The challenge in this requirement is to transition the relatively high flow velocity in the introduction port, which is typically a 6 mm or ¼ inch tube, into a substantially slower and radially uniform flow around the classifier entrance.
The first attempt in designing the Spider DMA inlet was a tangential entrance approach. This was first introduced in the cylindrical “Vienna DMA” design of Winklmayr et al. (Citation1991), and was later utilized in several radial flow mobility analyzers (Brunelli, Flagan, and Giapis Citation2009; Mui et al. Citation2013; Zhang et al. Citation1995). In this, the inlet flow is introduced tangentially into a “racetrack” that supplies the sample to the classifier entrance through a narrow gap that provides the pressure drop necessary for uniform azimuthal distribution. While the tangential inlet proved to be reasonably successful in former DMA designs, its application to the Spider DMA would have been problematic since the low flowrates would require a racetrack with extremely narrow dimensions to achieve sufficient pressure drop to attain an azimuthally uniform flow distribution. An example of the resulting flow maldistribution in the present classifier with a tangential inlet is provided in Figure S1 in the online supplemental information (SI). Moreover, a tangential inlet would be associated with long time delays for incoming particles to be distributed around the classifier entrance. This would result to broad distributions of residence times in the classifier, which hinders its applicability in a fast-scanning size distribution measuring system.
To overcome these limitations, the sample flow is distributed through a series of gradual pressure drop steps across the inlet geometry (). The sample is supplied through a 6.35 mm tube port that is offset from the center of the classifier, and parallel to the excess flow port. A first order distribution is realized by splitting the flow into narrow curved channels on the back-side of the ground electrode; these “spider” channels direct the flow toward eight, radially symmetric, points in the perimeter of the classifier. The channels are divided into two sets of four, with paths that are symmetric about the normal plane that connects the center of the sample inlet port with the center of the classifier. Uniform distribution requires equal pressure drop across these channels, which can be approximately achieved with gently curved channels of equal length and cross-section area. The latter has been designed such that the mean flow velocity in each channel is equal to the mean velocity of the upstream (combined) flow. In the initial design that is reported here, the lengths of the flow channels are equal.
Figure 2. (a) Schematic of the Spider DMA, demonstrating key design features and assembly parts in “exploded” section-cut view. (b) Spider DMA prototype fabricated at Caltech by conventional CNC machining.
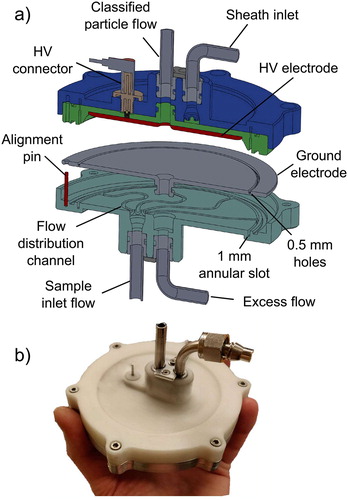
The outlets of the “spider” channels are connected to a downstream 1 mm-wide annular slot that provides the next pressure drop step in the sample flow path toward the classifier entrance. Yet another pressure drop is required to further distribute the flow in the annular slot around the azimuth between the channel outlets. This is provided by an array of 0.5 mm holes through the base of the 1 mm annular slot to form the classification region entrance. The spacing between the holes has been designed to tune the pressure drop in order to attain azimuthal symmetry of the flow velocity in the classifier entrance. A similar approach was followed for the distribution of the sheath flow. Figure S2 in the SI provides a detailed view of the actual sample flow distribution channels and holes spacing design.
A prototype Spider DMA was fabricated by conventional CNC machining as shown in . Its exterior dimensions are approximately 12 cm in diameter and 6 cm in height (excluding tubing). Using a combination of materials including aluminum, plastic, and stainless steel, the assembled DMA weighs approximately 350 g. For comparison, a benchtop DMA column with a similar sizing range weighs approximately 5 kg.
Finite element modeling
Instrument design and optimization was performed using finite element modeling (FEM) of the flows, electric field, and particle trajectories, using COMSOL Multiphysics® (version 5.3). FEM partitions a relatively complex geometry into small and simple “finite” elements, where physics problems can be solved numerically. Tetrahedral finite elements with size in the 0.13–1.9 mm range were employed for meshing the DMA three-dimensional (3D) geometry, resulting in a total number of 6.3 × 10⁵ elements for the fluid geometry alone. The element density was varied to attain better resolution at narrow regions, such as near the vicinity of the classification entrance slot and 0.5 mm holes array. Mesh-independence was verified by running the flow simulation using a mesh with even finer elements (0.109–1.67 mm), which yielded nearly identical results with the selected mesh settings. The “Laminar flow” and “Electric currents” modules in COMSOL Multiphysics® were used to solve the Navier-Stokes and Maxwell equations for steady-state flow and electric fields in the 3D space. Particle motion within the resulting fields was simulated as a transient study using the “Particle trajectories” module, assuming massless particles. In this, particle motion is calculated based on the drag and electrostatic forces acting on the particles, as well as the effect of Brownian motion. Each simulation employed 10,000 particles to attain good counting statistics, while a solver time step of 10 ms was found to be sufficient for reproducible results in reasonable computation times. Simulations with higher particle numbers (up to 50,000) and shorter time steps (down to 2 ms) were performed to validate the numerical resolution. The default tolerance (0.1% relative error) was used as a convergence criterion to solve the flow and electric fields. A 0.1% absolute tolerance was set in the transient particle motion study.
Analytical modeling
Instrument response function and data analysis
Simulations were performed for a range of particle sizes at constant classifier voltage to determine the probability that particles of a given mobility will be transmitted at each of those voltages, where
is calculated using EquationEquation (2)
(2)
(2) .Footnote2 Because the flows within the Spider DMA are not strictly parallel to the electrodes, we anticipate some deviation from this estimate for a highly idealized DMA geometry (Mai and Flagan Citation2018). It will prove convenient to use the theoretical model of the classifier transfer function that was derived by Stolzenburg (Citation1988; see also R. C. Flagan Citation1999) to incorporate
into the data analysis process. We include below only a brief synopsis of the analytical expressions describing the DMA transfer functions, with additional detail available in the references provided above as well as in Stolzenburg and McMurry (Citation2008) and Stolzenburg (Citation2018).
The diffusive transfer function for the DMA, in non-dimensional form can be expressed as:
(4)
(4)
where ε is a function defined as:
(5)
(5)
with
representing the error function,
is the dimensionless particle mobility
(6)
(6)
with
the centroid mobility defined in EquationEquation (2)
(2)
(2) ,
and
are dimensionless flow parameters defined as:
(7)
(7)
(8)
(8)
and
is the dimensionless diffusional broadening parameter, which for radial DMA geometry is given by:
(9)
(9)
In the above equation, is a non-dimensional geometry factor, which for the design considered in the miniature radial DMA, laminar flow profiles, and 0.9/0.3 L/min flowrates for the sheath/sample streams, takes a value of
denotes the dimensionless migration Péclet number, which is defined as the ratio of the flux due to electrophoretic migration to that due to diffusion. For particle motion in the electrostatic field of a DMA, the migration Péclet number is given by:
(10)
(10)
where
is particle charge,
is the electric potential,
is the Boltzmann constant,
is the absolute temperature, and
for radial DMAs. For ambient temperature, and singly charged particles, EquationEquation (10)
(10)
(10) reduces to only a function of the DMA voltage:
(11)
(11)
Fitting parameters to the Stolzenburg transfer function
In order to fit the Stolzenburg theoretical transfer function to either simulated or experimental data, we introduce three fitting parameters
to account for discrepancies from predicted values in terms of transmission efficiency, mobility at peak transmission, and transfer function width, respectively.
and
are multiplicative factors to the ideal transmission probability (i.e.,
) and normalized particle mobility (i.e.,
),Footnote3 and
is an additive parameter for the transfer function broadening due to non-idealities such as flow distortions:
(12)
(12)
The resulting formulation of the transfer function employed for the fitting is:
(13)
(13)
In this study, we have employed EquationEquation (13)(13)
(13) to fit transfer function data from finite element simulations of particle trajectories in the Spider DMA geometry. The fit was performed by weighted least-squares minimization, using as weight the square root of the absolute number of simulated particles to account for Poisson statistics errors.
Instrument response modeling
In steady-state electrode voltage operation, the number of particles transmitted through the Spider DMA is
(14)
(14)
where
indicates the aerosol sample flowrate,
the counting interval,
the mobility number distribution upstream the Spider DMA,
the respective charge probability distribution, and
the predicted transfer function defined in EquationEquation (13)
(13)
(13) . In experimental evaluation of the DMA response, the challenge quasi-monodisperse aerosol is typically generated by passing a polydisperse aerosol through a reference mobility analyzer. Assigning
as the known transfer function of the reference mobility analyzer at a dimensionless mobility
the ratio of the downstream over upstream particle number is:
(15)
(15)
To a good approximation, the source size distribution and charging probability can be considered as constants over the narrow width of the DMA transfer functions, which simplifies EquationEquation (15)(15)
(15) to:
(16)
(16)
Experimental
Highly monodisperse particles in the 15–400 nm size range were generated in a tandem DMA setup to measure the Spider DMA response to particle size. In this process, a source of polydisperse aerosol was generated by atomizing dilute solutions of either NaCl or (NH4)2SO4. The solution droplets were passed through a NafionTM-based drying column to produce water-free aerosol samples. The aerosol then passed a bipolar charge conditioner to attain a steady-state distribution of charges. The aerosol was classified with a TSI 3081 long DMA column (LDMA) to provide a source of positively-charged, narrow mobility range particles to the Spider DMA. The LDMA was operated at several steady-state electrode voltages, with sheath flowrate in the 5–21 L/min range, and nominal sizing resolution equal to or higher than 16. Since the Spider DMA mobility resolution was only 2–4, the input particles represent a nearly mono-mobility aerosol source. Aerosol counts upstream and downstream of the Spider DMA were measured with Aerosol Dynamics Inc. “MAGIC” water CPCs operating in parallel at 0.3 L/min flowrates. Sampling line lengths were kept as short as possible to minimize particle losses. The upstream aerosol concentration was maintained within 2000–6000 cm−3 to provide good counting statistics while minimizing coincidence errors in the CPC. The Spider DMA response to particle size was measured by setting an input particle mobility in the LDMA, and stepping the Spider DMA through at least 14 steady-state electrode voltages, spaced logarithmically about the voltage at the peak transmission efficiency.
In addition to size-selected particles, the Spider DMA response was evaluated using polystyrene latex spheres (PSL) as traceable particle size standards. PSL aerosols were generated by atomizing dilute solutions of PSL in distilled water, followed by drying and charge conditioning. The resulting PSL aerosols were directly sampled through the Spider DMA as it was stepped through voltages to quantify the transfer function with the reference particles. Testing was performed with 152 ± 3 nm and 303 ± 6 nm PSL particles, with 0.75, 0.90, and 1.20 L/min DMA sheath flowrates, and a 0.3 L/min sample flowrate.
Results and discussion
Design optimization through modeling
Inlet sample flow distribution
shows the simulated performance of the inlet sample flow distribution channels based on finite element modeling of flows and particle trajectories for a single release of 200 nm particles into the entrance of the inlet tube for a 0.3 L/min flowrate. shows an excerpt of the particle simulation 0.15 s after their initial release at the inlet entrance. At this instant, particles with initial positions near the center of the upstream inlet flow have reached about halfway through the curved, “spider”, channels. Due to the velocity profile during laminar flow through the channels, particles near the walls move at lower velocities than those in the core of the channel flow and, therefore lag behind those in the center.
Figure 3. (a) Excerpt of a transient particle simulation, demonstrating distribution of the main inlet particle flow into eight, equal length, “spider” channels. The colorbar indicates the velocities of 200 nm particles for a 0.3 L/min inlet flow. (b) Bias in the sample flow distribution, and 50% particle appearance time at the outlet of each distribution channel. Bias calculated as percent deviation from respective mean values.
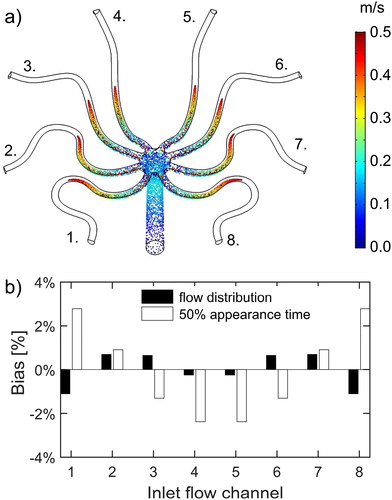
To evaluate the performance of the inlet geometry, we calculate the sample distribution and 50% particle appearance time at the outlet of each channel. Sample distribution is evaluated as the number of particles transmitted at the channel outlets, normalized by the total inlet particle number. Since uniformity in distribution is the primary criterion, results are plotted as percent biases with respect to the corresponding mean values across the channels (). The simulation demonstrates that the sample distribution is very good overall, with maximum deviations from the mean within ±1%. In terms of particle time delays, the bias in the 50% appearance time at the outlet of the channels remains within ±3%. In practice, particles reach the channel outlets almost simultaneously, with delays between channel responses in the order of a few milliseconds. Achieving a uniform distribution of particle time delays around the classifier entrance becomes important for measuring highly transient aerosol samples.
Classifier entrance optimization
The design of the classifier entrance was optimized through 3-dimensional modeling of the flow field and particle trajectories. First, the classifier was modeled assuming a geometry consisting of the “spider” flow distribution channels combined with a 1 mm-wide annular slot as the classifier entrance. Second, the classifier entrance was modeled as a 1 mm annular slot coupled with a circular array of 0.5 mm holes. The spacing of the holes around the perimeter of the classifier entrance was optimized based on the simulation results to achieve a satisfactory azimuthal symmetry in the flow distribution. Finally, the idealized case was modeled as reference, assuming ideal azimuthal symmetry in the classifier entrance.
compares the simulated performance between these geometry configurations. To reduce computational time, only 1/8 of the geometry was simulated, assuming radial symmetry in the classifier. The simulation is performed as a single release of 200 nm particles into the entrance of the classification region (i.e., downstream of the annular slot), for 0.9/0.3 L/min sheath/aerosol flows. Initial particle velocities were set to be equal to the resulting 3-dimensional flow field velocities in each geometry configuration. Particle trajectories in the classification region were simulated by applying a steady-state electric field with strength corresponding to this at the highest particle transmission.
Figure 4. (a) 3D simulation of particle motion in the classifier (top view of 1/8 symmetric geometry), with a 1 mm annular slot as the classifier entrance (inlet geometry “1”). Contours demonstrate “snapshots” of the transient particle simulation at indicated elapsed times since initial release. The simulation was run as single release of 200 nm particles into the entrance of the classification region, at steady-state electric field and 0.3/0.9 L/min sample/sheath flows. (b) Same as (a), with an additional array of 0.5 mm holes (inset detail view) positioned at the outlet of the 1 mm slot (inlet geometry “2”). (c) The aerosol flow velocity distribution at the classifier entrance as a function of azimuth from the center of the flow channel, and (d) Particle transmission probability at the classifier outlet as a function of time elapsed since particle release, for geometries “1” and “2.” The ideal aerosol flow distribution and particle transmission are depicted with dashed lines.
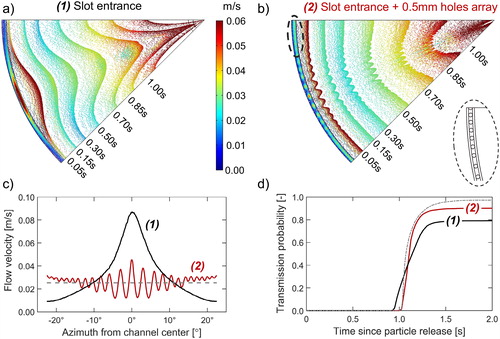
The top panels in show “snapshots” of particles in the classifier after their initial release for the two entrance geometries discussed above. The contours correspond to particles at different simulation times, while color indicates particle velocities. In the slot entrance case (), more flow enters the classification region near the middle of the geometry than at the edge of the simulated regions. The resulting high velocity of the center produces a wave-like particle transmission toward the classifier outlet. Coupling the slot entrance with the array of holes produces a much more uniform particle transmission through the classifier (). The differences between these two simulations arise from the distribution of the flow around the classifier entrance (). The pressure drop through the continuous annular slot is too small to attain the desired azimuthal uniformity. Instead, most of the flow exits from the annular slot near that port at the center of the segment of the slot. For the design flow rates, adequate pressure drop was attained by replacing the continuous slot entrance with small (0.5 mm diameter) holes distributed around the annular entrance, and by varying the spacing of the holes with distance from the terminus of the “spider” leg to account for pressure drop in the annular channel. Because the spacing of the holes is larger at the center of the slice than at its edges, we see oscillations in the initial velocity there, but the average flow velocity approaches the ideal uniformity (dashed line in ). There remain some small deviations that will be addressed in the next generation instrument. The time at which particles are transmitted into the classified aerosol outlet flow approaches a fixed delay for the latter design. While this is not an issue for the present stepping-mode operation, it will be critical for voltage-scanning-mode measurements.
The performance of the two entrance geometry designs for scanning-mode operation was evaluated by calculating the particle transmission probability at the outlet of the classifier as a function of time since particle release into the entrance of the classification region. The results shown in reveal that the array of holes represents a substantial improvement over the ‘slot entrance’ geometry, in terms of both the particle transmission efficiency and the time response. The time response is similar to that of the ideal azimuthal flow distribution, but particle transmission is approximately 8% lower. The apparent reduction in the transmission efficiency results from the non-ideal azimuthal distribution of, primarily, the sheath flow. To quantify the magnitude of this effect, we introduce the non-dimensional parameter where
is the sheath flowrate as a function of the azimuth,
across the classifier entrance slot, and
is the nominal sheath flowrate. Given that the sheath flowrate is directly proportional to the peak classified mobility (EquationEquation (2)
(2)
(2) ),
can be expressed as
(17)
(17)
suggesting that a non-symmetric sheath flow generates a distribution of effective peak particle mobilities,
around the azimuth of the classifier entrance.
shows the variation of with azimuth from the “spider” channel center, and the corresponding transmission probability with varying sizing resolution, for a 0.9 L/min Spider DMA sheath flowrate. High transmission efficiency is attained only at azimuths where
is near unity; deviation from this ideal results in an increasingly lower “apparent” transmission. The effect is more pronounced as the instrument is operated at higher resolution, owing to the increasingly narrower width of the transfer function. The resulting decrease in the apparent transmission efficiency compromises the Spider DMA resolving power, as the full-width-at-half-maximum of the peak mobility increases.
Figure 5. (a) Variation of with azimuth,
from the center of the DMA “spider” channel, and corresponding “apparent” transmission probability with varying DMA sizing resolution, R. (b) Contours of the Spider DMA transmission probability as a function of the normalized particle mobility,
and
based on the
distribution shown in panel (a), for DMA resolution R = 3.
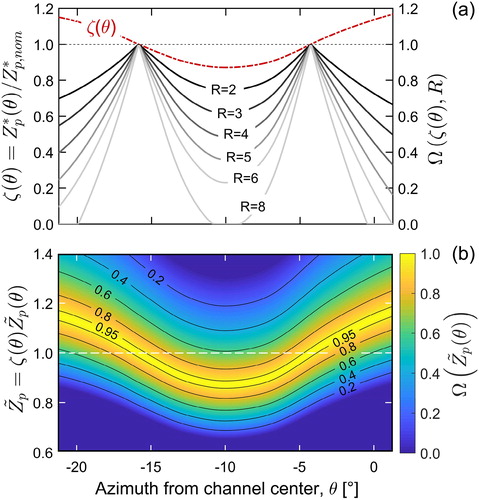
shows the contours of the DMA transmission probability arising from the non-ideal shown in , as the normalized particle mobility
Footnote4 varies in the 0.6–1.4 range, for a constant sizing resolution R = 3. As
varies, the transmission probability isopleths qualitatively follow the azimuthal variation of
with the corresponding peak transmission appearing at different azimuths around the classifier entrance. It has to be noted, though, that this analysis presents a “worst-case” scenario; owing to the additional pressure drop within the classification region, potential flow variations at the classifier entrance become progressively less pronounced, thus the overall degradation in the DMA performance is expected to be smaller. This is corroborated by the results shown in , where the Spider DMA transmission efficiency reaches approximately 92%, whereas the corresponding mean transmission predicted in is only about 74%.
Mobility classification modeling and parameterization
Transfer function
The classifier transfer function was derived from detailed 3-dimensional finite element simulations of particle motion within the flow and electric field in the instrument. The classifier voltage was set at a constant value, that corresponds to a theoretical peak particle mobility,
the transmission efficiency at the classifier outlet was calculated for a range of input particle mobilities distributed around
This procedure was repeated for several steady-state classifier voltages,
in order to derive the instrument transfer function across the operating range of the instrument. Since the simulated input particles are truly monodisperse, this method enables a direct evaluation of the transfer function. Contrary to simulations shown in , particles here were released upstream of the annular slot, i.e., into the inlet of the curved distribution channels, in order to account for wall deposition losses across the instrument geometry.
Two simulated transfer functions are shown in . These represent cases near the limit of significant (20 nm - ) and negligible (200 nm - ) diffusional broadening. The simulated data have been fit to the theoretical, Stolzenburg transfer function by employing three fitting parameters,
and
that account for deviations in transmission efficiency, peak mobility, and transfer function width, respectively (EquationEquation (13)
(13)
(13) ).
Figure 6. Spider DMA transfer function at 0.3/0.9 L/min sample/sheath flowrates for (a) and (b)
Symbols show finite element simulation data results. Solid lines demonstrate fits to the simulation data based on the Stolzenburg transfer function with
and
fitting parameters for transmission efficiency, mobility offset, and transfer function width, respectively.
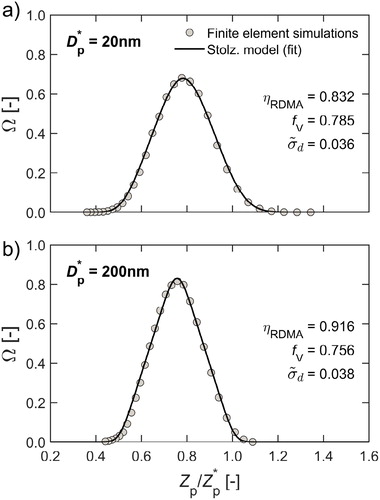
As expected, the transfer function shape at appears to be broader than that at
as a result of diffusional broadening. The fitting parameter for transmission efficiency,
, suggests a deviation of ∼20% and 9% from the Stolzenburg model (EquationEquation (4)
(4)
(4) ) for the two particle sizes examined.
includes wall deposition losses upstream or downstream the classification zone, as well as losses due to the non-ideal azimuthal distribution in the entrance of the classification region. For 200 nm particles, where Brownian motion is negligible, the reduced efficiency arises primarily from the azimuthal flow imbalance in the classification entrance, which according to causes ∼8% particle losses. The additional losses at the smaller particle size are primarily associated with wall deposition due to Brownian motion occurring outside the classification zone (i.e., at the inlet and outlet parts of the geometry). Electrophoresis in the transition from high voltage to ground at the outlet of the classifier may also partially contribute to these losses.
For each of these simulations, the peak mobility in the transfer function is ∼30% lower than predicted, corresponding to a classified particle size for given voltage that is approximately 30% larger than predicted. This effect is associated with the electric field near the entrance of the classifier. The use of an electrostatic dissipative material for the high voltage electrode spacer allows a small current to leak through this part toward the ground electrode, enhancing the electrostatic field near the classifier entrance. The additional electrostatic force enhances migration of the incoming particles. The effect of this field is significant because the radial flow velocity at the large radius where particles enter the classifier is low. Moreover, the results shown in indicate additional broadening of the transfer function than the model prediction (i.e., As shown in , this arises from the flow imbalance at the entrance of the Spider DMA classification region that reduces the instrument resolving power.
Theoretical transfer function fitting parameters
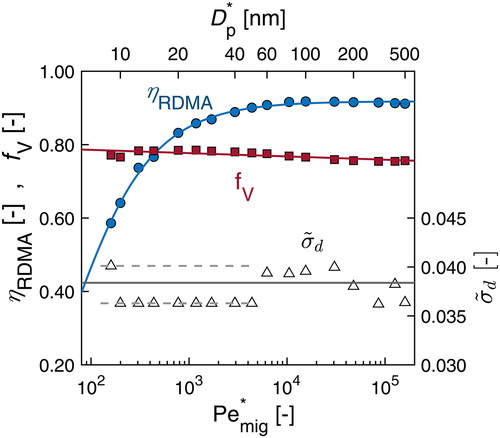
Fitting the Stolzenburg transfer function to the simulation results over the operating range of the instrument revealed systematic variations in the fitting parameters
and
with
as shown in (symbols).
varied little in the range where diffusional broadening is negligible (
). A possible explanation for this outcome is that the additional transfer function broadening results from the non-ideal flow distribution at the classifier entrance. This broadening should not vary much with particle size. Based on this observation, and to simplify the fitting process, we hypothesize that
is not a function of particle size. In the
range,
was therefore limited to acquire values within the range of
values that were found in the non-diffusive range, where fitting has been performed with no restriction. The variation in this range was approximately ±5% about a mean value of
No restriction was applied to fitting either
or
Figure 7. Fitting parameters
and
to the Stolzenburg transfer function model as a function of the non-dimensional migration Péclet number (
). Symbols show values of the fitting parameters to simulated transfer function data, at 0.9/0.3 L/min Spider DMA sheath/sample flowrates. Solid lines represent functions that were fit to the
and
values. Dashed lines indicate boundaries employed in the
fitting in the
range. The top horizontal axis indicates the particle size (
) corresponding to
values.
Following the work of Zhang and Flagan (Citation1996), we subsequently fit the values of
and
to the following analytical expressions as a function of the
:
(18)
(18)
(19)
(19)
(20)
(20)
These fits, which are shown in with solid curves, provide a close approximation to the parameters used in the fitting of the Stolzenburg model to the simulated transfer function data.
The “effective” approximate broadening parameter thus becomes:
(21)
(21)
where
is the theoretical broadening parameter in the Stolzenburg transfer function model (EquationEquation (9)
(9)
(9) ) and
is the approximate (constant) additive distortion parameter in EquationEquation (20)
(20)
(20) . A comparison between,
and
and the resulting DMA resolution as a function of the
is presented in S3 in the SI. Owing to the non-ideal azimuthal flow distribution at the classifier entrance, the resolution of the Spider DMA asymptotically approaches 2.75 in the non-diffusive operating range, about 9% lower than that predicted by the flowrate ratio, i.e.,
The magnitude of the reduction matches that in the peak transmission efficiency that was shown in . Finite element simulations using an azimuthally symmetric incoming aerosol flow within the Spider DMA eliminated the distortion and allowed the expected asymptotic resolution ( in the online SI).
Enhanced sizing resolution
Enhancement of the Spider DMA resolving power may be attained by operating the instrument at a higher sheath-to-aerosol flow ratio. Lowering the aerosol sample flow while maintaining the sheath flow constant may provide sizing over the same dynamic range with higher resolution. While this comes at the cost of weaker counting statistics, it might be a desirable operating mode for size distribution measurements of high-concentration aerosols whose properties vary little over time, or when operating the Spider DMA at constant voltage to provide a reference, narrow-width particle size distribution.
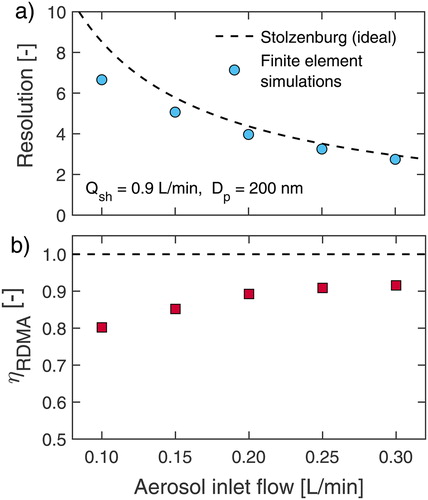
shows the simulated Spider DMA performance in classifying 200 nm particles at higher sheath-to-aerosol flow ratios. In this example, the sheath flow is kept constant at 0.9 L/min while the aerosol varies in the 0.1–0.3 L/min range. The results demonstrate that the Spider DMA resolution does increase with increasing sheath-to-aerosol ratio, albeit with an increasingly higher deviation from the ideal performance in both sizing resolution and transmission efficiency. The maximum bias appears at the lowest aerosol flow, and is approximately 20%. This apparent degradation in performance arises from the resulting non-ideal azimuthal distribution of primarily the sheath flow at the classifier entrance, which, as demonstrated in , increases in magnitude with higher DMA resolution.
Figure 8. (a) Spider DMA resolution and (b) transmission efficiency (classification region only) as a function of the aerosol inlet flowrate, for 0.9 L/min sheath flow and 200 nm particles. Symbols show finite element simulations results; dashed lines indicate ideal DMA performance.
Experimental characterization
Response to particle size
shows the fraction of mobility-classified NaCl or (NH4)2SO4 particles that are transmitted through the Spider DMA as a function of the applied voltage. The peak in transmission is seen at about 150 V, corresponding to 60 nm particles. For these particles, the response function is relatively narrow, and quite symmetric. As the particle size decreases from this size, diffusion broadens the transmission peak, a pronounced tail develops at the low-voltage side of the peak, and the peak fractional transmission diminishes to about 60% at 15 nm. From about 60 nm to 300 nm, the shape of the response function, and the peak fractional transmission remain constant at ∼80%, consistent with the Stolzenburg transfer function model. For the largest particles examined (400 nm), the shape of the response function remains the same, but the transmission efficiency drops. The predicted Spider DMA response, calculated based on the effective transfer function model described in EquationEquations (13)(13)
(13) and Equation(16)
(16)
(16) , agrees well with the experimental observations for most of the particle sizes studied, except for the drop in the transmission efficiency at 400 nm which is not predicted.
Figure 9. Ratio of particle counts downstream/upstream the Spider DMA as a function of negative electrode voltage, with quasi-monodisperse particles in the 15–400 nm size range. The classifier was operated in “stepping” voltage mode, and 0.9/0.3 L/min sheath/sample flowrates. Symbols represent experimental data with size-selected NaCl or (NH4)2SO4 particles. Solid lines demonstrate modeled response based on the parameterized Stolzenburg transfer function derived from finite element simulations.
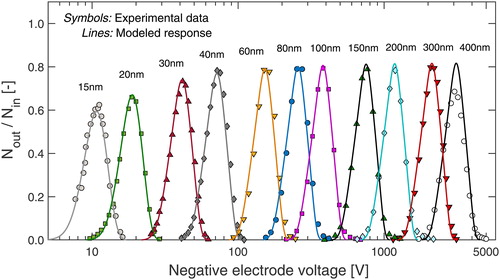
Additional experiments performed within the 350–500 nm size range (results not shown here), suggest a gradual drop in particle transmission with increasing size, reaching down to ∼50% peak transmission at 500 nm (instead of 80%). Shielding the external surfaces of the classifier with grounded foil reduced, but did not eliminate, this degradation, suggesting that the unexpected particle losses at the large particle size may be caused by electric field non-uniformities that become pronounced at voltages exceeding ∼3500 V.
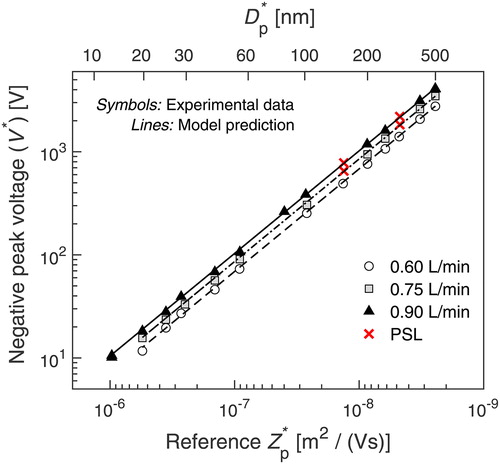
shows how the experimentally determined peak voltage () varies with particle mobility for three sheath flowrates (0.60, 0.75, and 0.90 L/min) and a sample flowrate of 0.3 L/min. As expected from EquationEquation (2)
(2)
(2) , and the relatively weak dependence of
to the Spider DMA operating voltage (), the data fall on three, nearly parallel straight lines, each corresponding to a different sheath flowrate.Footnote5 The required DMA voltage increases proportionally with higher sheath flowrate. The experimental data are in close agreement with the peak
predicted by EquationEquations (2)
(2)
(2) and Equation(19)
(19)
(19) for all sheath flow conditions tested, with mean deviations remaining within ±2% over three orders of magnitude in mobility. The data obtained with the PSL reference size standards corroborate the excellent agreement between predicted and measured peak voltage at these reference mobilities (mean percentage error of -1.5% ± 0.4%). The complete Spider DMA response curves with PSL spheres are available in the online SI ().
Figure 10. Spider DMA (negative) voltage at the peak transmission () as a function of reference particle mobility,
for 0.60, 0.75 and 0.90 L/min sheath, and 0.30 L/min sample flowrates. Symbols represent size-selected NaCl particle data. 152 ± 3 nm and 303 ± 6 nm PSL spheres data are illustrated with ‘x’ symbols. Lines represent predicted
based on the parameterized Stolzenburg transfer function model derived from finite element simulations. Bottom axis direction is reversed to indicate increasing particle size (from left to right). Top axis indicates particle size (
) corresponding to
values.
Summary and conclusions
This study has presented the design, simulation, and experimental characterization of the Spider DMA, a miniature RDMA that has been designed to facilitate rapid size distribution measurements in the 10 – 500 nm range. This compact (exterior dimensions ∼12 cm in diameter and 6 cm in height) and lightweight (∼350 g) classifier employs a radial flow DMA design, and operates at 0.6–1.5 L/min sheath and 0.3 L/min sample flowrates. These flows provide sufficient sizing resolution and counting statistics for typical ambient size distribution measurements over the design size range.
While the low flows reduce instrument volume and lower power consumption relative to common DMAs, they make it challenging to achieve a uniform sample distribution at the entrance of the classification region while maintaining the narrow distribution of particle time delay that is needed for scanning DMA measurements. Initial simulations revealed that a tangential inlet approach, commonly used in radial flow DMA geometries and in some cylindrical DMAs, is not appropriate for such low flow conditions. Instead, the Spider DMA inlet is based on a novel design, in which the sample flow is distributed gradually by introducing several pressure drop steps along the flow path. Downstream of the inlet distribution geometry, at the classifier entrance, the sheath and aerosol flow streams are introduced as directly opposing jets into an aerodynamic diffuser in order to ensure laminar flow and minimize particle delays associated with the formation of boundary layers near the instrument walls. The use of an electrostatically dissipative material as the dielectric spacer extends the electric field beyond the physical limits of the high voltage electrode, resulting in an effectively larger classification volume.
Based on detailed, 3D finite element simulations, we show that the Spider DMA transfer function can be described with high precision using the analytical model of Stolzenburg (Citation1988), and Flagan (Citation1999), by employing three fitting parameters to account for deviations in transmission efficiency, peak mobility offset, and transfer function width from the idealized model. Theoretical analysis and simulation results confirm that a uniform azimuthal distribution of both the sheath and aerosol flows at the entrance of the classification region is essential in attaining the theoretical classification transmission efficiency and resolution. For the present Spider DMA design, the deviation from this ideal when operated at 0.9/0.3 L/min sheath/sample flows is approximately 9%. Higher than the design sizing resolution (RND ∼ 3) can be achieved by operating the DMA at a higher sheath-to-sample flow ratio, with the caveat of an increasingly higher degradation in both particle transmission and resolving power; these are on the order of 20% lower than the ideal performance for 0.9/0.1 L/min sheath/sample flows. Moreover, the simulated transfer functions reproduce the effect of the enhanced electric field in the entrance region of the classifier, suggesting a ∼30% enhancement in the dynamic sizing range of the instrument.
Experimental characterization of the instrument response to particle size yields an excellent agreement with model predictions and a linear response in mobility classification over a three orders of magnitude mobility range. Compared to PSL spheres reference size standards, the uncertainty in sizing is less than 2%. A gradual drop in peak transmission efficiency was observed for classification voltages exceeding ∼3500 V; this degradation has been attributed to non-uniformities in the electric field at high voltages. Applying a grounded shield onto the external surfaces of the instrument substantially moderated this effect.
This classifier remains a work-in-progress. Subtle features were identified in this study that cause deviations from ideal performance. The lessons learned here will guide further improvement of this instrument and can be extended to the design of other low-flow aerosol instruments, especially those based upon electrical mobility. This study has focused on highlighting the key design features of the Spider DMA and its characterization in “stepping voltages” operation. A follow-up paper will demonstrate its performance together with the MAGIC CPC as a scanning electrical mobility spectrometer system, aiming to provide size distribution measurements in as little as 10 s in measurement scenarios that require compact, lightweight, and low-power sensors for autonomous operation.
Supplemental Material
Download PDF (1.3 MB)Acknowledgments
The authors would like to thank Dr. Huajun Mai for helpful discussions and assistance in preparation of the experimental data acquisition software.
Additional information
Funding
Notes
1 In a balanced DMA flows condition, the aerosol inlet flow () is equal to the classified sample flow (
), and the sheath flow (
) is equal to the excess flow (
).
2 For the Spider DMA geometry reported in this study, is calculated based on
mm,
mm, and
mm.
3 As formulated here, is also equivalent to a correction factor to the theoretical voltage at which the peak transmission occurs according to EquationEquation (2)
(2)
(2) .
4 From EquationEquations (6)(6)
(6) and Equation(17)
(17)
(17) :
5 Lines in Figure 10 appear to be ascending because the mobility axis direction is reversed to correspond to increasing particle size.
Related Research Data
References
- Barmpounis, K., A. Maisser, A. Schmidt-Ott, and G. Biskos. 2016. Lightweight differential mobility analyzers: toward new and inexpensive manufacturing methods. Aerosol Sci. Technol. 50 (1):2–v. doi: 10.1080/02786826.2015.1130216.
- Brunelli, N. A., R. C. Flagan, and K. P. Giapis. 2009. Radial differential mobility analyzer for one nanometer particle classification. Aerosol Sci. Technol. 43 (1):53–59. doi: 10.1080/02786820802464302.
- Chen, D.-R., D. Y. Pui, D. Hummes, H. Fissan, F. Quant, and G. Sem. 1998. Design and evaluation of a nanometer aerosol differential mobility analyzer (Nano-DMA). J. Aerosol Sci. 29 (5-6):497–509. doi: 10.1016/S0021-8502(97)10018-0.
- Fissan, H., D. Hummes, F. Stratmann, P. Büscher, S. Neumann, D. Y. H. Pui, and D. Chen. 1996. Experimental comparison of four differential mobility analyzers for nanometer aerosol measurements. Aerosol Sci. Technol. 24 (1):1–13. doi: 10.1080/02786829608965347.
- Fissan, H., A. Pöcher, S. Neumann, D. Boulaud, and M. Pourprix. 1998. Analytical and empirical transfer functions of a simplified spectrometre de mobilite electrique circulaire (SMEC) for nanoparticles. J. Aerosol Sci. 29 (3):289–293. doi: 10.1016/S0021-8502(97)10014-3.
- Flagan, R. C. 1998. History of electrical aerosol measurements. Aerosol. Sci. Technol. 28 (4):301–380. doi: 10.1080/02786829808965530.
- Flagan, R. C. 1999. On differential mobility analyzer resolution. Aerosol Sci. Technol. 30 (6):556–570. doi: 10.1080/027868299304417.
- Heim, M., G. Kasper, G. P. Reischl, and C. Gerhart. 2004. Performance of a new commercial electrical mobility spectrometer. Aerosol Sci. Technol. 38 (sup2):3–14. doi: 10.1080/02786820490519252.
- Hering, S. V., G. S. Lewis, S. R. Spielman, and A. Eiguren-Fernandez. 2019. A MAGIC concept for self-sustained, water-based, ultrafine particle counting. Aerosol Sci. Technol. 53 (1):63–72. doi: 10.1080/02786826.2018.1538549.
- Hering, S. V., S. R. Spielman, and G. S. Lewis. 2014. Moderated, water-based, condensational particle growth in a laminar flow. Aerosol Sci. Technol. 48 (4):401–408. doi: 10.1080/02786826.2014.881460.
- Johnson, K. K., M. H. Bergin, A. G. Russell, and G. S. W. Hagler. 2018. Field test of several low-cost particulate matter sensors in high and low concentration urban environments. Aerosol Air Qual. Res. 18 (3):565–578. doi: 10.4209/aaqr.2017.10.0418.
- Knutson, E. O., and K. T. Whitby. 1975. Aerosol classification by electric mobility: apparatus, theory, and applications. J. Aerosol Sci. 6 (6):443–451. doi: 10.1016/0021-8502(75)90060-9.
- Kulkarni, P., C. Qi, and N. Fukushima. 2016. Development of portable aerosol mobility spectrometer for personal and mobile aerosol measurement. Aerosol Sci. Technol. 50 (11):1167–1179. doi: 10.1080/02786826.2016.1230662.
- Liu, Q., and D.-R. Chen. 2016. Experimental evaluation of miniature plate DMAs (mini-plate DMAs) for future ultrafine particle (UFP) sensor network. Aerosol Sci. Technol. 50 (3):297–307. doi: 10.1080/02786826.2016.1149547.
- Mai, H., and R. C. Flagan. 2018. Scanning DMA data analysis I. Classification transfer function. Aerosol Sci. Technol. 52 (12):1–18. doi: 10.1080/02786826.2018.1528005.
- Mui, W., D. A. Thomas, A. J. Downard, J. L. Beauchamp, J. H. Seinfeld, and R. C. Flagan. 2013. Ion mobility-mass spectrometry with a radial opposed migration ion and aerosol classifier (ROMIAC). Anal. Chem. 85 (13):6319–6326. doi: 10.1021/ac400580u.
- Ranjan, M., and S. Dhaniyala. 2007. Theory and design of a new miniature electrical-mobility aerosol spectrometer. J. Aerosol Sci. 38 (9):950–963. doi: 10.1016/j.jaerosci.2007.07.005.
- Ranjan, M., and S. Dhaniyala. 2008. A new miniature electrical aerosol spectrometer (MEAS): experimental characterization. J. Aerosol Sci. 39 (8):710–722. doi: 10.1016/j.jaerosci.2008.04.005.
- Rosell-Llompart, J., I. G. Loscertales, D. Bingham, and J. Fernández de la Mora. 1996. Sizing nanoparticles and ions with a short differential mobility analyzer. J. Aerosol Sci. 27 (5):695–719. doi: 10.1016/0021-8502(96)00016-X.
- Santos, J. P., E. Hontañón, E. Ramiro, and M. Alonso. 2009. Performance evaluation of a high-resolution parallel-plate differential mobility analyzer. Atmos. Chem. Phys. 9 (7):2419–2429. doi: 10.5194/acp-9-2419-2009.
- Steer, B., B. Gorbunov, R. Muir, A. Ghimire, and J. Rowles. 2014. Portable planar DMA: Development and tests. Aerosol Sci. Technol. 48 (3):251–260. doi: 10.1080/02786826.2013.868863.
- Stolzenburg, M. R. 1988. An ultrafine aerosol size distribution measuring system. PhD diss., University of Minnesota.
- Stolzenburg, M. R. 2018. A review of transfer theory and characterization of measured performance for differential mobility analyzers. Aerosol Sci. Technol. 52 (10):1194–1218. doi: 10.1080/02786826.2018.1514101.
- Stolzenburg, M. R., and P. H. McMurry. 2008. Equations governing single and tandem DMA configurations and a new lognormal approximation to the transfer function. Aerosol Sci. Technol. 42 (6):421–432. doi: 10.1080/02786820802157823.
- Tritscher, T., M. Beeston, A. F. Zerrath, S. Elzey, T. J. Krinke, E. Filimundi, and O. F. Bischof. 2013. NanoScan SMPS – a novel, portable nanoparticle sizing and counting instrument. J. Phys. Conf. Ser. 429:012061. doi: 10.1088/1742-6596/429/1/012061.
- Winklmayr, W., G. P. Reischl, A. O. Lindner, and A. Berner. 1991. A new electromobility spectrometer for the measurement of aerosol size distributions in the size range from 1 to 1000 nm. J. Aerosol Sci. 22 (3):289–296. doi: 10.1016/S0021-8502(05)80007-2.
- Zhang, S.-H., Y. Akutsu, L. M. Russell, R. C. Flagan, and J. H. Seinfeld. 1995. Radial differential mobility analyzer. Aerosol Sci. Technol. 23 (3):357–372. doi: 10.1080/02786829508965320.
- Zhang, S.-H., and R. C. Flagan. 1996. Resolution of the radial differential mobility analyzer for ultrafine particles. J. Aerosol Sci. 27 (8):1179–1200. doi: 10.1016/0021-8502(96)00036-5.