
 ?Mathematical formulae have been encoded as MathML and are displayed in this HTML version using MathJax in order to improve their display. Uncheck the box to turn MathJax off. This feature requires Javascript. Click on a formula to zoom.
Abstract
This study describes the characterization of a H2O-dispersible, highly-absorbing carbonaceous nanomaterial that mimics the morphological and spectroscopic properties of aged black carbon aerosol (BC). When atomized from aqueous suspension, the material forms particles with a collapsed morphology resembling aged soot or BC. The material is >90 percent elemental carbon and has a mass absorption coefficient (MAC) and spectral dependence consistent with BC values published in the literature. The MAC at a wavelength of 532 nm decreased monotonically from 8.5 to 5.8 m2 g−1 for aerosol with mobility diameters between 150 nm to 500 nm. The single scatter albedo (SSA) at wavelengths of 405 nm and 660 nm was a function of both wavelength and mobility diameter and increased from 0.1 to 0.4 with mobility diameters between 150 nm to 400 nm. The Ångström absorption exponent (AAE) between λ = 405 nm and 780 nm decreased monotonically from 1.4 to 0.6 for aerosol with mobility diameters between 150 nm to 400 nm. We demonstrate that this material can be used for fast, efficient calibration of aerosol photoacoustic spectrometers and for evaluation of spectroscopic-based measurements of aerosol mass concentration using in-situ photoacoustic spectroscopy (PAS) and filter-based light attenuation measurements for up 50 µg m−3, enabling inter-method and inter-laboratory instrument comparison.
Copyright © 2019 American Association for Aerosol Research
EDITOR:
Introduction
Black carbon aerosol (BC) in the atmosphere impacts climate (IPCC) and endangers human health, yet the global BC budget remains uncertain by more than a factor of two (Andreae and Ramanathan Citation2013; Bond et al. Citation2013; IPCC Citation2013; Lelieveld et al. Citation2015; Landrigan et al. Citation2018). Quantitative, intercomparable aerosol measurements have been a focus of steering committees, workshops, and published reports (NIST Citation2011; Baumgardner et al. Citation2012). These groups have issued suggestions on developing nanomaterials and methods for instrument calibration, evaluation and intercomparison with the goal of enabling comparability and data harmonization in the reporting and agreement of measured values (Baumgardner et al. Citation2012). A workshop of more than fifty experts was convened in 2011 at the 10th International Conference of Carbonaceous Particles in the Atmosphere (IC-CPA) in Vienna, Austria and suggested the development of BC reference materials (RM) to be used for calibration of filter-based, in-situ incandescence and light absorption measurements (Baumgardner et al. Citation2012). Similar recommendations were issued at a workshop on Aerosol Metrology and Needs for Climate Science at the National Institute of Standards and Technology (NIST) in Gaithersburg, MD in 2011 (NIST Citation2011). These workshops set milestones for the demonstration and development of RMs for aerosol instrument inter-laboratory and inter-method comparability and calibration (NIST Citation2011; Baumgardner et al. Citation2012).
BC is defined as a class of solid, nearly elemental carbonaceous nanomaterials formed during the incomplete combustion of carbon-containing fuels, and composed of aggregated spherical monomers agglomerated into larger particles with a complex lacey (freshly emitted) or compacted (aged particles) morphology (Bond and Bergstrom Citation2006; Bond et al. Citation2013). Like most other elemental carbon materials (e.g., graphene, graphite, etc.), BC strongly absorbs light across the UV to near-IR spectral region (i.e., the solar transmission window), thereby impacting the energy balance of the atmosphere (Bond and Bergstrom Citation2006; Lam et al. Citation2012; Bond et al. Citation2013; Zangmeister et al. Citation2018). The BC mass concentration (MBC, g m−3) is of particular interest, where it contributes to regulatory compliance for fine particulate matter (PM2.5), and is involved in short-term transient concentrations and long-term records from measurements in soil, snow, and ice (Schmidt et al. Citation2001; Schwarz et al. Citation2012; Lim et al. Citation2014).
Two methods are often used to quantify MBC from the materials intrinsic optical properties: in-situ light absorption using photoacoustic spectroscopy (PAS) and ex-situ light attenuation using filter-based methods; here, in-situ denotes that the particles are suspended in air when the measurement is performed. Photoacoustic spectroscopy of absorbing materials (gas, aerosol, etc.) uses a transducer (microphone) to measure a pressure wave associated with the thermal relaxation of absorbed light (Havey et al. Citation2010). It is assumed that all absorbed energy is converted to heat and detected by the transducer. Other pathways of energy loss, such as evaporation of volatile species may impact the quantification of PAS measurements (Langridge et al. Citation2013; Radney and Zangmeister Citation2017). Aerosol mass concentration can be calculated from the measured photoacoustic response, via the aerosol absorption coefficient (αabs, m−1), where αabs is the product of the number density (N, m−3) and the aerosol absorption cross-section at a given wavelength (λ), Cabs (λ) (m2), measured
(1)
(1)
where mp (g) is the average particle mass, MAC (λ) (m2 g−1) is the mass absorption coefficient for the measured distribution at a given λ, and M (or MBC, g m−3) is the ensemble mass concentration (Radney and Zangmeister Citation2015; You et al. Citation2016; Radney and Zangmeister Citation2017). From EquationEquation (1)
(1)
(1) , aerosol absorption measurements of
(λ) enable M to be calculated if the MAC of the ensemble or particle is known.
Measurement of gas phase spectroscopic properties (e.g., Cabs (λ)) can be directly linked to the International System of Units (Système International, SI) using materials with calculated and experimentally verified spectral line intensities and absorption coefficients (see HITRAN, etc.) (Gordon et al. Citation2017). This enables quantitative evaluation, calibration, and inter-comparability of instruments and methods. Conversely, there is no HITRAN analog for aerosolized nanomaterials, complicating the reporting of measurements derived from aerosol spectroscopic values, such as M. Aerosol spectroscopic properties (Cabs (λ), MAC (λ)) of highly absorbing materials, such as BC, are a function of the materials’ complex refractive index, the size of individual monomers, the arrangement of monomers (particle morphology), the particles size (e.g., mobility diameter), and the internal mixing state (Moosmüller, Chakrabarty, and Arnott Citation2009; Zangmeister and Radney Citation2018). These parameters are a function of particle formation conditions such as the fuel used, the fuel to O2 ratio, and the flame temperature (Colbeck, Atkinson, and Johar Citation1997; di Stasio and Braun Citation2006; Schnaiter et al. Citation2006; Zangmeister and Radney Citation2018; Zangmeister et al. Citation2018). Thus, BC MAC cannot be described by a single value, but is a function of formation conditions, as well as particle size and morphology (Zangmeister and Radney Citation2018).
Filter-based detectors measure the change in light transmission through a filter as particles are deposited as a function of time. Filter attenuation is derived using the Beer-Lambert law (I0/I), and is converted to MBC using an instrument-specific mass attenuation coefficient (MATC) at one or more λ. Because of the portability, robustness and ease of operation of filter-based measurements, they are widely deployed in field studies to determine MBC and wavelength dependent aerosol attenuation, but a number of factors can impact their accuracy. In principle, the MATC is a function of the same parameters that influence aerosol spectroscopic properties (RI, monomer size, morphology, etc.), but must also include contributions from the scattering cross-section of individual particles and other filter-dependent effects such as the physical characteristics of the filter medium, multiple scattering of light by the filter and particles, particle shadowing, volatile particle evaporation and gas condensation (Arnott et al. Citation2005; Laborde et al. Citation2012). Each of these parameters adds complexity and may limit the accuracy of filter-based measurements (Arnott et al. Citation2005). This method will be more thoroughly characterized in a follow-up paper.
Recent studies highlight the need for developing rigorous methods of quantification, comparison, and validation of MBC measurements (Slowik et al. Citation2007; Cross et al. Citation2010; Baumgardner et al. Citation2012; Bond et al. Citation2013). For example, the MBC derived from two co-located identical model filter-based light attenuation instruments under well-controlled laboratory conditions varied by more than 50 percent, and by 30 percent when compared to reference PAS measurements (Arnott et al. Citation2005; Muller et al. Citation2011; Mason et al. Citation2018). Inter-method variability in MBC increases to 80 percent when BC is embedded in or coated by other materials (Slowik et al. Citation2007).
Quantitative measurement of MBC is dependent on the establishment of suitable aerosolizable materials that mimic BC optical properties to enable instrument calibration, evaluation, intercomparison and validation. To date, a suitable material has not been developed, characterized, deployed or utilized within the aerosol community. Thus, instrument intercomparisons have been limited to studies with co-located intra-laboratory instruments measuring the same aerosol stream in parallel. Studies have focused on using BC or BC-like aerosol generated from flames which are highly variable in both Cabs and mp, impacting MAC, and, although not well studied, also likely impacting MATC (Arnott et al. Citation2005; Slowik et al. Citation2007; Cross et al. Citation2010). Some studies of flame generated aerosolized materials report the formation of highly stable, reproducible aerosol, whereas other studies cite large day-to-day variability in particle concentration and measured properties, making it a challenge to compare studies without detailed knowledge of the formation conditions, or the variability of the material produced (Kirchstetter and Novakov Citation2007; Radney et al. Citation2013; Moore et al. Citation2014). Flame-generated materials may also contain organic aerosol (OA) and coatings of weakly absorbing organic carbon that can alter mp, and the optical and chemical properties, making them irreproducible, and unsuitable for interlaboratory studies or instrument calibration (You et al. Citation2016). Calibration methods have used aerosolized materials that exhibit instrumental responses mimicking a singular BC property of interest (absorption or attenuation) limiting the transferability between measurement platforms that report MBC (Lack et al. Citation2006; Moteki and Kondo Citation2010; Baumgardner et al. Citation2012; Laborde et al. Citation2012; Radney and Zangmeister Citation2015; Bluvshtein et al. Citation2017; Davies et al. Citation2018). In addition to satisfying the above physical and chemical properties required for quantitative measurement, a BC-like reference material must also be easy to generate as an aerosol, exhibit a size distribution consistent with field-based observations (spanning mobility diameters of ≈ 100 nm to 500 nm), be shelf stable, cost effective, nontoxic, and easily transferrable between laboratories (Baumgardner et al. Citation2012).
This study describes the characterization of a material that mimics BC optical properties and is water dispersible making it easy to transfer between laboratories and aerosolize from aqueous suspension. The particle size (i.e., mobility diameter, Dm), particle mass (mp), and concentration (N), were measured. The material’s light absorption spectrum (MAC vs. λ) was measured between λ = 405 nm and 780 nm using particle mobility diameter (Dm) and mass-selected (mp) aerosol. Lastly, it is demonstrated that the material can be used to measure, calibrate and evaluate photoacoustic spectrometers and filter-based instruments used to measure M.
Materials and methods
The black carbon aerosol mimic, herein termed CB, was produced by the Cabot Corporation and sold under the product trade name of Cab-O-Jet 200Footnote1 (Groves and Tuck Citation1979). Presented data were collected over 3 years from multiple production lots. The data was independent of production and measurement date. The elemental and chemical composition of CB were characterized using elemental carbon analysis (elemental carbon/total carbon, EC/TC) and X-ray photoemission spectroscopy (XPS). The morphology of CB was characterized using transmission electron microscopy (TEM) and by the measured mass-mobility scaling exponents (Dfm). The optical absorption properties of CB were characterized using photoacoustic spectroscopy and compared to filter-based attenuation measurements made using a commercially available instrument.
Aerosol generation
Aqueous CB suspensions were aerosolized using a liquid jet cross flow atomizer. Of the 2.2 L min−1 of flow exiting the atomizer, 0.5 L min−1 was sampled and conditioned by passing the aerosol laden air stream through large diameter Nafion dryer(s) and/or silica gel diffusion dryer(s) prior to measurement.
Mass-mobility exponents, effective density, and mass-selected spectroscopic measurements
The use of a tandem differential mobility analyzer (DMA), aerosol particle mass analyzer (APM), and condensation particle counter (CPC) for the determination of aerosol mass to mobility diameter scaling and effective density has been previously documented (Zangmeister et al. Citation2014). The morphology of CB particles was ascertained from the Dm to mp relationship using:
(2)
(2)
where mp,0 and Dm,0 represent the particle mass and mobility diameter at a reference Dm = 250 nm, and Dfm represents the mass-mobility scaling exponent, a metric of particle morphology, where Dfm = 2 and 3 correspond to planar sheets and spherical particles, respectively.
The cavity ring-down spectrometer (CRD) used is identical to a previously described single wavelength CRD spectrometer, with the exception that both λ = 405 nm and 660 nm continuous wave diode lasers were used. The CRD data were collected across ≈ 3 years (You et al. Citation2016; Zangmeister et al. Citation2018). Values of αext measured by the CRD were validated using Dm- and mp-selected ammonium sulfate (AS); measured extinction cross sections (Cext = αext/N) spanning 150 nm < Dm < 500 nm always agreed with Mie theory to better than ± 5 percent after accounting for density effects; see Radney and Zangmeister (Citation2018). Notably, this level of agreement suggests that the particle counting accuracy of the CPC is also better than ± 5 percent.
Aerosol were first classified by size (electrical mobility, Dm) using a DMA and subsequently by mass using an APM (mp). The corresponding distributions of number density (N) and extinction coefficients (αext) as a function of particle mass were measured using a condensation particle counter (CPC) and a CRD, respectively. The N as a function of mp were then fit to a Gaussian distribution
(3)
(3)
where AN is the amplitude, mavg is the average mass and σN is the 1/e halfwidth of the distribution. Particles having the same electrical mobility (Zp) are selected from a distribution using a DMA. This Dm, defined as the diameter of a spherical particle with the same electrical mobility as those being measured, is a function of the particle’s electro-motive force (which is a function of charge) and drag force, as described by
(4)
(4)
where q is the net particle charge (which must be an integer), and γ is the drag-slip correction for non-solid and/or non-spherical particles. The Dm of multiply charged CB was measured using a tandem DMA arrangement where the aerosol charge was neutralized at each DMA, see the online supplementary information for Dm of q = +2, +3 CB.
The aerosol effective density (ρeff) was calculated from
(5)
(5)
In addition to data shown in the manuscript, the mp of CB as a function of suspension concentration is shown in the supplementary information.
Mass absorption coefficient measurement
Absorption spectra of Dm and mp selected particles were measured using a single photoacoustic spectrometer (PA) utilizing both a continuous-wave diode laser (λ = 405 nm) and a supercontinuum laser with tunable wavelength and bandpass filter (λ = 532 nm, 660 nm, and 780 nm), as in Radney and Zangmeister (Citation2015) and the supplementary information of Radney and Zangmeister (Citation2017). Switching between the two lasers was accomplished using a flip optical mount. Measured 1 Hz data was averaged to 30 s from which the absorption coefficient (αabs) was calculated; when using the supercontinuum source, wavelength regions were randomized prior to starting the measurement to avoid systematic bias from preordered sets and alternated at 30 s intervals. In total, a minimum of three spectra were collected and averaged to a single replicate. For each replicate, MAC at each wavelength was calculated through the second form of EquationEquation (1)(1)
(1) (MAC = αabs/mpN). Reported MAC spectra and the corresponding uncertainties represent the average values from a minimum of 3 replicates and the standard deviation of all replicates at a given wavelength, respectively.
XPS measurements
X-ray photoelectron spectra were acquired using a commercially available X-ray photoemission spectrometer from a thin film drop-cast onto doped silicon substrates. An Al kα source with a 10 eV pass energy and a 90° take off angle were used. Data was collected on a single sample across several spots and elemental ratios were determined using relative sensitivity factors for each element (C 1 s = 0.296, O 1 s = 3.747, S 2p = 0.576).
EC/OC measurements
EC/OC measurements were made using a commercially available instrument using previously described experimental conditions (Conny et al. Citation2003). The quartz filter was heated in an oven at 650°C to remove organic carbon prior to atomization of CB onto the filter.
Filter measurements
Dm-selected aerosol was sampled at 0.6 L min−1 and diluted with ≈ 5.4 L min−1 of dilution air before being transported to the filter. Size distributions were measured by a DMA-CPC as described above and shown in . Filter-based attenuation measurements to determine M were performed utilizing size-selected aerosol at Dm = 300 nm. CB suspension concentration (0.25 and 0.70 mg mL−1) was used to adjust aerosol number density at the CPC and filter-based instrument. The filter was advanced frequently to avoid shadowing effects. The delivery of q > +1 particles to the filter-based instrument would result increased attenuation and enhance the reported M when compared to the inclusion of only q = +1 (i.e., attenuation of q + 2 > q + 1). This was accounted for (Ntotal* mp,total = Nq=+1 * mp,q=+1 + Nq=+2 * mp,q=+2) by measuring the particle distribution as a function of q and CB suspension concentration using a combination of tandem DMA and APM to measure the q = +2 mass. No q = +2 was detected for 0.25 mg mL−1. The presence of q = +2 at 0.70 mg mL−1 was <4 percent in number concentration and resulted in over reporting M by 6 percent, and was accounted for in reported M.
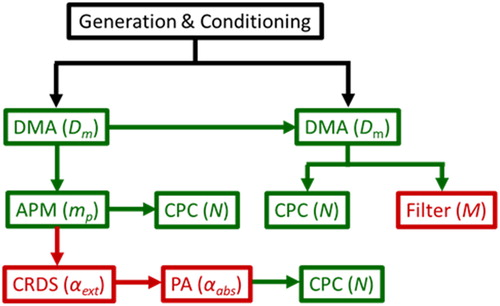
Figure 1. Schematic of experimental design showing aerosol generation (black), classification (green), and spectroscopic characterization (red) where DMA = differential mobility analyzer, APM = aerosol particle mass analyzer, CPC = condensation particle counter, CRD = cavity ringdown spectrometer, PA = photoacoustic spectrometer. Parenthesis shows measurement performed, as described in text.
Results and discussion
Elemental and physical characterization of CB films and aerosol
X-ray photoelectron spectroscopy was used to probe the interfacial elemental composition of CB thin films dropcast on doped Si wafers. Only carbon, oxygen, and sulfur were detected, see . Elemental composition within each sample was quantified using the peak positions and intensities of the C 1 s (284.6 eV), O 1 s (532.0 eV), and S 2p (162 eV) using instrument and source-appropriate relative sensitivity factors for each element. The samples averaged 89.1 ± 1.7 percent carbon (1σ, standard deviation), 9.5 ± 0.7 percent oxygen and 1.8 ± 0.3 percent sulfur by mass, corresponding to an elemental ratio of C/O = 9.4 ± 0.7 and C/S = 49.5 ± 10.6. The presence of sulfur was attributed to the inclusion of the surfactant sodium 4-sulfophenylate to modify the CB particle surface and enhance its suspension in H2O. The O 1 s envelope lacks the resolution to identify specific source assignments, but was likely a combination of bound organic sulfur, surface carbon, and chemisorbed, interstitial H2O.
Figure 2. (a) X-ray photoelectron spectrum of a drop-cast CB thin film. Designated photoemission lines shown used for determination of elemental composition. (b) Flame ionization detector (FID) response (solid line) and temperature (dashed line) as a function of time (s) for Dm = 300 nm CB aerosol collected on a quartz filter. Temperature and atmosphere split between organic carbon (OC) and elemental carbon (EC) denoted by vertical dotted line. (c) TEM image of individual CB monomers from drop-cast aqueous suspension, scale bar is 50 nm. (d) aggregates observed from dilute suspension of CB drop-cast onto TEM grid, scale bar is 200 nm. (e) Atomized CB particles electrostatically deposited on lacey carbon grids. Scale bar represents 1 µm.
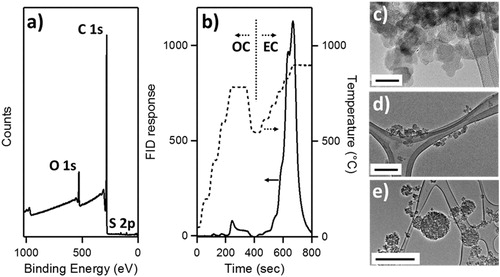
Carbon within CB was categorized as elemental (long range, delocalized, sp2-bound carbon) or organic carbon (sp3-bonding C-C and/or sp2/sp3-bonding C-O) using a thermal optical analyzer to detect thermally evolved carbon dioxide that is reduced to methane (CH4) and measured using a flame ionization detector (FID). The FID response was measured as a function of sample temperature, time and gaseous atmosphere using a programed sequence (Conny et al. Citation2003). shows the FID response as a function of time, temperature and atmosphere of CB aerosol atomized from a 1 mg mL−1 aqueous suspension and collected on a quartz filter. Using this framework CB is 0.96 ± 0.05 elemental carbon (1σ).
The physical structure and morphology of CB particles were evaluated using TEM images of CB drop-cast from dilute suspension and atomized CB particles electrostatically precipitated onto lacey carbon TEM grids. CB consists of nearly spherical monomeric subunits () with an average diameter of 27 ± 7 nm (1σ) arranged into aggregates () that form into nearly spherical agglomerates () upon atomization at all observed Dm.
Mobility (Dm) and spectroscopic characterization of CB aerosol
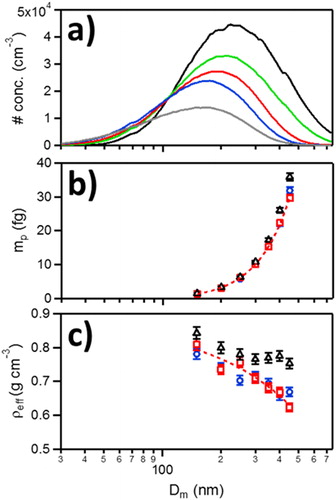
The geometric mean diameter (Dgeo) of CB aerosol distributions and number density (N) could be controlled by adjusting the suspension concentration; size distributions were measured as a function of CB concentration from 0.25 mg CB mL−1 to 4 mg CB mL−1; see . The Dgeo increased with CB suspension concentration from 169 nm at 0.25 mg CB mL−1 up to 233 nm at 4 mg CB mL−1. Despite the changes in mean Dm with CB concentration, particle mass (mp) was only slightly affected up to 1 mg CB mL−1, see , and Figure S2 in the supplementary information. Using EquationEquation (2)(2)
(2) , Dfm was determined to be 2.83 ± 0.05 across all measured CB suspension concentrations (0.25 mg CB mL−1 to 4 mg CB mL−1), consistent with the nearly spherical (Dfm = 3) particles observed in TEM images. Notably, aerosol from 4 mg CB mL−1 had a higher mass (at constant Dm) when compared to aerosol formed at lower CB concentrations and is mirrored in the effective density (ρeff), calculated using EquationEquation (5)
(5)
(5) , see . For 4 mg mL−1 CB suspensions, ρeff is nearly constant for Dm ≥ 250 nm. At lower CB concentrations, ρeff is independent of suspension concentration and decreases nearly linearly with Dm, indicating larger void volumes with increasing Dm.
Figure 3. (a) Particle number concentration (# cm−3) as a function of Dm (nm) atomized from 0.25 (grey), 0.50 (blue) 1.0 (red), 2.0 (green), 4.0 (black) mg CB mL−1 aqueous CB suspensions. (b) Particle mass (fg, 10−15 g) as a function of Dm (nm) for 0.50 (blue), 1.0 (red), 4.0 (black) mg CB mL−1 aqueous CB suspensions. Dashed red line represents fit of 1.0 mg CB mL−1 aqueous CB suspension using EquationEquation (4)(4)
(4) . (c) Effective density (ρeff, g cm−3), calculated using EquationEquation (5)
(5)
(5) as a function of Dm (nm) for 0.50 (blue), 1.0 (red), 4.0 (black) mg CB mL−1 aqueous CB suspensions. Dashed red line represents linear best fit of 1.0 mg CB mL−1 aqueous CB suspension. Error bars are 1σ from a minimum of three measurements.
Spectroscopic (absorption or attenuation) determination of M requires a priori knowledge of aerosol optical properties (MAC, and its extinction analog, MEC) as a function of Dm and λ. For highly absorbing aerosol both MAC and MEC are likely a function of Dm and λ – only particles in the Rayleigh regime exhibit constant MAC and MEC – complicating the ability to quantify M under even the most idealized measurement conditions such as a monodisperse Dm and mp-selected aerosol (Mishchenko, Mackowski, and Travis Citation1995; Moosmüller and Arnott Citation2009; Moosmüller, Chakrabarty, and Arnott Citation2009). Thus, to enable quantification of aerosolized CB M, or other similar materials, the MAC and MEC (or other optical properties) must be known as a function of λ. Aerosol mass selection enables direct measurement of absorption on a per mass basis, as the mass absorption coefficient (MAC), see EquationEquation (1)(1)
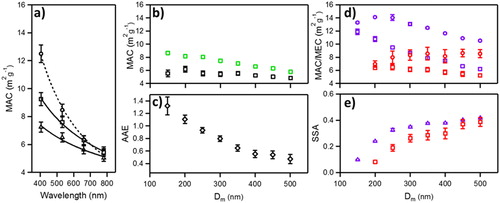
(1) . shows the MAC of CB as a function of λ for λ = 405 nm, 532 nm, 660 nm, and 780 nm for mp-selected CB at Dm = 250 nm, 350 nm, and 450 nm using photoacoustic spectroscopy. The measured MAC of CB was a function of both mp (or Dm) and λ, as shown in , for data collected from two separate production lots of CB. The MAC decreased monotonically with Dm for λ ≤ 660 nm and is nearly independent of Dm for λ = 780 nm; particles are closer to the Rayleigh regime so equal light penetration occurs at all D (Moosmüller and Arnott Citation2009; Moosmüller, Chakrabarty, and Arnott Citation2009). Additional spectroscopic data at λ = 405 nm and 660 nm is tabulated in the supplementary information Table S1.
Figure 4. Measured spectroscopic data for Dm and mp-selected CB from atomization of 1.0 mg CB mL−1 aqueous CB suspensions. (a) Mass-specific absorption coefficient (MAC) as a function of wavelength for Dm = 150 nm (circles), 300 nm (squares), 450 nm (triangles) mobility, and mass selected aerosol, (b) MAC at λ = 532 nm (green) and 780 nm (black) as a function of Dm. (c) Ångström absorption exponent (AAE) using EquationEquation (6)(6)
(6) between λ = 405 nm and 780 nm as a function of Dm. (d) MAC (squares) and mass-specific extinction coefficient (MEC, circles) at λ = 405 nm (purple) and λ = 660 nm (red) as a function of Dm. (e) Single scattering albedo (SSA) at λ = 405 nm (purple triangles) and λ = 660 nm (red squares) nm as a function of Dm. Note that ordinate are identical in (a), (b), and (d). Uncertainties represent 1σ from >3 measurements and 2 production lots.
The spectral shape (wavelength dependence) of absorption was also a function of Dm and is quantified by the absorption Ångström exponent (AAE)
(6)
(6)
where λ and λREF are an arbitrary and reference wavelength, respectively. AAE were calculated by fitting the absorption data at each Dm to EquationEquation (6)
(6)
(6) . The change in AAE with Dm is shown in , and shows a nearly linear decrease in AAE for Dm ≤ 400 nm and is invariant (within 1σ) at larger Dm. This arises from the transition of particle absorption from the Rayleigh to the Mie regime (volume to surface regime) with increasing Dm, as evidenced in (Moosmüller and Arnott Citation2009; Moosmüller, Chakrabarty, and Arnott Citation2009; Zangmeister and Radney Citation2018). The measured spectral response (MAC and AAE) of CB are both typical of highly absorbing carbonaceous aerosol with a compacted morphology, consistent with the observed TEM images and measured Dfm (Moosmüller and Arnott Citation2009; Moosmüller, Chakrabarty, and Arnott Citation2009; Zangmeister and Radney Citation2018; Zangmeister et al. Citation2018).
The single scattering albedo (SSA) of an aerosol – defined as the ratio of aerosol scattering to extinction – depends on the material, morphology, Dm, and λ, is important in the quantification of atmospheric radiative forcing; it can change the sign of direct aerosol forcing. Well-characterized aerosol generated under laboratory conditions enables the complex parameter space in the quantitative measurement of SSA to be controlled and compared to other materials with unknown physical properties. Here, SSA was determined from the combined measurement of MAC and MEC (using cavity ring-down spectroscopy), see , for mp-selected aerosol as a function of Dm at λ = 405 nm and 660 nm. The MAC at λ = 405 nm exhibited a nearly linear and decreasing dependence with Dm; a similar but smaller dependence was observed at λ = 660 nm. The MEC at λ = 405 nm was nearly constant for Dm ≤ 250 nm, and subsequently decreased with increasing Dm. Conversely, the MEC at λ = 660 nm increased monotonically with Dm. The SSA at λ = 405 nm increased rapidly with Dm for Dm ≤ 250 nm, and is linear with increasing Dm, whereas at λ = 660 nm the SSA increases nearly linearly with Dm, as shown in . The observed spectral shape as a function of λ and Dm can be explained by the size parameter (x = πD/λ), as explained in detail by (Moosmüller, Chakrabarty, and Arnott Citation2009) and (Moosmüller and Arnott Citation2009).
Demonstration of CB for instrumental and method comparison, evaluation, and calibration
The spectral properties and morphology of CB closely mimic collapsed highly absorbing carbonaceous aerosol observed in aged atmospheric samples, enabling its use in evaluating techniques for determination of BC mass concentration (M, reported as ng m−3). Two methods used in the measurement of M are tested and compared: light absorption and filter attenuation using CB of known mp and/or Dm. The measurements were evaluated against M determined using a particle counter-based method (MC), where MC = mp*N. The measurements were performed simultaneously and in parallel to ensure quantitative comparability between each technique, see . The light absorption-based method used PAS (MPAS) at λ = 532 nm and 780 nm as a function of Dm using Dm and mp-selected CB. MPAS was calculated as the product of the measured absorption coefficient (αabs) at each λ and the measured, average MAC (MACT) of Dm and mp-selected CB, MPAS = αAbs * MACT. Data used in MACT was collected and tabulated over 3 years of PAS measurements on multiple production lots of CB aerosol at NIST. Measured values of MACT and mp for each Dm are shown in . The MC and MPAS were highly correlated at each λ, see , with slopes of 1.021 ± 0.006 and 1.004 ± 0.017 (1σ) at 532 nm and 780 nm, respectively, illustrating that aerosolized CB can be used for M determination using Dm and mp-selected aerosol.
Table 1. The ensemble measured mp and MACT at λ = 405 nm, 532 nm, 660 nm, and 780 nm from aqueous 1.0 mg mL−1 CB suspension as a function of Dm for aerosolized CB.
Figure 5. (a) Aerosol mass concentration (M, ng m−3) of Dm and mp-selected CB measured by photoacoustic spectroscopy (MPAS) at λ = 532 nm (green circles) and 780 nm (black squares) vs. M measured by particle counting (MC). Dashed line represents 1:1. Uncertainties in MPAS represent propagated 1σ uncertainties in αabs and MAC while uncertainties in MC represent propagated 1σ uncertainties in mp and N, respectively. We assume a 5% particle counting uncertainty across all N. (b) Filter-based mass concentration (MF) vs. MC of Dm = 300 nm CB using the manufacturer’s (default) MATC of 16.6 m2 g−1 for λ = 880 nm radiation. Dashed line represents 1:1. Uncertainties in MF are ± 50 ng m−3 for filter-based measurements and for MC the same as defined in (a). Note the order of 24× difference in MC between (a) and (b).
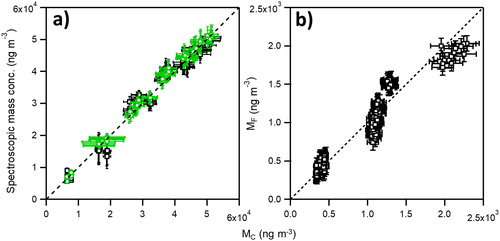
The second spectroscopically-based method to test M determination measured the light attenuation of CB collected onto a filter. The filter-based method uses the measured flow rate and a manufacturer-determined λ-dependent mass attenuation coefficient (MATC) at λ = 880 nm to determine M (MF) as a function of time. Mobility-only selected CB aerosol (Dm = 300 nm, mp = 11.7 ± 0.4 fg) and a known and controlled flow rate of CB was delivered to the filter-based instrument and the particle counter for simultaneous determination of MF and MC. shows the MF vs. MC across a wide, and atmospherically relevant CB M (400 ng m−3 to 2200 ng m−3). Using this experimental scheme, MF vs. MC was fit using a linear function across the measured CB mass range with an intercept near the origin (61 ± 36 ng m−3), but MF under measured MC by 7 ± 2 (MF/MC = 0.93 ± 0.02, 1σ) percent. It is unknown if the observed spread in the data and deviation between MF and MC was due to performance of the particular instrument used in this study, or if CB’s combination of high percentage of elemental carbon, compacted morphology, and spectroscopic properties were not well captured by the instrument manufacturer MATC. As stated previously, two co-located identical model filter-based light attenuation instruments varied by more than 50 percent, suggesting that instrumental variation using factory set MATC specifications may contribute to the reported MF (Cross et al. Citation2010). Further investigation will be described in a follow-on paper.
Laboratories have utilized a variety of methods and materials for the calibration of aerosol photoacoustic spectrometers. Both gas phase (H2O, O2, O3, NO2) and aerosolized (nigrosin) materials have been demonstrated, using methods that are often laboratory, material, or λ specific, limiting the transferability between measurement platforms and locations (Lack et al. Citation2006; Havey et al. Citation2010; Radney and Zangmeister Citation2015; Bluvshtein et al. Citation2017; Davies et al. Citation2018). Gas phase calibration of photoacoustic spectrometers is advantageous due to linking measured values to the SI using well-characterized and cataloged (HITRAN database) gas phase absorption lines with known spectral line intensity (Robichaud et al. Citation2008; Havey et al. Citation2009; Long et al. Citation2013; Gordon et al. Citation2017). Gases also require accounting for potential decomposition, contamination (NO2 in O3), and/or reaction (2 O3 ⇌ 3 O2, 2NO2 ⇌ N2O4) and methods to deliver and quantify (e.g., CRD, hygrometer, etc.) the amount of gas delivered to the spectrometer (Bluvshtein et al. Citation2017). The narrow transitions of gas rovibrational lines necessitate the use of light sources that overlap the line of interest that often reside outside the spectral window (IR to nIR) relevant to BC absorption (nIR to UV). Conversely, most aerosolized materials have broad absorption features, but published values of their spectral properties are limited to a handful of materials and wavelength (Laborde et al. Citation2012; Radney and Zangmeister Citation2015; Bluvshtein et al. Citation2017; Davies et al. Citation2018; Zangmeister and Radney Citation2018; Zangmeister et al. Citation2018). A suitable aerosol for photoacoustic spectrometer calibration across multiple laboratories would require the knowledge of the materials absorption properties (CAbs, MAC) as a function of Dm, λ, and mp, if possible.
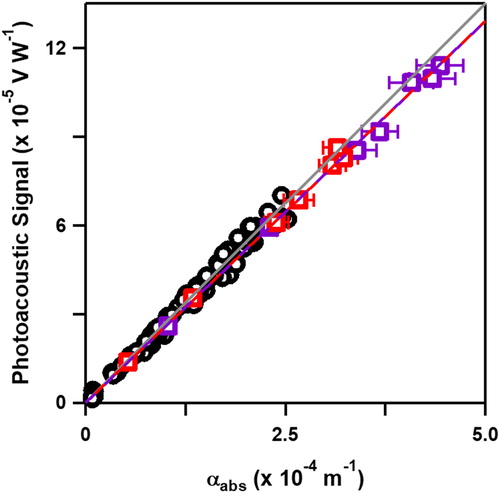
The determination of CB MAC as a function of Dm and mp at multiple λ may enable its use for PAS calibration. This was tested by comparison of CB and H2O vapor calibrations using a previously uncalibrated photoacoustic spectrometer (combination of photoacoustic resonator and microphone) (Havey et al. Citation2010). The H2O vapor data was collected over several consecutive days (>10 h of data acquisition time) due to the time required for changing and stabilizing the source. CB measurements were acquired in less than 2 h (90 min of data acquisition time). The microphone signal was measured as a function of αAbs for H2O vapor at λ = 725 nm and 820 nm and using Dm and mp-selected CB at λ = 405 nm and 660 nm. The αAbs of CB was determined using the second form of EquationEquation (1)(1)
(1) , αAbs = N * mp* MACT, where MACT at each λ is shown in , and H2O vapor calibration was previously outlined using HITRAN spectral line intensities (Radney and Zangmeister Citation2015). The data is shown in for both H2O vapor and CB, where the slope (CS) defines the product of the resonator cell constant and microphone responsivity (Havey et al. Citation2010; Bueno et al. Citation2011). Uncertainties in signal correspond to the standard deviation of multiple measurements while uncertainties in αabs represent the expanded calculated uncertainty; for RH, this includes probe precision (±0.8% RH, ±0.1 K). For CB, the uncertainty includes the combination of the measured standard deviation in mp and N and MAC uncertainty (see ). The measured CS were 27.3 ± 0.7 m · V · W−1 and 26.2 ± 0.6 m · V · W−1 for H2O vapor and CB, respectively, within 5 percent and 2σ of one another.
Figure 6. Photoacoustic microphone signal (V W−1) as a function of αAbs (m−1) for H2O vapor (black open circles) at λ = 725 nm and 820 nm and Dm and mp-selected CB at λ = 405 nm (open purple squares) and λ = 660 nm (open red squares). Dashed lines are linear fits of H2O vapor (black circles) and CB data (dashed red and purple). Uncertainties in x- and y- correspond to the standard deviations of multiple measurements and expanded uncertainties in calculated αabs; see discussion in text.
Using CB for photoacoustic calibration was more than an order of magnitude faster compared to H2O vapor, and its use is likely only limited by the day-to-day variation of CB aerosol generation, Dm-selection, and mp-classification. Using a similar method of classification, the measured day-to-day variation is best shown by the relative standard deviation (RSD, = 100 × 1σ/) in MAC at the two wavelengths used for calibration. The 1σ RSD is 6.1% and 5.5% at λ = 405 nm and 660 nm, respectively, for data collected across multiple years and CB production lots. It is reasonable that this represents an upper limit, as average the inter-day RSD of CB MAC (average of 3 to 5 consecutive measurements) are 2.1% and 2.5% at λ = 405 nm and 660 nm across all Dm, respectively.
Using the presented data, it is possible to establish some protocols for using CB for instrument evaluation. Unless otherwise noted, the presented data was collected using a suspension concentration of 1.0 mg mL−1. Using this suspension concentration and particle drying ensures comparability with the presented data. It is important to highlight that the CB spectroscopic data used for evaluation and calibration were measured using MACT values derived from Dm and mp-selected aerosol. The data shown and discussed in this study should only be used with a similar aerosol classification (both mobility and mass) method to minimize the presence of multiply charged particles.
Using this suspension concentration and classification methods, it was shown that an aerosol with well characterized λ and Dm dependent spectral properties across a broad suspension concentration range enables the evaluation of instrumental response and performance, and may give guidance in the collection, reporting and quantification in future measured aerosol properties. The presented data focuses only on spectroscopic and filter-based methods. The use of CB should not be limited to these techniques and it is envisioned that CB may be used for other techniques not investigated here where particles that mimic mature, collapsed BC may be of interest, such as evaluation of the calculated mp using particle incandescence methods (e.g., SP2) as a function of Dm (Bambha and Michelsen Citation2015). Future investigations with CB will focus its use for interlaboratory comparability of its spectroscopic properties using Dm and both Dm and mp-selection.
Conclusions
The reported data demonstrate the characterization and use of a nontoxic, water dispersible CB material with similar elemental, morphological, and spectroscopic properties to those observed in highly absorbing carbonaceous atmospheric aerosol. Using this material under well-controlled conditions enables instruments and instrumental methods to be quantitatively evaluated. This was demonstrated by comparing the measured mass concentration (M) of photoacoustic spectroscopy and filter-based attenuation measurements to a particle counting method. The measurements demonstrate that CB can be used to quantitatively measure method deviations. These results show that CB may be used to intercompare methods under well-controlled conditions and enable inter-method quantification of future aerosol measurements.
Supplemental Material
Download MS Word (45.8 KB)Disclosure statement
No potential conflict of interest was reported by the authors.
Notes
1 Certain commercial equipment, instruments, or materials (or suppliers, or software, …) are identified in this article to foster understanding. Such identification does not imply recommendation or endorsement by the National Institute of Standards and Technology, nor does it imply that the materials or equipment identified are necessarily the best available for the purpose.
Related Research Data
References
- Andreae, M. O., and V. Ramanathan. 2013. Climate change. Climate’s dark forcings. Science 340 (6130):280–281. doi: 10.1126/science.1235731.
- Arnott, W. P., K. Hamasha, H. Moosmuller, P. J. Sheridan, and J. A. Ogren. 2005. Towards aerosol light-absorption measurements with a 7-wavelength aethalometer: Evaluation with a photoacoustic instrument and 3-wavelength nephelometer. Aerosol Sci. Technol. 39 (1):17–29. doi: 10.1080/027868290901972.
- Bambha, R. P., and H. A. Michelsen. 2015. Effects of aggregate morphology and size on laser-induced incandescence and scattering from black carbon (mature soot). J. Aerosol Sci. 88:159–181. doi: 10.1016/j.jaerosci.2015.06.006.
- Baumgardner, D., O. Popovicheva, J. Allan, V. Bernardoni, J. Cao, F. Cavalli, J. Cozic, E. Diapouli, K. Eleftheriadis, P. J. Genberg, et al. 2012. Soot reference materials for instrument calibration and intercomparisons: A workshop summary with recommendations. Atmos. Meas. Tech. 5 (8):1869–1887.
- Bluvshtein, N., J. M. Flores, Q. F. He, E. Segre, L. Segev, N. N. Hong, A. Donohue, J. N. Hilfiker, and Y. Rudich. 2017. Calibration of a multi-pass photoacoustic spectrometer cell using light-absorbing aerosols. Atmos. Meas. Tech. 10 (3):1203–1213. doi: 10.5194/amt-10-1203-2017.
- Bond, T. C., and R. W. Bergstrom. 2006. Light absorption by carbonaceous particles: An investigative review. Aerosol Sci. Technol. 40 (1):27–67. doi: 10.1080/02786820500421521.
- Bond, T. C., S. J. Doherty, D. W. Fahey, P. M. Forster, T. Berntsen, B. J. DeAngelo, M. G. Flanner, S. Ghan, B. Kärcher, D. Koch, et al. 2013. Bounding the role of black carbon in the climate system: A scientific assessment. J. Geophys. Res.: Atmos. 118:5380–5552. doi: 10.1002/jgrd.50171.
- Bueno, P. A., D. K. Havey, G. W. Mulholland, J. T. Hodges, K. A. Gillis, R. R. Dickerson, and M. R. Zachariah. 2011. Photoacoustic measurements of amplification of the absorption cross section for coated soot aerosols. Aerosol Sci. Technol. 45 (10):1217–1230. doi: 10.1080/02786826.2011.587477.
- Colbeck, I., B. Atkinson, and Y. Johar. 1997. The morphology and optical properties of soot produced by different fuels. J. Aerosol Sci. 28 (5):715–723. doi: 10.1016/S0021-8502(96)00466-1.
- Conny, J. M., D. B. Klinedinst, S. A. Wight, and J. L. Paulsen. 2003. Optimizing thermal-optical methods for measuring atmospheric elemental (black) carbon: A response surface study. Aerosol Sci. Technol. 37 (9):703–723. doi: 10.1080/02786820300920.
- Cross, E. S., T. B. Onasch, A. Ahern, W. Wrobel, J. G. Slowik, J. Olfert, D. A. Lack, P. Massoli, C. D. Cappa, J. P. Schwarz, et al. 2010. Soot particle studies instrument inter-comparison project overview. Aerosol Sci. Technol. 44 (8):592–611. doi: 10.1080/02786826.2010.482113.
- Davies, N. W., M. I. Cotterell, C. Fox, K. Szpek, J. M. Haywood, and J. M. Langridge. 2018. On the accuracy of aerosol photoacoustic spectrometer calibrations using absorption by ozone. Atmos. Meas. Tech. 11 (4):2313–2324. doi: 10.5194/amt-11-2313-2018.
- di Stasio, S., and A. Braun. 2006. Comparative NEXAFS study on soot obtained from an ethylene/air flame, a diesel engine, and graphite. Energy Fuels 20:187–194. doi: 10.1021/ef058019g.
- Gordon, I. E., L. S. Rothman, C. Hill, R. V. Kochanov, Y. Tan, P. F. Bernath, M. Birk, V. Boudon, A. Campargue, K. V. Chance, et al. 2017. The HITRAN2016 molecular spectroscopic database. J. Quant. Spectrosc. Radiat. Transf. 203:3–69. doi: 10.1016/j.jqsrt.2017.06.038.
- Groves, K. S., and A. F. Tuck. 1979. Simultaneous effects of CO2 and chlorofluoromethanes on stratospheric ozone. Nature 280 (5718):127–129. doi: 10.1038/280127a0.
- Havey, D. K., P. A. Bueno, K. A. Gillis, J. T. Hodges, G. W. Mulholland, R. D. van Zee, and M. R. Zachariah. 2010. Photoacoustic spectrometer with a calculable cell constant for measurements of gases and aerosols. Anal. Chem. 82 (19):7935–7942. doi: 10.1021/ac101366e.
- Havey, D. K., D. A. Long, M. Okumura, C. E. Miller, and J. T. Hodges. 2009. Ultra-sensitive optical measurements of high-j transitions in the O-2 a-band. Chem.Phys. Lett. 483 (1–3):49–54. doi: 10.1016/j.cplett.2009.10.067.
- IPCC. 2013. Climate change 2013: The physical science basis. In Contribution of working group I to the fifth assessment report of the intergovernmental panel on climate change. Cambridge, UK and New York, NY: Cambridge University Press.
- Kirchstetter, T. W., and T. Novakov. 2007. Controlled generation of black carbon particles from a diffusion flame and applications in evaluating black carbon measurement methods. Atmos. Environ. 41 (9):1874–1888. doi: 10.1016/j.atmosenv.2006.10.067.
- Laborde, M., P. Mertes, P. Zieger, J. Dommen, U. Baltensperger, and M. Gysel. 2012. Sensitivity of the single particle soot photometer to different black carbon types. Atmos. Meas. Tech. 5 (5):1031–1043. doi: 10.5194/amt-5-1031-2012.
- Lack, D. A., E. R. Lovejoy, T. Baynard, A. Pettersson, and A. R. Ravishankara. 2006. Aerosol absorption measurement using photoacoustic spectroscopy: Sensitivity, calibration, and uncertainty developments. Aerosol Sci. Technol. 40 (9):697–708. doi: 10.1080/02786820600803917.
- Lam, N. L., Y. Chen, C. Weyant, C. Venkataraman, P. Sadavarte, M. A. Johnson, K. R. Smith, B. T. Brem, J. Arineitwe, J. E. Ellis, and T. C. Bond. 2012. Household light makes global heat: High black carbon emissions from kerosene wick lamps. Environ. Sci. Technol. 46:13531–13538. doi: 10.1021/es302697h.
- Landrigan, P. J., R. Fuller, N. J. R. Acosta, O. Adeyi, R. Arnold, N. Basu, A. B. Balde, R. Bertollini, S. Bose-O'Reilly, J. I. Boufford, et al. 2018. The lancet commission on pollution and health. Lancet 391 (10119):462–512. doi: 10.1016/S0140-6736(17)32345-0.
- Langridge, J. M., M. S. Richardson, D. A. Lack, C. A. Brock, and D. M. Murphy. 2013. Limitations of the photoacoustic technique for aerosol absorption measurement at high relative humidity. Aerosol Sci. Technol. 47 (11):1163–1173. doi: 10.1080/02786826.2013.827324.
- Lelieveld, J., J. S. Evans, M. Fnais, D. Giannadaki, and A. Pozzer. 2015. The contribution of outdoor air pollution sources to premature mortality on a global scale. Nature 525 (7569):367–371. doi: 10.1038/nature15371.
- Lim, S., X. Fain, M. Zanatta, J. Cozic, J. L. Jaffrezo, P. Ginot, and P. Laj. 2014. Refractory black carbon mass concentrations in snow and ice: Method evaluation and inter-comparison with elemental carbon measurement. Atmos. Meas. Tech. 7 (10):3307–3324. doi: 10.5194/amt-7-3307-2014.
- Long, D. A., G. W. Truong, J. T. Hodges, and C. E. Miller. 2013. Absolute (CO2)-C-12-O-16 transition frequencies at the khz-level from 1.6 to 7.8 mm. J. Quant. Spectrosc. Radiat. Transf. 130:112–115. doi: 10.1016/j.jqsrt.2013.07.001.
- Mason, B., N. L. Wagner, G. Adler, E. Andrews, C. A. Brock, T. D. Gordon, D. A. Lack, A. E. Perring, M. S. Richardson, J. P. Schwarz, et al. 2018. An intercomparison of aerosol absorption measurements conducted during the SEAC(4)RS campaign. Aerosol Sci. Technol. 52 (9):1012–1027. doi: 10.1080/02786826.2018.1500012.
- Mishchenko, M. I., D. W. Mackowski, and L. D. Travis. 1995. Scattering of light by bispheres with touching and separated components. Appl. Opt. 34 (21):4589–4599. doi: 10.1364/AO.34.004589.
- Moore, R. H., L. D. Ziemba, D. Dutcher, A. J. Beyersdorf, K. Chan, S. Crumeyrolle, T. M. Raymond, K. L. Thornhill, E. L. Winstead, and B. E. Anderson. 2014. Mapping the operation of the miniature combustion aerosol standard (Mini-CAST) soot generator. Aerosol Sci. Technol. 48 (5):467–479. doi: 10.1080/02786826.2014.890694.
- Moosmüller, H., and W. P. Arnott. 2009. Particle optics in the rayleigh regime. J. Air Waste Manage. Assoc. 59 (9):1028–1031. doi: 10.3155/1047-3289.59.9.1028.
- Moosmüller, H., R. K. Chakrabarty, and W. P. Arnott. 2009. Aerosol light absorption and its measurement: A review. J. Quant. Spectrosc. Radiat. Transf. 110:844–878. doi: 10.1016/j.jqsrt.2009.02.035.
- Moteki, N., and Y. Kondo. 2010. Dependence of laser-induced incandescence on physical properties of black carbon aerosols: Measurements and theoretical interpretation. Aerosol Sci. Technol. 44 (8):663–675. doi: 10.1080/02786826.2010.484450.
- Muller, T., J. S. Henzing, G. de Leeuw, A. Wiedensohler, A. Alastuey, H. Angelov, M. Bizjak, M. C. Coen, J. E. Engstrom, C. Gruening, et al. 2011. Characterization and intercomparison of aerosol absorption photometers: Result of two intercomparison workshops. Atmos. Meas. Tech. 4:245–268. doi: 10.5194/amt-4-245-2011.
- NIST. 2011. Workshop on aerosol metrology needs for climate science. Gaithersburg, MD.
- Radney, J. G., X. Ma, K. A. Gillis, M. R. Zachariah, J. T. Hodges, and C. D. Zangmeister. 2013. Direct measurements of mass-specific optical cross sections of single component aerosol mixtures. Anal. Chem. 85 (17):8319–8325. doi: 10.1021/ac401645y.
- Radney, J. G., and C. D. Zangmeister. 2015. Measurement of gas and aerosol phase absorption spectra across the visible and near-ir using supercontinuum photoacoustic spectroscopy. Anal. Chem. 87 (14):7356–7363. doi: 10.1021/acs.analchem.5b01541.
- Radney, J. G., and C. D. Zangmeister. 2017. Light source effects on aerosol photoacoustic spectroscopy measurements. J. Quant. Spectrosc. Radiat. Transf. 187:145–149. doi: 10.1016/j.jqsrt.2016.09.026.
- Radney, J. G., and C. D. Zangmeister. 2018. Comparing aerosol refractive indices retrieved from full distribution and size- and mass-selected measurements. J. Quant. Spectrosc. Radiat. Transf. 220:52–66. doi: 10.1016/j.jqsrt.2018.08.021.
- Robichaud, D. J., J. T. Hodges, L. R. Brown, D. Lisak, P. Masłowski, L. Y. Yeung, M. Okumura, and C. E. Miller. 2008. Experimental intensity and lineshape parameters of the oxygen a-band using frequency-stabilized cavity ring-down spectroscopy. J. Mol. Spectrosc. 248 (1):1–13. doi: 10.1016/j.jms.2007.10.010.
- Schmidt, M. W. I., J. O. Skjemstad, C. I. Czimczik, B. Glaser, K. M. Prentice, Y. Gelinas, and T. A. J. Kuhlbusch. 2001. Comparative analysis of black carbon in soils. Global Biogeochem. Cycles 15 (1):163–167. doi: 10.1029/2000GB001284.
- Schnaiter, M., M. Gimmler, I. Llamas, C. Linke, C. Jäger, and H. Mutschke. 2006. Strong spectral dependence of light absorption by organic carbon particles formed by propane combustion. Atmos. Chem. Phys. 6 (10):2981–2990. doi: 10.5194/acp-6-2981-2006.
- Schwarz, J. P., S. J. Doherty, F. Li, S. T. Ruggiero, C. E. Tanner, A. E. Perring, R. S. Gao, and D. W. Fahey. 2012. Assessing single particle soot photometer and integrating sphere/integrating sandwich spectrophotometer measurement techniques for quantifying black carbon concentration in snow. Atmos. Meas. Tech. 5 (11):2581–2592. doi: 10.5194/amt-5-2581-2012.
- Slowik, J. G., E. S. Cross, J. H. Han, P. Davidovits, T. B. Onasch, J. T. Jayne, L. R. WilliamS, M. R. Canagaratna, D. R. Worsnop, R. K. Chakrabarty, et al. 2007. An inter-comparison of instruments measuring black carbon content of soot particles. Aerosol Sci. Technol. 41 (3):295–314. doi: 10.1080/02786820701197078.
- You, R., J. G. Radney, M. R. Zachariah, and C. D. Zangmeister. 2016. Measured wavelength-dependent absorption enhancement of internally mixed black carbon with absorbing and nonabsorbing materials. Environ. Sci. Technol. 50:7982–7990. doi: 10.1021/acs.est.6b01473.
- Zangmeister, C. D., and J. G. Radney. 2018. Multiphase environmental chemistry in the atmosphere. Washington, DC: ACS.
- Zangmeister, C. D., J. G. Radney, L. T. Dockery, J. T. Young, X. F. Ma, R. A. You, and M. R. Zachariah. 2014. Packing density of rigid aggregates is independent of scale. Proc. Natl. Acad. Sci. U. S. A. 111 (25):9037–9041. doi: 10.1073/pnas.1403768111.
- Zangmeister, C. D., R. You, E. M. Lunny, A. E. Jacobson, M. Okumura, M. R. Zachariah, and J. G. Radney. 2018. Measured in-situ mass absorption spectra for nine forms of highly-absorbing carbonaceous aerosol. Carbon 136:85–93. doi: 10.1016/j.carbon.2018.04.057.