
 ?Mathematical formulae have been encoded as MathML and are displayed in this HTML version using MathJax in order to improve their display. Uncheck the box to turn MathJax off. This feature requires Javascript. Click on a formula to zoom.
Abstract
Lung deposited surface area (LDSA) is a relatively new metric that has been argued to be more accurate at predicting health effects from aerosol exposure. For typical atmospheric aerosol, the LDSA concentration depends mainly on the concentration of ultrafine particles (e.g. vehicular exhaust emissions and residential wood combustion) and therefore optical methods cannot be used to measure and quantify it. The objective of this study was to investigate and describe typical characteristics of LDSA under different urban environments and evaluate how a diffusion charging-based Pegasor AQ Urban sensor (Pegasor Ltd., Finland) can be used as an alternative to optical sensors when assessing local combustion emissions and respective LDSA concentrations. Long-term (12 months) sensor measurements of LDSA were carried out at three distinctly different measurement sites (four sensor nodes) in the Helsinki metropolitan area, Finland. The sites were affected mainly by vehicular exhaust emission (street canyon and urban background stations) and by residential wood combustion (two detached housing area stations). The results showed that the accuracy of the AQ Urban was good (R2 = 0.90) for the measurement of LDSA when compared to differential mobility particle sizer. The mean concentrations of LDSA were more than twice as high at the street canyon (mean 22 µm2 cm−3) site when compared to the urban background site (mean 9.4 µm2 cm−3). In the detached housing area, the mean concentrations were 12 µm2 cm−3, and wood combustion typically caused high LDSA peaks in the evenings. High correlations and similar diurnal cycles were observed for the LDSA and black carbon at street canyon and urban background stations. The utilization of a small-scale sensor network (four nodes) showed that the cross-station variability in hourly LDSA concentrations was significant in every site, even within the same detached housing area (distance between the two sites ∼670 m).
EDITOR:
Introduction
Particulate matter (PM) has been known for decades to cause adverse health effects to humans (Dockery et al. Citation1993). The association of PM2.5 (mass of particles under 2.5 µm in size) with cardiovascular and respiratory diseases has been characterized by multiple epidemiological studies (e.g. Brook et al. Citation2010; Hoek et al. Citation2013; Silva et al. Citation2013) and approximately 391,000 premature deaths were attributable to PM2.5 exposure in the EU in 2015 (EEA Citation2018). The explicit processes driving these harmful health effects, however, still remain partly unknown (Kelly and Fussell Citation2012; Lelieveld et al. Citation2015).
Besides particulate mass (e.g. PM2.5), it has been suggested and demonstrated that particle surface related chemistry and, consequently, the surface area of a particle could be an important factor when considering the harmfulness of PM (Brown et al. Citation2001; Oberdörster et al. Citation2005). To assess this, a parameter known as lung deposited surface area (LDSA) has been developed and used in air quality studies to describe the total surface area of PM penetrating to the deepest parts of lungs (i.e. alveolar region) (e.g. Dal Maso et al. Citation2016; Pirjola et al. Citation2017; Hennig et al. Citation2018). Unlike conventional PM2.5 and PM10 parameters with predefined daily mean threshold values, LDSA parameter remains unregulated and hence largely unmonitored (European Council Citation2008).
Concentration levels of LDSA are mainly driven by the number of particles smaller than 400 nm (Asbach et al. Citation2009). This is due to their favorable lung deposition fraction characteristics and, especially in urban environments, high number concentration. Urban environments feature anthropogenic sources such as vehicular exhaust emissions and residential wood combustion which typically produce high numbers of small particles (Tissari et al. Citation2008; Karjalainen et al. Citation2016). Small particles cannot be measured reliably with methods relying solely on optical detection (e.g. no artificial growing of particles) as the light scattering intensity of these particles is weak (Kulkarni et al. Citation2011). Hence a different approach is needed. One such approach is a so-called diffusion charging-based technique where particles are charged using a unipolar corona charger (Fissan et al. Citation2006). Formed ions are driven onto the surfaces of particles by diffusional forces, and a current signal can be measured by collecting the particles with a Faraday cup electrometer or by using so-called measurement of escaping current. This method enables measurement of ultrafine particles and, more specifically, the LDSA concentration with good accuracy (Todea et al. Citation2015). Currently, several instruments and sensors (e.g. miniDisc by Testo Inc., Pegasor AQ Urban by Pegasor Ltd., and Partector by naneos Ltd.) are available which utilize the aforesaid technique as their operation principle (Fierz et al. Citation2011, Citation2014; Rostedt et al. Citation2014).
Regardless of the monitored parameter (e.g. LDSA, PM2.5, PM10, gaseous pollutants), a growing interest in higher spatiotemporal air quality data exists (Snyder et al. Citation2013; Kumar et al. Citation2015; Rai et al. Citation2017; Morawska et al. Citation2018). It has been proposed that by utilizing recent technological advancements (i.e. air quality sensors) improvements in spatial coverage of measurements could be made. Increased data resolution would be particularly beneficial in, for example, local dispersion model development and validation, air quality forecasting, and in epidemiological health assessments. Considering PM measurements, few sensor network experiments have been conducted previously with optical sensors ( Gao et al. Citation2015; Jiao et al. Citation2016). However, as the optical sensors cannot measure ultrafine particles, these studies have focused on mass based (i.e. PM2.5) measurements. Single measurements of LDSA have been conducted previously in different ambient environments, for example, in Barcelona (Reche et al. Citation2015), Leicester (Hama et al. Citation2017), and Ruhr (Hennig et al. Citation2018) but to our knowledge there are no urban sensor network studies demonstrating the utilization of diffusion charged-based sensors to measurements of LDSA.
Long-term (12 months) sensor measurements of LDSA were conducted at three different measurement sites (four sensor nodes) in the Helsinki metropolitan area (HMA), Finland. The measurement sites represented different ambient conditions found within the urban area; a street canyon station next to a high traffic volume street, urban background station at a local sports field, and two detached housing area stations which were affected by residential wood combustion. The aim of this study was to quantify the site specific characteristics of LDSA concentrations using diffusion charging-based Pegasor AQ Urban sensors and, furthermore, demonstrate the suitability of these sensors to detection of local ultrafine particle emissions (residential wood combustion, traffic and coffee roaster). This study also aimed to showcase how a group of LDSA sensors could be utilized in a functional sensor network when addressing local variability of LDSA.
Methods
Measurement sites
The HMA, consisting of four cities (Helsinki, Espoo, Vantaa, and Kauniainen), is situated in southern Finland in the coastal area of the Baltic Sea. The main sources of submicron PM in HMA are residential wood combustion, vehicular exhaust emissions from traffic, long-range transport, and secondary aerosol formation (e.g. Saarikoski et al. Citation2008; Niemi et al. Citation2009; Timonen et al. Citation2013; Carbone et al. Citation2014; Pirjola et al. Citation2017). The measurements were conducted at four different measurement sites in HMA. Measurement sites were chosen so that they represented different urban environments (traffic, residential wood combustion, urban background, ). The measurement stations were operated by the Helsinki Region Environmental Services Authority (HSY).
Figure 1. Locations of the measurement stations within the HMA.
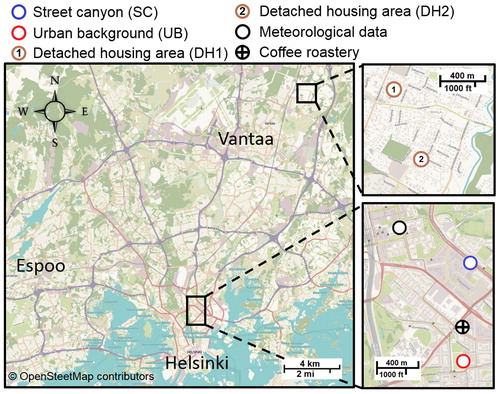
The Mäkelänkatu supersite measurement station is located in a busy street canyon (Mäkelänkatu 50, Helsinki, hereafter referred as street canyon, SC). The station is located in a street canyon at the kerbside of one of the main roads of the city, and air quality is strongly influenced by traffic in that station (Rönkkö et al. Citation2017). The traffic volume of Mäkelänkatu street was 28,000 vehicles per workday in 2016 (statistics from the City of Helsinki). The proportion of heavy duty vehicles was 11% and speed limit 50 km/h.
Kallio station (Helsinginkatu 25, Helsinki, hereafter referred as urban background, UB) is an urban background station situated on the edge of the sports field approximately 1.5 km from Helsinki downtown. Distance to nearest busy roads are 80 m (Helsinginkatu, 5000 vehicles per workday) and 300 m (Sturenkatu, 25800 vehicles per workday), and the typically observed PM concentrations at Kallio are lower than in the vicinity of busy roads. A coffee roaster is located approximately 320 m north (at 0°/360°) of the station which periodically produces organic particles of ∼100 nm in size (Carbone et al. Citation2014). Distance between the SC and UB stations is approximately 970 m.
Rekola 1 (Irmelintie 9, Vantaa, hereafter referred as detached housing area 1, DH1) and Rekola 2 (Laurantie 37, Vantaa, hereafter referred as detached housing area 2, DH2) stations are situated in a small-house area in Vantaa, Finland. The distance between the stations is approximately 670 m. The sites are surrounded by detached houses, and air quality in Rekola is known to be strongly affected by emissions from residential wood combustion (Helin et al. Citation2018).
Mäkelänkatu supersite, Kallio and Rekola 1 are fully equipped air quality stations with aerosol (PM2.5, PM10, black carbon) and trace gas (NOX, O3) measurements, whereas Rekola 2 site is a sensor site with only Pegasor AQ Urban sensor. The meteorological data were taken from Pasila mast (78 m above sea level). These data are considered to represent the general meteorological conditions in the metropolitan area.
Pegasor AQ Urban
The Pegasor AQ Urban (Pegasor Ltd., Finland) is a commercial aerosol instrument that can be used as a stand-alone sensor in an urban air quality sensor network. Price-wise the AQ Urban can be perceived as a mid-cost instrument, although no official price classifications exit. The instrument is best suitable for the measurement of the alveolar LDSA concentration of particles, but the output signal of the instrument can also be converted to the total particle number concentration or the total particle PM2.5 mass concentration if the measured size distribution is primarily dominated by small particles (<400 nm). In reality, this conversion is not possible under typical ambient conditions, and furthermore, is applicable only in specific occasions, for example, in engine exhaust emission measurements (Ntziachristos et al. Citation2013). The lower limit of the particle size range of the instrument can be adjusted by changing a trap voltage. In the measurements of this study, it was adjusted to be 10 nm and thus covering the most relevant size range of ultrafine particles existing in urban air. In terms of total particle mass, the instrument can be used in a wide concentration range from 1 µg m−3 up to 100 mg m−3.
The sensor unit and the core of the Pegasor AQ Urban is practically another instrument called a Pegasor PPS-M sensor (Pegasor Ltd., Finland) originally designed for automotive exhaust emission measurements (see e.g. Maricq Citation2013; Ntziachristos et al. Citation2013; Amanatidis et al. Citation2016, Citation2017). The operation of the sensor is based on diffusion charging of particles and the measurement of electric current without the collection of particles. The diffusion charging of particles is carried out by a corona-ionized flow that is mixed with the ambient sample air in an ejector diluter inside the sensor. The non-collective characteristic as well as the ejector type mixing of corona-ionized and ambient air makes the sensor to have a very low need of maintenance and a stable performance in long term measurements. A detailed description of the operation principle and response characterization is found in a previous study by Rostedt et al. (Citation2014).
The Pegasor AQ Urban consists of a weatherproof cover, clean air supply, and a sensor unit. The dimensions of the instrument are 320 mm × 250 mm × 1000 mm. Data transfer can be done with Modbus over Ethernet or, additionally, wirelessly over 3/4 G modem. In order to dry the aerosol sample and prevent interference from humidity, the sampling lines and the sensor unit are heated 40 °C above the ambient temperature. The heating also prevents any water condensation inside the sensor. The AQ Urban has been designed for standalone outdoor operation, and its response to LDSA is not affected by changing meteorological factors. The factory calibration of the instrument is based on reference number concentration aerosol, and response to LDSA is determined with 50 nm sized particles. Validation of the calibration is done by comparing the AQ Urban to other diffusion charging-based LDSA measurement devices. The instrument sensitivity with respect to LDSA is 0.215 µm2 cm−3 fA−1 with the electrometer sensitivity being in the low fA range at 1 Hz operation. Better sensitivity can be achieved with longer integration times. Nominal integration time is 2 min but can be adjusted freely. According to the manufacturer, the internal precision of the AQ Urban is ± 3%, but this was not tested prior the campaign.
The Pegasor PPS-M sensor was used in ambient measurements for the first time in Helsinki in two different urban environments by Järvinen et al. (Citation2015). In addition, Pegasor PPS-M sensors have been used in a heavily polluted urban area in Beijing during several months (Dal Maso et al. Citation2016). All the improvements suggested in these two studies (Järvinen et al., Citation2015; Dal Maso et al., Citation2016) for the performance of the Pegasor PPS-M sensor for long-term ambient measurements have been taken into account in designing the Pegasor AQ Urban, including the trap voltage settings and heating of the sensor unit. The use of Pegasor AQ Urban in urban air has not yet been reported much. Kuuluvainen et al. (Citation2018) used two Pegasor AQ Urban devices during a two-week period in an urban street canyon and at an urban background measurement station, and Kuula et al. (Citation2018) used one AQ Urban in a 3-month long campaign in an urban street canyon station. These studies also found that the output signal of the Pegasor AQ Urban correlated well with other devices measuring LDSA concentrations such as the Partector and miniDisc.
Reference instruments
A Differential Mobility Particle Sizer (DMPS) was used as a reference instrument to assess the accuracy of the Pegasor AQ Urban sensor. It measured particle size distributions from 6 to 800 nm using a Vienna type Differential Mobility Analyzer and an Airmodus A20 model Condensation Particle Counter. The DMPS was only available at the SC station. Black carbon (BC) was measured with Multiangle Absorption Photometer (MAAP) model 5012 (SC and UB stations and the last half of the campaign year at DH1 station, Thermo Fisher Scientific Inc., USA) and with a AE33 Aethalometer (DH1 station during the first half of the campaign year, Magee Scientific Co., USA). The results of these two instruments were unified by multiplying the AE33 BC values with a constant of 0.75. The AE33 and MAAP result comparison and the appropriateness of this method has been previously demonstrated by Helin et al. (Citation2018). Particle mass measurements (PM2.5) were conducted with Tapered Element Oscillating Microbalance model 1405 D (SC and UB stations, Thermo Fisher Scientific Inc., USA) and with beta-attenuation based FH 62 I-R (DH1 station, Thermo Fisher Scientific Inc., USA). NOx concentration were measured with Horiba Apna 370 (SC station, HORIBA Ltd., USA), Horiba Apna 360 (DH1 station, HORIBA Ltd., USA) and with Thermo 42i (UB station, Thermo Fisher Scientific Inc., USA). Meteorological (temperature and relative humidity) data at Pasila mast were recorded with Vaisala HMP155 (Vaisala Ltd., Finland), and wind direction and speed was recorded with Vaisala WMT703 (Vaisala Ltd., Finland).
Data processing and analysis
Data quality assurance of the AQ Urban was based on its self-diagnostics program. The program monitors for different error states (such as unstable system air flow) and flags these to the user when detected. Along with this, regular surveillance and monitoring of the instruments was done by the on duty Air Quality Officer of HSY.
The LDSA values of the DMPS were calculated by first counting the number of particles in each size bin and then multiplying the number of particles with the specific alveolar deposition fraction of the given particle size. The total surface area of the deposited particles was then calculated accordingly. Alveolar deposition fractions for different particle sizes have been discussed and described in International Commission for Radiological Protection report (Bair Citation1994), and the alveolar deposition fraction curve together with Pegasor AQ Urban response curve is shown in supplemental Figure S1. According to Hinds (Citation1999), the alveolar deposition fraction curve can be expressed as (EquationEquation (1)(1)
(1) )
(1)
(1)
where DFAL is the alveolar deposition fraction and
is the physical particle diameter in micrometers. Particles were assumed to be spherical in the calculations of LDSA and, therefore, particle mobile diameter (
) of the DMPS was used in the place of
(EquationEquation (1)
(1)
(1) ) as such. Moreover, the inversion of the DMPS data accounts for multiply charged particles.
The highest alveolar deposition rates are found for particles of 10–30 nm in size (max. deposition rate ∼48%). However, size range of ∼80–100 nm is particularly important in respect to LDSA concentrations since the surface area of particles at these sizes is typically much higher than at 10 nm, for example (surface area α Dp2). Previous studies have shown that fresh particles resulting from vehicular exhaust emissions and residential wood combustion usually compose of <30 and ∼ 50–200 nm particles, respectively, in terms of particle number concentration(e.g.; Brines et al. Citation2014). The similarity of the Pegasor AQ Urban response curve and the alveolar deposition curve highlights the suitability of diffusion charged-based techniques to LDSA measurements.
Correlation metrics of coefficient of determination (R2), root-mean-square error (RMSE), and normalized root-mean-square error (NRMSE) were used to evaluate the accuracy of Pegasor AQ Urban. The R2, RMSE, and NRMSE values were calculated according to the equations shown below (EquationEquations (2)–(4))
(2)
(2)
where
is the sum of squared error and
is the sum of squared total.
(3)
(3)
(4)
(4)
where
is the ith sample of the reference values,
is the ith sample of the sensor value,
is the number of sample pairs, and
is the mean of the reference values.
Results and discussion
The measurements lasted from 1 February 2017 to 31 January 2018 (one full year). All data were hour averaged, and the data completeness for each individual monitor was calculated to be 85% or greater. The DH1 station was relocated at the end of 2017 which resulted in missing of January 2018 data. In general, AQ Urbans exhibited good reliability with 97% data completeness (, excl. the unit at DH1 station). The missing 3% of the AQ Urban data was due to connectivity issues and power outages. The seasonal temperatures during the measurements in Helsinki were; winter –0.8 °C (–4.6 °C), spring 4.3 °C (4.2 °C), summer 15.1 °C (16 °C), and fall 6.9 °C (5.6 °C). Mean temperatures during three previous decades (years 1981–2010) are shown in parenthesis (Pirinen et al. Citation2012). The representativeness of the year thus seems to be good for the spring, summer, and fall. However, the mean ambient temperature during the winter (February and December 2017 and January 2018) was 3.8 °C warmer than the long-term average. This could have had implications on the representativeness of the residential wood combustion activity.
Table 1. Statistics of LDSA concentration levels (units in µm2 cm−3).
Accuracy and stability of Pegasor AQ Urban
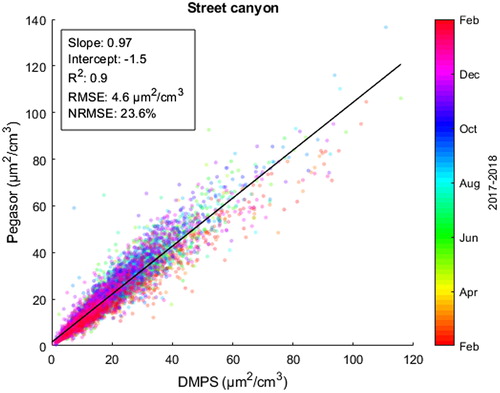
Accuracy and stability of the Pegasor AQ Urban was assessed at the SC station by comparing its results to the DMPS reference instrument. The correlation of LDSA calculated from the DMPS size distribution data and LDSA obtained from the Pegasor AQ Urban is shown in . The color of each data point indicates time of the year and illustrates the long-term stability of Pegasor AQ Urban (discussed more in the next paragraph). Calculated R2, RMSE, and NRMSE correlation metrics were 0.90, 4.1 µm2 cm−3 and 20.8%, respectively, and the linear regression fit yielded a slope of 0.97 and an intercept of –1.5. The number of comparable data points was 7448 (85% completeness, limited by the DMPS maintenance breaks). The Pegasor AQ Urban accuracy for measuring LDSA appears to be good, and the observed correlation with the reference instrument similar to what has been found previously (Kuula et al. Citation2018; R2 = 0.93). In general, it has been shown that the diffusion charging-based detection technique is an accurate method for characterizing LDSA concentrations. For example, Todea et al. (Citation2015) conducted extensive tests for several LDSA sensors and instruments (DiSCmini, Testo Inc.; nanoTracer, Philips Aerasense Inc.; Partector, Naneos Ltd.; NSAM 3550, TSI Inc.; Aerotrak, TSI Inc.) and concluded that, for particle sizes of 20–400 nm, the LDSA measurement accuracy of all devices was ± 30% or better.
Figure 2. Scatterplot of LDSA measured with the Pegasor and DMPS. The color of the data points indicates the time of the measurement.
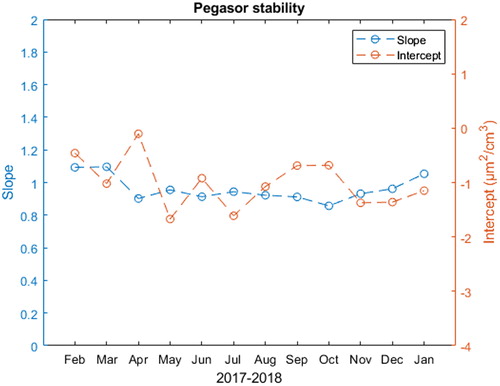
Stability-wise the Pegasor AQ Urban did not show significant drifting or other unexpected behavior (e.g. unexplainable outliers) during the 12-month long measurement period, as seen in the colors of and in . In , the calculated slope and intercept values are shown individually for each month. The maximum and minimum slope values were 1.10 (March) and 0.86 (October), and respective intercept values –0.10 (April) and –1.7 (May). During warmer months, the Pegasor was showing slightly higher values than DMPS whereas during colder months it was the opposite. These small changes in monthly slope and intercept values may be explained in part by the changes in seasonal LDSA size distributions.
Figure 3. Monthly slopes and intercepts of the DMPS and Pegasor linear regression.
General characteristics of LDSA at different measurement sites
A list of measured LDSA levels at different stations is shown in . The highest concentration levels were observed at the SC station (mean of 22 µm2 cm−3) which is reasonable considering that this site is heavily affected by the adjacent traffic. In comparison to the UB station (mean of 9.4 µm2 cm−3), the LDSA levels at SC station were more than twice as high as the closest busy roads to the UB station were located further away, approximately 80 m south and 300 m north-west. The large difference in mean concentrations highlights the utility of a sensor network when considering that the SC and UB stations were located relatively closely by each other (distance approximately 970 m). This implies that, for example, epidemiological exposure studies may have an error factor of two in the estimated outdoor exposure levels in different population subgroups which nominally live in the same region (i.e. same postal code). Due to the heterogeneity of urban areas, local variation of LDSA can only be assessed using dense sensor networks. The mean concentrations of LDSA were the same (12 µm2 cm−3) at DH1 and DH2 stations. The highest relative standard deviations (RSD, std:mean) were measured at the detached housing area, DH1 and DH2, 76.7% and 91.7%, respectively.
The LDSA values reported in this study appear to be lower than what has been measured in many other cities (). In most of the cases the measured LDSA values have been close to or higher than 30 µm2 cm−3 (in both traffic and background environments), and even up to 153.4 µm2 cm−3 at the Los Angeles traffic site. The differences between the concentrations at Los Angeles and at the SC station (this study) are likely explained by the significantly different traffic volumes (Los Angeles 10,000–11,000 vehicles per hour, SC station 28,000 per day). The proximity and intensity of the vicinity traffic seems to have a proportional effect on LDSA concentrations. Furthermore, the study of Los Angeles was performed more than 10 years ago and the LDSA emissions from traffic have probably decreased due to more efficient exhaust cleaning technologies (e.g. Pirjola et al. Citation2016). It is worth noting that the amount of publications reporting LDSA concentrations is still relatively low compared to PM2.5, for example. More values should be reported in the future in order to gain more comprehensive understanding on the variability of LDSA concentrations in different environments.
Table 2. LDSA (alveolar region) concentration levels recorded in different studies (units in µm2 cm−3).
Relationship of LDSA to other air quality parameters
The relation of LDSA to black carbon (BC), NOX, and PM2.5 are shown in supplemental Figure S2 and the associated statistics in . High correlations (R2 > 0.50) between BC and LDSA can be seen at the SC and DH1 stations and between NOX and LDSA at the SC station. The similarities between the observations of different parameters implicates a common source which for the SC site would be vehicular exhaust emissions (BC and NOX) and for the DH1 site residential wood combustion (BC). Similar results have been observed previously by, e.g. Hama et al. (Citation2017), Eeftens et al. (Citation2015) and Reche et al. (Citation2015). Instead, the correlation between the LDSA and PM2.5 was poor. The Pegasor AQ Urban does not measure particles larger than 400 nm and hence it is essentially missing the significant particle size fractions contributing to mass concentrations. The underestimation of LDSA in >400 nm particle sizes is characteristic to diffusion charging-based instruments (Asbach et al. Citation2009; Todea et al. Citation2015). This is due to gradually decreasing charging efficiency resulting from repulsive forces between highly charged particles and ions. Additionally, the diffusional forces driving the mixing of particles and ions become weaker with larger particle sizes (Hinds Citation1999).
Table 3. Statistics of LDSA relations to other parameters (units in µm2 cm−3).
The calculated slopes for the LDSA-BC correlation at the SC (13.5) and DH1 (8.4) stations are different despite the otherwise similar R2 values (0.74 and 0.65). Different slopes indicate that the main sources of BC were different (traffic and wood combustion) having different size distributions and fractions of BC. A study of Lamberg et al. (Citation2011) has shown that the geometric number mean diameter of residential wood combustion is typically 70–150 nm whereas the typical particle size for vehicular combustion can be <50 nm (Karjalainen et al. Citation2016; Sirignano et al. Citation2018). The difference in particle sizes would lead to different slopes as the response curve of the Pegasor AQ Urban (Figure S1) shows strongest signal for 10–30 nm particles. Variations between slopes intercepts are also observed during different seasons (see supplemental Table S1). Intercepts appear to be highest during summer months indicating a source which increases LDSA concentrations but not BC. Changes in seasonal slopes, on the other, are less consistent showing steepest values during winter at SC station (16.3), fall at UB stations (14.6), and summer at DH1 station (12.0). The high correlations between LDSA, BC, and NOX indicates that under certain circumstances, LDSA concentrations levels can be used to roughly estimate BC and NOX concentrations levels and short-term increasing and decreasing trends, for example. However, the different slopes and intercepts of the regression suggest that estimations of absolute values should be made cautiously, and the evaluation should be adjusted for the site specific environment and season.
Diurnal cycles and seasonality
Diurnal cycles of LDSA at different stations and during different seasons (winter: December–February; summer: June–August) are shown in . The respective diurnal cycles for spring (March–May) and fall (September–November) are shown in supplemental Figure S3, and diurnal cycles for BC, NOX, and PM2.5 are shown in supplemental Figure S4 (all seasons combined). The x-axis data points represent time ending value (e.g. 9 stands for data from 8:00–9:00). The basic features of the diurnal cycles at the SC and UB stations remain relatively similar irrespective of the season. At the SC station the diurnal cycle is bimodal having peaks during the morning in winter at 8–10 a.m. and in summer at 7–9 a.m. and during afternoon at 3–5 p.m. The bimodal peaks were associated with commuter traffic. After the afternoon rush hour the concentrations decrease steadily and reach their minimums in early morning hours at 3–5 a.m. Additionally, diurnal cycles during weekdays and weekends are shown in supplemental Figure S5 (all seasons combined). Unlike weekdays, the diurnal cycle at the SC station does not exhibit bimodality during weekends which is expected considering the lack of commuter traffic. The concentrations started to increase around 10 a.m. and stayed elevated until night. After that, they gradually decreased to their minimum at 6 a.m. Maximum concentrations were observed later in the evening and in general the concentrations were much lower which shows that vehicles are less likely to be used on weekends. These results are in line with previous studies showing that traffic has a significant impact on LDSA concentrations in urban areas (e.g. Reche et al. Citation2015; Hama et al. Citation2017). Moreover, the high correlations between LDSA, BC, and NOX are represented here in similar diurnal cycles (Figure S4). The diurnal cycle of PM2.5 is also similar, but the bimodal features are much weaker. For example, the relative concentration increase during morning rush hours (from 6 a.m. to 8 a.m.) was 52% for the PM2.5 (from 4.8 to 7.3 µg m−3). Comparably, the respective values for the LDSA, BC, and NOX were 112%, 205%, and 171%, respectively. This shows that PM2.5, as an air quality parameter, is not as responsive to vehicular emissions as the other parameters.
Figure 4. Diurnal cycles at different sites during winter (a) and summer (b). Solid continuous lines represent mean values, boxes 25th and 75th percentiles and the line inside the quantile boxes median values. Both weekday and weekend data are included.
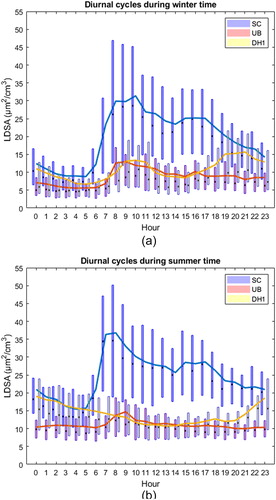
The basic features of the diurnal cycles at the UB station are similar during both winter and summer seasons (). A clear peak can be observed in the morning hours at 8–9 a.m., but contrary to the diurnal cycle of the SC station, the effect of afternoon rush hour is significantly weaker. Furthermore, the differences in weekday and weekend cycles are less drastic compared to the weekday and weekend cycle differences at the SC station (Figure S5). When compared to the SC station, the similar although attenuated characteristics of the UB station diurnal cycles are likely explained by the further distance to the nearest traffic source (closest roads 80 and 300 m away).
The most pronounced differences in seasonal diurnal cycles can be observed at the DH1 station. Here, the diurnal cycle during winter shows two separate peaks at 9–11 a.m. and at 7–9 p.m. which could be associated with morning traffic and evening residential wood combustion (Helin et al. Citation2018). However, during the summer, the diurnal cycle appears to be bowl-shaped with no observable day time peaks. The bowl-shaped cycle may be explained by the changing mixing layer height which in Finland entails larger day–night variation during summer than during the winter. In summer, the concentration levels remain low during day time due to a high mixing layer height and vice versa. The weekend-weekday variation in Figure S5 shows that the morning peak which was associable with morning traffic (seen also in Figure S4 NOX diurnal cycle) is missing during weekends (i.e. less or no commuters). Additionally, evening and late night concentrations are slightly higher during weekends which suggest that people are more likely to have late night activities (e.g. warming up sauna stoves, barbeque) during weekends.
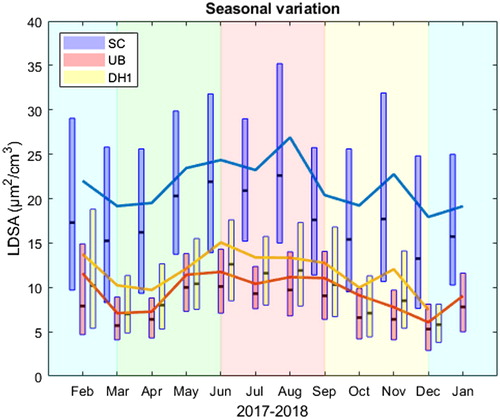
Seasonal variations of LDSA concentrations are shown in and the respective statistics in supplemental Table S2. The LDSA concentrations were elevated at all measurement stations during the summer months (June, July, and August). This appears to be counter-intuitive, especially regarding the DH1 station since residential wood combustion activity is typically lower during warmer time periods (Helin et al. Citation2018). Additionally, summer holidays are usually held in July (∼ 4 weeks) which translates into smaller traffic volumes. The lowest median LDSA concentrations are indeed observed during July at all stations but the differences to June and August are small (max. 1.7 µm2 cm−3 at SC). The seasonal LDSA size distributions, shown in Figure S6, suggest that the particle sizes are larger during summer months which consequently lead to higher LDSA concentrations. There are, however, no self-evident reasons explaining the increased average particle size. It is possible that biogenic precursor gases, which are predominantly generated during summer months, enhance secondary organic aerosol (SOA) formation and, being internally mixed with soot (e.g. BC) SOA, increased the size of particles (Zhu et al. Citation2017). Additionally, processes governing particle growth may be amplified by stronger radiation and consequent photochemistry (Dal Maso et al. Citation2005; Manninen et al. Citation2010; Ma and Birmili Citation2015).
Figure 5. Seasonality of LDSA at different measurement sites.
Sources and local variability
LDSA concentrations at UB station are shown in . Concentrations are presented as a function of wind direction (x-axis) and as a function of LDSA to BC ratio (color). The highest concentrations levels (99th percentile) are resulting mainly from ∼25° and, furthermore, are associated with particularly high LDSA to BC ratios (mean of 70.5 as opposed to 29.7). These observations may imply that those particles are originating from the local coffee roaster (shown in , distance to UB station ∼320 m) as previous studies have shown that the particles originating from the coffee roaster are organic (no BC) and typically ∼100 nm in size (Timonen et al. Citation2013; Carbone et al. Citation2014). On the other hand, the coffee roaster is located at ∼0° and not at 25° in respect to the UB station. This inconsistency could possibly be explained by the shifted wind trajectories caused by the site specific building and street configurations.
Figure 6. LDSA concentrations as a function of LDSA to BC ratio (colorbar) and as a function of wind direction (x-axis).
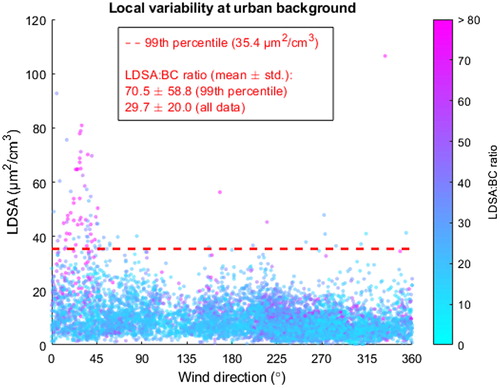
Pollution roses of measured LDSA concentrations at the UB and SC station are shown in supplemental Figure S7. As addressed above, the high concentrations at UB station are originating from ∼25° and, additionally, at wind speeds of 4 m s−1 and higher. The higher wind speed indicates that the particularly high concentration LDSA aerosol (99th percentile) is at least originating from elsewhere and not from immediate proximity. Contrary to this, the highest LDSA concentrations at the SC station are observed at wind speeds of 4 m s−1 or lower indicating a close proximity source (i.e. adjacent traffic). The prevailing wind direction in HMA is south-west which likely accounts for the south-west orientated pollution trend at the SC station.
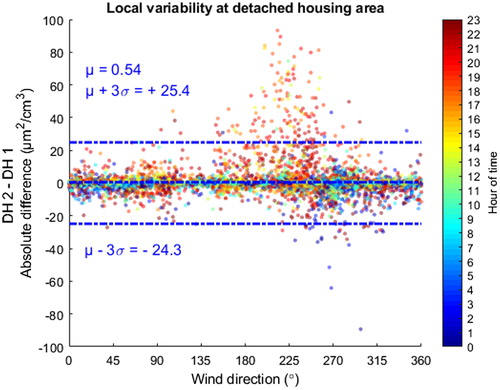
Absolute differences in measured LDSA concentrations between the DH1 and DH2 stations are shown in . The concentrations are presented as a function of wind direction (x-axis) and hour of day (color). The greatest differences are observed at wind direction ∼225° (max. +93.3 µm2 cm−3) during afternoon and evening hours (3–9 p.m.). Respectively, few data points indicate occurrences where concentrations at DH1 station have been relatively higher (min. –89.3 µm2 cm−3, at ∼270° during 0–3 a.m.). Additionally, the same data with different color code are shown in supplemental Figure S8. Here, the color signifies measured BC concentrations at DH1 station, and it can be seen that negative values (when DH1 > DH2) are predominated by higher BC values. This means that at the DH1 station high LDSA concentrations are associated with high BC values (also shown in ) and, when considering that the differences in LDSA concentrations were mostly occurring during afternoon and evening hours (3–9 p.m., no morning traffic), it is likely that the local differences between LDSA concentrations have been caused by residential wood combustion. The possible connection between high LDSA and BC concentrations at DH2 station could not be confirmed as there was no BC monitor. The pollution roses of the DH1 and DH2, shown in supplemental Figure S9, are similar excluding the high concentration peak observed at the DH2 station at 225°. This peak is observed at >10 m s−1 wind speeds which indicates a relatively distant source. Otherwise, the highest concentrations at both DH1 and DH2 stations are observed at wind speeds of 2 m s−1 or lower (close by sources).
Figure 7. Differences of measured LDSA values at DH1 and DH2 stations as a function of wind direction and hour of day. The dashed middle line represents mean and the two dashed-dotted line standard deviations multiplied by 3.
Conclusions
LDSA was measured with Pegasor AQ Urban sensor at street canyon, urban background and two detached housing area sites for 12 months in HMA. When compared to a reference instrument (DMPS), the accuracy of Pegasor AQ Urban was found to be good (R2 = 0.90), and slope and intercept values of the linear regression remained stable throughout the 12-month long measurement campaign. The Pegasor AQ Urban is well suited for continuous long-term air quality monitoring and is specifically applicable to the measurement of particles emitted from local traffic exhaust and residential wood combustion. Diffusion charging-based sensors would be a valuable addition to the list of commonly used measurement techniques as optical methods cannot be used to measure ultrafine particles or LDSA, and urban air quality is, nonetheless, heavily affected by these particles as shown in this study.
Three distinctively different measurement sites showed differences in LDSA characteristics. In spite of the close cross-station distances, source differences and local variability were shown to be observable between both street canyon and urban background stations (distance ∼970 m) and between the two detached housing area stations (distance ∼670 m). Annual concentration levels at the street canyon station were more than twice as high when compared to the urban background station. Likewise, due to the differing environments, the two stations located at the detached housing area showed clearly different diurnal cycles when compared to the street canyon and urban background stations. This was due to the frequent residential wood combustion of detached housing area at the evenings. The high local variability in LDSA concentrations highlights the need and utility of an air quality sensor network and higher spatial resolution measurement data.
LDSA can be perceived as an intermediary parameter between particle mass and particle number concentration as it cannot be simply inferred from either of those parameters. Its distinctiveness and close correlation with BC highlight its usefulness for the measurement of combustion related particles typically emitted from vehicular exhaust and residential wood combustion. Both of these sources are commonly present in urban areas, and therefore LDSA would be a valuable addition to the list of regularly monitored pollutants.
Conflict of interests
Erkka Saukko is employed by Pegasor Ltd., the manufacturer of AQ Urban.
Supplemental Material
Download PDF (715.5 KB)Acknowledgments
Long-term research co-operation and support from HSY to this project is gratefully acknowledged.
Additional information
Funding
Related Research Data
References
- Amanatidis, S., M. M. Maricq, L. Ntziachristos, and Z. Samaras. 2016. Measuring number, mass, and size of exhaust particles with diffusion chargers: The dual Pegasor Particle Sensor. J. Aerosol Sci. 92:1–15. doi:10.1016/j.jaerosci.2015.10.005.
- Amanatidis, S., M. M. Maricq, L. Ntziachristos, and Z. Samaras. 2017. Application of the dual Pegasor Particle Sensor to real-time measurement of motor vehicle exhaust PM. J. Aerosol Sci. 103:93–104. doi:10.1016/j.jaerosci.2016.10.005.
- Asbach, C., H. Fissan, B. Stahlmecke, T. A. J. Kuhlbusch, and D. Y. H. Pui. 2009. Conceptual limitations and extensions of lung-deposited nanoparticle surface area monitor (NSAM). J. Nanoparticle Res. 11 (1):101–109. doi:10.1007/s11051-008-9479-8.
- Bair, W. J. 1994. The Revised International Commission on Radiological Protection (ICRP) dosimetric model for the human respiratory tract—An overview. Ann. Occup. Hyg. 38:251–256. doi:10.1093/annhyg/38.inhaled_particles_VII.251.
- Brines, M., M. Dall’Osto, D. C. S. Beddows, R. M. Harrison, and X. Querol. 2014. Simplifying aerosol size distributions modes simultaneously detected at four monitoring sites during SAPUSS. Atmos. Chem. Phys. 14 (6):2973–2986. doi:10.5194/acp-14-2973-2014.
- Brook, R. D., S. Rajagopalan, C. A. Pope, J. R. Brook, A. Bhatnagar, A. V. Diez-Roux, F. Holguin, Y. Hong, R. V. Luepker, M. A. Mittleman, A., et al. 2010. Particulate matter air pollution and cardiovascular disease: An update to the scientific statement from the American heart association. Circulation 121 (21):2331–2378. doi:10.1161/CIR.0b013e3181dbece1.
- Brown, D. M., M. R. Wilson, W. MacNee, V. Stone, and K. Donaldson. 2001. Size-dependent proinflammatory effects of ultrafine polystyrene particles: a role for surface area and oxidative stress in the enhanced activity of ultrafines. Toxicol. Appl. Pharmacol. 175 (3):191–199. doi:10.1006/taap.2001.9240.
- Buonanno, G., S. Marini, L. Morawska, and F. C. Fuoco. 2012. Individual dose and exposure of Italian children to ultrafine particles. Sci. Total Environ. 438:271–277. doi:10.1016/j.scitotenv.2012.08.074.
- Carbone, S., M. Aurela, K. Saarnio, S. Saarikoski, H. Timonen, A. Frey, D. Sueper, I. M. Ulbrich, J. L. Jimenez, M. Kulmala, et al. 2014. Wintertime aerosol chemistry in Sub-arctic urban air. Aerosol Sci. Technol. 48 (3):313–323. doi:10.1080/02786826.2013.875115.
- Dal Maso, M., M. Kulmala, I. Riipinen, R. Wagner, T. Hussein, P. Aalto, and K. E. J. Lehtinen. 2005. Formation and growth of fresh atmospheric aerosols eight years of aerosol size distribution data from SMEAR. Boreal Environ. Res. 10:323–336.
- Dal Maso, M., J. Gao, A. Järvinen, H. Li, D. Luo, K. Janka, and T. Rönkkö. 2016. Improving air quality measurements by a diffusion charger based electrical particle sensors – A field study in Beijing, China. Aerosol Air Qual. Res. 16:3001–3011. doi:10.4209/aaqr.2015.09.0546.
- Dockery, D. W., C. A. Pope, X. Xu, J. D. Spengler, J. H. Ware, M. E. Fay, B. G. Ferris, and F. E. Speizer. 1993. An association between air pollution and mortality in six U.S. cities. N. Engl. J. Med. 329 (24):1753–1759. doi:10.1056/NEJM199312093292401.
- EEA. 2018. Air quality in Europe – 2018 report. EEA Report No 12/2018, Copenhagen, Denmark. doi:10.2800/777411.
- Eeftens, M., H. C. Phuleria, R. Meier, I. Aguilera, E. Corradi, M. Davey, R. Ducret-Stich, M. Fierz, R. Gehrig, A. Ineichen, et al. 2015. Spatial and temporal variability of ultrafine particles, NO2, PM2.5, PM2.5 absorbance, PM10 and PMcoarse in Swiss study areas. Atmos. Environ. 111 (2):60–70. doi:10.1016/j.atmosenv.2015.03.031.
- European Council, D. 2008. On ambient air quality and cleaner air for Europe 2008/50/EC. Off. J. 1:1–44.
- Fierz, M. 2011. Lung-deposited surface area measurements in Zurich. http://www.exisab.com/Docs/Conferences/ETH_Nanoparticle_2011/.
- Fierz, M., C. Houle, P. Steigmeier, and H. Burtscher. 2011. Design, calibration, and field performance of a miniature diffusion size classifier. Aerosol Sci. Technol. 45 (1):1–10. doi:10.1080/02786826.2010.516283.
- Fierz, M., D. Meier, P. Steigmeier, and H. Burtscher. 2014. Aerosol measurement by induced currents. Aerosol Sci. Technol. 48 (4):350–357. doi:10.1080/02786826.2013.875981.
- Fissan, H., S. Neumann, A. Trampe, D. Y. H. Pui, and W. G. Shin. 2006. Rationale and principle of an instrument measuring lung deposited nanoparticle surface area. J. Nanoparticle Res. 9 (1):53–59. doi:10.1007/s11051-006-9156-8.
- Gao, M., J. Cao, and E. Seto. 2015. A distributed network of low-cost continuous reading sensors to measure spatiotemporal variations of PM2.5 in Xi’an, China. Environ. Pollut. 199:56–65.
- Gomes, J. F. P., J. C. M. Bordado, and P. C. S. Albuquerque. 2012. On the assessment of exposure to airborne ultrafine particles in urban environments. J. Toxicol. Environ. Heal. Part A Curr. Issues 75 (22–23):1316–1329. doi:10.1080/15287394.2012.721163.
- Hama, S. M. L., N. Ma, R. L. Cordell, G. P. A. Kos, A. Wiedensohler, and P. S. Monks. 2017. Lung deposited surface area in Leicester urban background site/UK: Sources and contribution of new particle formation. Atmos. Environ. 151:94–107. doi:10.1016/j.atmosenv.2016.12.002.
- Helin, A., J. Niemi, A. Virkkula, L. Pirjola, K. Teinilä, J. Backman, M. Aurela, S. Saarikoski, T. Rönkkö, E. Asmi, et al. 2018. Characteristics and source apportionment of black carbon in the Helsinki metropolitan area, Finland. Atmos. Environ. 190:87–98. doi:10.1016/j.atmosenv.2018.07.022.
- Hennig, F., U. Quass, B. Hellack, M. Küpper, T. A. J. Kuhlbusch, M. Stafoggia, and B. Hoffmann. 2018. Ultrafine and fine particle number and surface area concentrations and daily cause-specific mortality in the Ruhr area, Germany, 2009–2014. Environ. Health Perspect. 126 (2):2009–2014.
- Hinds, W. C. 1999. Aerosol technology: Properties, behaviour, and measurement of airborne particles. 2nd ed. New York: Wiley.
- Hoek, G., R. M. Krishnan, R. Beelen, A. Peters, B. Ostro, B. Brunekreef, and J. D. Kaufman. 2013. Long-term air pollution exposure and cardio-respiratory mortality: A review. Environ. Health 12 (1):43. doi:10.1186/1476-069X-12-43.
- Järvinen, A., H. Kuuluvainen, J. V. Niemi, S. Saari, M. Dal Maso, L. Pirjola, R. Hillamo, K. Janka, J. Keskinen, and T. Rönkkö. 2015. Monitoring urban air quality with a diffusion charger based electrical particle sensor. Urban Clim. 14:441–456. doi:10.1016/j.uclim.2014.10.002.
- Jiao, W., G. Hagler, R. Williams, R. Sharpe, R. Brown, D. Garver, R. Judge, M. Caudill, J. Rickard, M. Davis, et al. 2016. Community Air Sensor Network (CAIRSENSE) Project: Evaluation of low-cost sensor performance in a suburban environment in the southeastern United States. Atmos. Meas. Tech. 9 (11):5281–5292. doi:10.5194/amt-9-5281-2016.
- Karjalainen, P., H. Timonen, E. Saukko, H. Kuuluvainen, S. Saarikoski, P. Aakko-Saksa, T. Murtonen, M. Bloss, M. Dal Maso, P. Simonen, et al. 2016. Time-resolved characterization of primary particle emissions and secondary particle formation from a modern gasoline passenger car. Atmos. Chem. Phys. 16 (13):8559–8570. doi:10.5194/acp-16-8559-2016.
- Kelly, F. J., and J. C. Fussell. 2012. Size, source and chemical composition as determinants of toxicity attributable to ambient particulate matter. Atmos. Environ. 60:504–526. doi:10.1016/j.atmosenv.2012.06.039.
- Kulkarni, P., P. A. Baron, and K. Willeke. 2011. Aerosol measurement, 2nd ed, aerosol measurement: Principles, techniques, and applications. 3rd ed. Hoboken, NJ: John Wiley & Sons, Inc.
- Kumar, P., L. Morawska, C. Martani, G. Biskos, M. Neophytou, S. Di Sabatino, M. Bell, L. Norford, and R. Britter. 2015. The rise of low-cost sensing for managing air pollution in cities. Environ Int. 75:199–205. doi:10.1016/j.envint.2014.11.019.
- Kuula, J., H. Kuuluvainen, T. Rönkkö, J. V. Niemi, E. Saukko, H. Portin, M. Aurela, S. Saarikoski, A. Rostedt, R. Hillamo, et al. 2018. Applicability of optical and diffusion charging-based particulate matter sensors to urban air quality measurements. Aerosol Air Qual. Res. 122:1–16. doi:10.4209/aaqr.2018.04.0143.
- Kuuluvainen, H., M. Poikkimäki, A. Järvinen, J. Kuula, M. Irjala, M. Dal Maso, J. Keskinen, H. Timonen, J. V. Niemi, and T. Rönkkö. 2018. Vertical profiles of lung deposited surface area concentration of particulate matter measured with a drone in a street canyon. Environ. Pollut. 241:96–105. doi:10.1016/j.envpol.2018.04.100.
- Kuuluvainen, H., T. Rönkkö, A. Järvinen, S. Saari, P. Karjalainen, T. Lähde, L. Pirjola, J. Niemi, R. Hillamo, and J. Keskinen. 2016. Lung deposited surface area size distributions of particulate matter in different urban areas. Atmos. Environ. 136:105–113. doi:10.1016/j.atmosenv.2016.04.019.
- Lamberg, H., K. Nuutinen, J. Tissari, J. Ruusunen, P. Yli-Pirilä, O. Sippula, M. Tapanainen, P. Jalava, U. Makkonen, K. Teinilä, et al. 2011. Physicochemical characterization of fine particles from small-scale wood combustion. Atmos. Environ. 45 (40):7635–7643. doi:10.1016/j.atmosenv.2011.02.072.
- Lelieveld, J., J. S. Evans, M. Fnais, D. Giannadaki, and A. Pozzer. 2015. The contribution of outdoor air pollution sources to premature mortality on a global scale. Nature 525 (7569):367–371. doi:10.1038/nature15371.
- Ma, N., and W. Birmili. 2015. Estimating the contribution of photochemical particle formation to ultrafine particle number averages in an urban atmosphere. Sci. Total Environ. 512–513:154–166. doi:10.1016/j.scitotenv.2015.01.009.
- Manninen, H. E., T. Nieminen, E. Asmi, S. Gagné, S. Häkkinen, K. Lehtipalo, P. Aalto, M. Vana, A. Mirme, S. Mirme, et al. 2010. EUCAARI ion spectrometer measurements at 12 European sites-analysis of new particle formation events. Atmos. Chem. Phys. 10 (16):7907–7927. doi:10.5194/acp-10-7907-2010.
- Maricq, M. M. 2013. Monitoring motor vehicle pm emissions: An evaluation of three portable low-cost aerosol instruments. Aerosol Sci. Technol. 47(5):564–573. doi:10.1080/02786826.2013.773394.
- Maso, M. D., J. Gao, A. Järvinen, H. Li, D. Luo, K. Janka, and T. Rönkkö. 2017. Improving urban air quality measurements by a diffusion charger based electrical particle sensors – A field study in Beijing, China. Aerosol Air Qual. Res. 16 (12):3001–3011. doi:10.4209/aaqr.2015.09.0546.
- Morawska, L., P. K. Thai, X. Liu, A. Asumadu-Sakyi, G. Ayoko, A. Bartonova, A. Bedini, F. Chai, B. Christensen, M. Dunbabin, et al. 2018. Applications of low-cost sensing technologies for air quality monitoring and exposure assessment: How far have they gone? Environ. Int. 116:286–299. (February):doi:10.1016/j.envint.2018.04.018.
- Niemi, J., S. Saarikoski, M. Aurela, H. Tervahattu, R. Hillamo, D. L. Westphal, P. Aarnio, T. Koskentalo, U. Makkonen, H. Vehkamäki, et al. 2009. Long-range transport episodes of fine particles in Southern Finland during 1999-2007. Atmos. Environ. 43 (6):1255–1264. doi:10.1016/j.atmosenv.2008.11.022.
- Ntziachristos, L., S. Amanatidis, Z. Samaras, K. Janka, and J. Tikkanen. 2013. Application of the Pegasor Particle Sensor for the measurement of mass and particle number emissions. SAE Int. J. Fuels Lubr. 6 (2):521–531.
- Ntziachristos, L., A. Polidori, H. Phuleria, M. D. Geller, and C. Sioutas. 2007. Application of a diffusion charger for the measurement of particle surface concentration in different environments. Aerosol Sci. Technol. 41 (6):571–580.
- Oberdörster, G., E. Oberdörster, and J. Oberdörster. 2005. Nanotoxicology: An emerging discipline evolving from studies of ultrafine particles. Environ. Health Perspect. 113 (7):823–839. doi:10.1289/ehp.7339.
- Pirinen, P., H. Simola, J. Aalto, J.-P. Kaukoranta, P. Karlsson, and R. Ruuhela. 2012. Tilastoja suomen ilmastosta 1981-2010. Raportteja 1:96.
- Pirjola, L., A. Dittrich, J. V. Niemi, S. Saarikoski, H. Timonen, H. Kuuluvainen, A. Järvinen, A. Kousa, T. Rönkkö, and R. Hillamo. 2016. Physical and chemical characterization of real-world particle number and mass emissions from city buses in Finland. Environ. Sci. Technol. 50 (1):294–304. doi:10.1021/acs.est.5b04105.
- Pirjola, L., J. Niemi, S. Saarikoski, M. Aurela, J. Enroth, S. Carbone, K. Saarnio, H. Kuuluvainen, A. Kousa, T. Rönkkö, et al. 2017. Physical and chemical characterization of urban winter-time aerosols by mobile measurements in Helsinki, Finland. Atmos. Environ. 158:60–75. doi:10.1016/j.atmosenv.2017.03.028.
- Rai, A. C., P. Kumar, F. Pilla, A. N. Skouloudis, S. Di Sabatino, C. Ratti, A. Yasar, and D. Rickerby. 2017. End-user perspective of low-cost sensors for outdoor air pollution monitoring. Sci. Total Environ. 607 (Suppl. C):691–705. doi:10.1016/j.scitotenv.2017.06.266.
- Reche, C., M. Viana, M. Brines, N. Pérez, D. Beddows, A. Alastuey, and X. Querol. 2015. Determinants of aerosol lung-deposited surface area variation in an urban environment. Sci. Total Environ. 517:38–47. doi:10.1016/j.scitotenv.2015.02.049.
- Rönkkö, T., H. Kuuluvainen, P. Karjalainen, J. Keskinen, R. Hillamo, J. V. Niemi, L. Pirjola, H. J. Timonen, S. Saarikoski, E. Saukko, et al. 2017. Traffic is a major source of atmospheric nanocluster aerosol. Proc. Natl. Acad. Sci. 114 (29):7549–7554. doi:10.1073/pnas.1700830114.
- Rostedt, A., A. Arffman, K. Janka, J. Yli-Ojanperä, and J. Keskinen. 2014. Characterization and response model of the PPS-M aerosol sensor. Aerosol Sci. Technol. 48 (10):1022–1030. doi:10.1080/02786826.2014.951023.
- Saarikoski, S., H. Timonen, K. Saarnio, M. Aurela, L. Järvi, P. Keronen, V.-M. Kerminen, and R. Hillamo. 2008. Sources of organic carbon in fine particulate matter in Northern European urban air. Atmos. Chem. Phys. 8 (20):6281–6295. doi:10.5194/acp-8-6281-2008.
- Silva, R. A., J. J. West, Y. Zhang, S. C. Anenberg, J. F. Lamarque, D. T. Shindell, W. J. Collins, S. Dalsoren, G. Faluvegi, G. Folberth, et al. 2013. Global premature mortality due to anthropogenic outdoor air pollution and the contribution of past climate change. Environ. Res. Lett. 8 (3):034005. doi:10.1088/1748-9326/8/3/034005.
- Sirignano, M., M. Conturso, A. Magno, S. Di Iorio, E. Mancaruso, B. M. Vaglieco, and A. D'Anna. 2018. Evidence of sub-10 nm particles emitted from a small-size diesel engine. Exp. Therm. Fluid Sci. 95:60–64. (January):doi:10.1016/j.expthermflusci.2018.01.031.
- Snyder, E. G., T. H. Watkins, P. A. Solomon, E. D. Thoma, R. W. Williams, G. Hagler, D. Shelow, D. A. Hindin, V. J. Kilaru, and P. W. Preuss. 2013. The changing paradigm of air pollution monitoring. Environ. Sci. Technol. 47 (20):11369–11377.
- Timonen, H., S. Carbone, M. Aurela, K. Saarnio, S. Saarikoski, N. L. Ng, M. R. Canagaratna, M. Kulmala, V. M. Kerminen, D. R. Worsnop, et al. 2013. Characteristics, sources and water-solubility of ambient submicron organic aerosol in springtime in Helsinki, Finland. J. Aerosol Sci. 56:61–77. doi:10.1016/j.jaerosci.2012.06.005.
- Tissari, J., J. Lyyränen, K. Hytönen, O. Sippula, U. Tapper, A. Frey, K. Saarnio, A. S. Pennanen, R. Hillamo, R. O. Salonen, et al. 2008. Fine particle and gaseous emissions from normal and smouldering wood combustion in a conventional masonry heater. Atmos. Environ. 42 (34):7862–7873. doi:10.1016/j.atmosenv.2008.07.019.
- Todea, A. M., S. Beckmann, H. Kaminski, and C. Asbach. 2015. Accuracy of electrical aerosol sensors measuring lung deposited surface area concentrations. J. Aerosol Sci. 89:96–109. doi:10.1016/j.jaerosci.2015.07.003.
- Zhu, J., J. E. Penner, G. Lin, C. Zhou, L. Xu, and B. Zhuang. 2017. Mechanism of SOA formation determines magnitude of radiative effects. Proc. Natl. Acad. Sci. 114 (48):12685–12690. doi:10.1073/pnas.1712273114.