
 ?Mathematical formulae have been encoded as MathML and are displayed in this HTML version using MathJax in order to improve their display. Uncheck the box to turn MathJax off. This feature requires Javascript. Click on a formula to zoom.
Abstract
A key to understanding biological response due to cell exposure to chemical constituents in aerosols is to accurately be able to determine the delivered dose. Deposition efficiency and uniformity of deposition was measured experimentally in the Vitrocell® 24/48 air–liquid-interface (ALI) in vitro exposure system using monodisperse solid fluorescent particles with mass median aerodynamic diameters (MMAD) of 0.51, 1.1, 2.2 and 3.3 µm. Experimental results were compared with computational fluid dynamics (CFD; using both Lagrangian and Eulerian approaches) predicted deposition efficiency and uniformity for a single row (N = 6) of cell culture inserts in the Vitrocell® 24/48 system. Deposited fluorescent monodisperse particles were quantified using fluorescent microscopy and Image J software. Experiments were conducted using a suspension of two particle MMADs with each experiment being conducted a total of three times on different days. The average experimentally measured deposition efficiency ranged from a low of 0.013% for 0.51 µm MMAD particles to a maximum 0.86% for 3.3 µm MMAD particles. There was good agreement between the average experimentally measured and the CFD predicted particle deposition efficiency (regardless of approach) with agreement being slightly better at the smaller MMADs. Experimentally measured and CFD predicted average uniformity of deposition was >45% of the mean and within 15% of the mean for 0.51 µm and 2.2 MMAD µm particles, respectively. Experimentally measured average uniformity of deposition was between 15 and 45% of the mean while CFD predictions were within 15% of the mean for 1.1 and 3.3 µm MMAD particles. The deposition efficiency and uniformity across the cell culture inserts for solid particles should be considered when designing exposure regimens using the Vitrocell® 24/48 ALI in vitro exposure system.
Copyright © 2019 American Association for Aerosol Research
EDITOR:
Introduction
Use of in vitro exposure systems that enable aerosols to be delivered directly to the apical surface of cells (air–liquid-interface; ALI) provides a more realistic exposure method than traditional submerged in vitro cultures for inhalable test materials. Several recent reviews and evaluations have provided insight into the breadth of these systems (Paur et al. Citation2011; Thorne and Adamson Citation2013; Upadhyay and Palmberg Citation2018; Lacroix et al. Citation2018), their applicability to nanoparticle aerosols (Secondo, Liu, and Lewinski Citation2016) and the challenges of accurately accounting for delivery of the vapor phase of complex aerosols (Morris Citation2012). In all these reviews and evaluations, the importance of aerosol dosimetry to determine the delivered dose to cells was highlighted.
As the number and type of ALI in vitro exposure systems continues to grow, the need for accurate aerosol dosimetry is complicated by the various sizes (6–24 mm) of cell culture inserts, as well as 35 mm petri dishes and the different geometries used in these systems. A significant number of publications on aerosol dosimetry in ALI in vitro exposure systems have utilized liquid particle aerosols like fluorescently tagged glycerol (Steiner et al. Citation2017), mainstream tobacco smoke (Thorne et al. Citation2013, Citation2015; Weber et al. Citation2013; Adamson et al. Citation2013; Majeed et al. Citation2014; Ishikawa, Suzuki, and Nagata Citation2016a; Ishikawa et al. Citation2016b; Aufderheide et al. Citation2017) or aerosols from e-vapor products (Neilson et al. Citation2015). Some of the liquid particle aerosols used, like mainstream tobacco smoke and aerosols from e-vapor products are chemically and temporally dynamic which complicates their quantitative aerosol dosimetry. Inert solid particles have also been used to study aerosol dosimetry experimentally and using computational models in these in vitro exposure systems (Tippe, Heinzmann, and Roth Citation2002; Kim et al. Citation2013; Comouth et al. Citation2013; Fijitani et al. 2015). The exposure systems in these studies (Tippe, Heinzmann, and Roth Citation2002; Kim et al. Citation2013; Comouth et al. Citation2013; Fijitani et al. 2015), typically have a main channel with one or more wells that contains a central “horn” (trumpet shaped channel) that directs aerosol towards the cell culture insert, which is where particles deposit on the cells. Unfortunately for comparison with other work, Tippe, Heinzmann, and Roth (Citation2002) did not provide an estimate of deposition efficiency as a function of the number of particles entering the system. Kim et al. (Citation2013) reported a deposition efficiency of 70% with 12% variation between cell culture inserts for 60 nm diameter particles in his ALI exposure system. Comouth et al. (Citation2013) found 0.7% and 2.5% deposition efficiency for 0.1 µm and 2.5 µm MMAD diameter particles, respectively in a three cell culture insert ALI in vitro exposure system. Fujitani et al. (Citation2015) reported a deposition efficiency of 1.97 ± 1.17 (603 nm diameter particles) and 3.53 ± 2.81 (1005 nm diameter particles) in a single cell culture insert. Both Comouth et al. (Citation2013) and Fujitani et al. (Citation2015) also found good agreement between experimentally measured and CFD predicted deposition efficiency as a function of particle diameter.
Unlike previous studies, one of our objectives was to experimentally measure particle deposition efficiency for solid particles in all 48 cell culture inserts in a high throughput in vitro ALI exposure system. The particle size range chosen includes measurements of e-cigarette aerosols (Oldham et al. Citation2018) as well as PM 2.5. A second objective was to experimentally measure uniformity of deposition in all 48 cell culture inserts by answering two questions: (1) what is the variability in the deposited pattern among the six replicate cell culture inserts in a row?; and (2) what is the variability in the deposited particle pattern among the eight independent rows? Our final objective was to compare our experimental measurements of deposition efficiency and uniformity of deposition with predictions from both Lagrangian and Eulerian CFD approaches. Quantitative aerosol dosimetry (delivered dose) is critical for interpretation of biological results generated from these ALI in vitro exposure systems, comparison with existing literature, and potential extrapolation to human exposures.
Methods
We used monodispersed solid particles to investigate experimental measurement of deposition efficiency, variability of deposition efficiency within and between rows of six cell culture inserts and uniformity of deposition across each of the 48 cell culture inserts (eight rows each with six cell culture inserts) of the Vitrocell® 24/48 ALI in vitro exposure system. Experimental measurements of deposition efficiency and uniformity of deposition were compared with both Lagrangian and Eulerian simulation approaches implemented in CFD for the Vitrocell® 24/48 ALI in vitro exposure system. In addition for a single run, 1.1 µm and 3.3 µm MMAD particles that did not deposit on the cell culture insert, on the walls of the cell culture insert, or horn were collected on filters and counted. Also, contrary to previous studies, the geometry used in the CFD techniques included the entire channel geometry with six cell culture inserts. This complete channel geometry enabled experimental and CFD investigation of potential differences between the six cell culture inserts within a single channel. A diagram of the Vitrocell® 24/48 ALI in vitro exposure system showing the alternating airflow direction in each of the eight channels together with the inlet horns that direct the desired portion of each channel’s flow toward the six cell culture inserts per channel is shown in .
Figure 1. Assembled Vitrocell® 24/48 ALI exposure system with exploded views of the top and bottom plates, horn and a diagram of the aerosol path (blue arrows) in the assembled system.
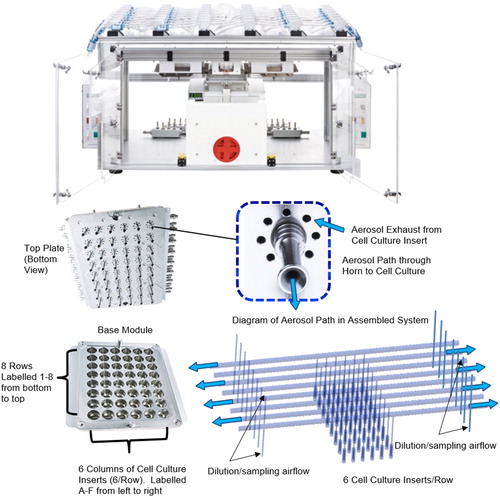
Each channel of the Vitrocell® 24/48 ALI in vitro exposure system has a constant inner diameter of 6 mm with a total length of 52.8 cm from inlet to outlet. The sampling horns that connect perpendicularly below each channel have an entrance inner diameter of 3 mm. The first horn was located approximately 23 cm from the channel inlet and subsequent horns are separated by a center to center distance of 2 cm. The horns connect slightly off center (1 mm) from the central axis of the channel. Cell culture inserts were set at a height gap of 4 mm below the tip of the horn.
Experimental
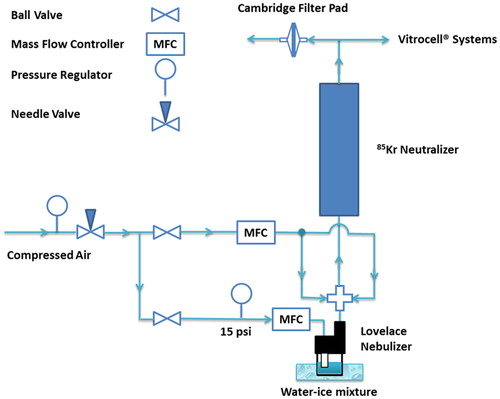
Four diameters of polystyrene monodisperse fluorescent particles were used to determine the deposition efficiency and particle distribution in each of the 48 cell culture inserts of the Vitrocell® 24/48 ALI in vitro exposure system. The physical particle diameters were 0.5, 1.1, 2.1 and 3.2 µm, which when corrected for density (1.05 g cm−3) gave mass median aerodynamic diameters (MMAD of 0.51, 1.1, 2.2 and 3.3 µm (Magsphere Inc., Pasadena, CA, USA). Two particle diameters were combined into a single suspension for each run (0.51 µm combined with 2.2 µm and 1.1 µm combined with 3.3 µm). Particle suspensions were prepared with an equal number of particles for each particle diameter. Each particle suspension was diluted with distilled water to preclude generation of more than 10% of the particles as multiplets (Raabe Citation1968) and sonicated for 15 min prior to use. Aerosols were generated using a Lovelace nebulizer (Raabe Citation1972; InTox Products, Albuquerque, NM, USA) operated at 1.05 kg cm−2 (15 psi). To minimize evaporative fluid loss from the Lovelace nebulizer, the nebulizer reservoir was place in an ice-water bath (). To maintain a constant aerosol concentration and to minimize overall experimental run time the reservoir was replaced with a freshly sonicated reservoir every 15 min. The generated aerosols were dried and diluted (10 times the nebulizer output) using a radial diluter that injected dry (<5% RH zero air) air at 90° into the particle airstream (). After passing through a 370 MBq 85Kr discharger (TSI, Shoreview, MN, USA) particle laden air was divided into nine individual aerosol streams using “Y” connectors. Eight of the individual aerosol streams were connected to the eight individual channels of the Vitrocell® 24/48 ALI in vitro exposure system with aerosol being pulled through each of the eight channels of the in vitro exposure system at 200 cc/min using mass flow controllers (Analyt-MTC, GmbH, Mullheim, Germany). The ninth aerosol stream was filtered using a 44 mm Cambridge filter pad and vented to atmosphere to prevent pressurization of the in vitro exposure system. At the end of each of the eight channels, prior to the mass flow controller, a 25 mm polycarbonate filter (0.4 µm pore size; Nucleopore™ (Fisher Scientific, Waltham, MA, USA) collected particles that did not deposit within the channel of the Vitrocell® 24/48 ALI in vitro exposure system. Flow for each of the 48 cell culture inserts was set at the manufacturer’s recommendation of 2 cc/min prior to each run and verified with a mass flow controller (Analyt-MTC, GmbH, Mullheim, Germany). The height of each of the 48 horns was set at 4 mm above the collection surface of the cell culture insert (consistent with the manufacturer’s recommendation). To eliminate the possibility of particle deposition being affected by thermophoretic effects, all runs were conducted in an isothermal condition at normal laboratory temperature and relative humidity (22 °C ± 2 °C; 60% relative humidity ± 5% relative humidity). Prior to each run the aerosol supply and exit lines were blocked and the system was pressurized to 300 mm H2O to test for leaks in accordance with the manufacturers recommendations. A pressure loss of equal to or less than 2 mm H2O over 1 min met the manufacturer’s specification. All experimental runs were conducted over a 120-min aerosol generation period. Each experimental run was repeated three times on separate days.
Figure 2. Diagram (not to scale) of the aerosol generation and dilution system.
In one run using the 1.1 and 3.3 µm MMAD particles, the particles that did not deposit within the first or last cell culture insert in a row were collected on a 25 mm polycarbonate filter (0.4 µm pore size). Polycarbonate filters could only be placed on exits of the first and last cell culture inserts of each of the eight channels of the Vitrocell® 24/48 ALI in vitro exposure system due to physical space limitations of the setup. To determine if any particles could reach the media reservoir below the cell culture inserts, the deionized water (with 1% detergent) placed below the six cell culture inserts was filtered (0.4 µm pore size) immediately after each run.
Each cell culture insert was marked to indicate its orientation to the aerosol flow in the channel. Clear fingerprint lifting tape (144 L transparent; Sirchie, Youngsville, NC, USA) was used to replace the bottom of each cell culture insert, which prevented particle bounce and enabled the number of particles deposited to be photographed on a X-Y-Z motorized stage (BX41 with motorized stage systems; Olympus Corp., Bridgeport, CT, USA) using fluorescent microscopy. Image J software (NIH, Bethesda, MD, USA) was used to count the number of deposited particles and provide their coordinates from photographs of the particles on the adhesive tape. Particles collected on the polycarbonate exit filters and the 1.1 and 3.3 µm MMAD particles that deposited on the cell culture insert exit filters or filters used to filter the deionized water were photographed using fluorescent microscopy and counted using Image J software.
In a preliminary run using 3.3 µm MMAD particles, the media reservoir below the cell culture inserts was not filled with deionized water. When particles depositing in the cell culture inserts were quantified for this preliminary run, a significant number of particles were only found in the first three cell culture inserts of each channel (see supplemental Figure S1). An explanation was provided by the Lagrangian based CFD predictions, which showed that when the common reservoir below the cell culture inserts was not filled with liquid, the airflow through the first three cell culture inserts was as expected, however, it was stagnant in the fourth cell culture insert in the channel and actually reverses, going up the horn toward the main channel flow in the last two cell culture inserts of the channel (see supplemental Figure S1). This was due to the design of a common media reservoir beneath all cell culture inserts in a channel or row. In all subsequent experimental runs, deionized water was placed in the common reservoir below all cell culture inserts. The number of particles depositing per cell culture insert in this preliminary run indicated that the 120-min run time resulted in a sufficient number of 3.3 µm MMAD particles deposited in the cell culture inserts to obtain a valid estimate of deposition efficiency and particle uniformity across the cell culture inserts.
Computational fluid dynamics
The computer aided design (CAD) drawings for the aerosol flow in the Vitrocell® 24/48 ALI in vitro exposure system was kindly provided by the manufacturer. The CAD drawings with system dimensions facilitated generation of a detailed geometry model. Some internal physical dimensions were checked against the CAD drawing. For the Lagrangian based CFD prediction, the common reservoir below the cell culture inserts was included in the geometry. Based upon the experiment set up, the total flow at the beginning of each of the eight channels was 212 cc/min. Flow for each channel was controlled by a mass flow controller set at 200 cc/min and each of the six cell culture inserts in a channel had flows set to 2 cc/min. After each cell culture insert the total flow in the channel drops by 2 cc/min. A constant air density of 1.225 kg/m3 was assumed.
CFD Lagrangian simulation
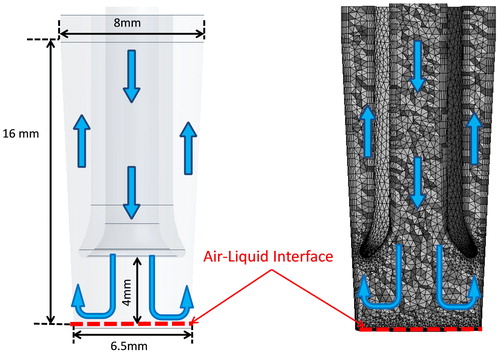
An entire row of the Vitrocell® 24/48 ALI in vitro exposure system was meshed and predicted particle deposition for each of six cell culture inserts was determined using CFD software, Fluent v17.1 (Canonsburg, PA, USA). To mimic experimental conditions, cell culture inserts were set at a height gap of 4 mm below the tip of the horn which resulted in them being 57.2 mm below the centerline of the 6 mm diameter channel (). The MMAD of the particles used in the experiments (monodisperse solid spherical particles of constant density) were used in the simulations.
Figure 3. Simulation geometry and Lagrangian mesh for one cell culture insert.
A mass flow inlet boundary condition was designated at the system’s inlet with a fully developed laminar parabolic velocity profile. Target flow rates were set at the main exit outlet as well as the six sampling chamber vacuum outlets. To set the target flow rates, Fluent’s ‘outflow’ boundary condition was used at all seven aforementioned outlets in the system with appropriate ‘flow rate weighting’ values for each. Particle injections per diameter were created using Matlab v2017a (Natick, MA, USA). A uniform distribution of solid spherical monodisperse particles of constant density (1000 kg/m3) was injected at the inlet with an offset from the wall to ensure the initial particle positions were within the geometry and did not immediately deposit (see supplemental Figure S2).
An unstructured mesh using hybrid of tetrahedral elements (0.36 mm) was created using ANSYS Mesher v17.1 (Canonsburg, PA, USA). A 5-element inflation layer with a smooth transition and a growth rate of 1.2 was attached to all wall surfaces (). All walls in the system were set to “trap” meaning that if a particle trajectory contacts a wall it was deposited and removed from the domain. Total count of particles deposited on the cell culture insert and on all other wall surfaces as well as particles not depositing in each of the six cell culture inserts and channel were tracked. A time step of 0.01 s was used, and the simulations were run sufficiently long (∼500 s real time) to allow a final fate for nearly all injected particles (a few remain suspended). A convergence criterion of 1e-6 was set for the continuity, momentum and energy equations. A first order implicit upwinding model was used along with a laminar viscous model and all calculations were done in double precision. For comparison with experimentally measured values, deposition efficiency from the Lagrangian simulations was calculated using the same method, which meant omitting particles that deposited in the main channel, on the walls of the cell culture insert, and particles that exited the six cell culture inserts.
CFD Eulerian simulation
The Eulerian CFD simulations were performed using a modified version of the AeroSolved framework (AeroSolved Citation2017), a publicly available simulation platform based on the OpenFOAM (Citation2015) open source software, developed to study aerosol dynamics. In AeroSolved, a sectional method was used to capture the size distribution of the aerosol and it includes various models to describe the most important physical processes in the aerosol transport and deposition (i.e., like aerosol drift, Brownian diffusion, impaction and sedimentation). The code was verified against a number of benchmark cases that are freely available in the public code repository (AeroSolved Citation2017) and was used in several scientific publications (Frederix et al. Citation2017; Lucci et al. Citation2018; Asgari, Lucci, and Kuczaj Citation2019). In particular, AeroSolved has already been used to model a single Vitrocell® 24/48 well chamber and contributed to the understanding and quantification of the physical processes involved in the aerosol deposition in ALI exposure systems (Lucci et al. Citation2018).
As the simulations of the full Vitrocell® 24/48 channel with the six well chambers using the originally developed transient AeroSolved solver are computationally too expensive, a new simplified steady state version of AeroSolved solver was developed. To make the simulation computationally affordable, we kept the physical processes validated in the AeroSolved framework while modifying the integration procedure. In this procedure, the gas flow was first computed using “rhoSimpleFoam” a state of the art standard OpenFOAM solver for compressible steady state flows. Then, the aerosol particle fields (i.e., particles velocities, particles number densities and particles mass fractions) are computed assuming a dilute aerosol in which the particles do not significantly change the gas flow field dynamics, the equivalent of assuming a “one-way coupling” between particles and gas phase in a Lagrangian–Eulerian framework that has been widely accepted for aerosols with a particle mass fraction <0.1% (Elghobashi Citation1994).
The walls in the physical domain were assumed to be fully absorbing, which means that particles contacting the wall boundary by convection or diffusion are removed from the domain. This was achieved with a boundary condition, which imposes a particle number density number Nf equal to Nf = Nc/(1 + 1/Sh), where Nc equals the particle number density at wall cell center and 1/Sh = DB/δvn represents the ratio between the particle Brownian diffusion velocity, DB/δ, and the particle velocity perpendicular to the wall, vn, being the particle Brownian diffusion coefficient DB and δ the cell thickness. For the large particles with small DB this boundary condition equates to a zero-gradient boundary condition (Nf = Nc), while for nanoparticles with large DB it’s similar to impose Nf = 0. Moreover, if particles move away from the wall (vn < 0) we impose Nf = 0.
The computational domain for the Eulerian simulations were constituted by a single Vitrocell® 24/48 channel with the six cell culture inserts. The main channel inlet was placed 15.6 cm before the first well, just after the dilution unit to simplify the geometry. The computational mesh was generated with cfMesh (www.cfmesh.com, London, UK) and it constitutes about 2.1 million cells, of which only about 32,000 are not hexahedral cells. To better capture the boundary wall flow, three layers of boundary layer cells were added along the wall surface. The main channel with the six cell culture inserts were simulated in the Eulerian CFD platform at the same flow conditions of the experiments, specifically, a flow rate in the channel of 200 cc/min and a sampling flow rate at each well chamber of 2 cc/min were investigated. Solid unit density spheres with 24 different diameters in the range 50 nm < MMAD < 4.5 µm were analyzed.
Data analysis
Particle deposition efficiency was calculated by dividing the number of fluorescent particles that deposited on a given cell culture insert by the number in the channel that could have entered the horn on the way towards that cell culture insert, expressed as a percentage. Experimentally, this meant that for the first cell culture insert in a channel, the total number of particles that could have entered the first horn, on the way to the first cell culture insert was the total of the number of particles depositing on the channel exit filter, plus the number of particles that deposited on all six cell culture inserts. Detailed equations for each for particle deposition calculation are provided in the online supplementary information. Generally, good agreement with CFD predictions is considered ±10% or within the experimentally measured standard deviation (Oldham Citation2006; Longest and Oldham Citation2006; Comouth et al. Citation2013; Fujitani et al. Citation2015; Rafidi et al. Citation2018), especially when considering the variability that occurs in in vitro studies. However, two-tailed t-tests were also performed (Microsoft Excel 2010) to assess statistical significance using a 0.05 level of significance without Bonferroni correction for multiple t-test comparisons as a worst case analysis.
To visualize and quantitate particle uniformity across the cell culture inserts, two approaches, namely quadrant and distance, were used (Kam et al. Citation2013). In both approaches, results are expressed as percent of mean so results are comparable regardless of the total number of particles depositing on the cell culture insert. This particle uniformity analysis attempted to answer two questions: what is the variability in the deposited particle pattern among the six replicate cell culture inserts in a row, and; what is the variability in the deposited particle pattern among the eight rows? To examine the particle deposition distribution in a top to bottom and left to right manner, the first approach divided the cell culture inserts into four equal area quadrants using an X, Y coordinate system with 0,0 as the center of cell culture insert. Deposited particles were counted in each quadrant and divided by 25% of the total number of deposited particles in all four quadrants (assumes uniform distribution of deposited particles). For example, if 100 particles deposited on the cell culture insert with 30 depositing in the upper right quadrant, the uniform distribution assumption would mean 25 particles/quadrant would be expected to deposit in each quadrant, so the upper right quadrant would have (30 ÷ 25) * 100% or 120% of the expected mean number of deposited particles. The second approach examined the deposited particle distribution in a radial manner by dividing the cell culture inserts into a center circle and three rings each with an equal area. Using the same X, Y coordinate system as the quadrant approach, particles in each of the four areas of a cell culture insert were counted with the number divided by 25% of the total number of deposited particles in the cell culture insert. For both approaches, half of any particle that fell on a line was allocated to each adjacent area. Finally, as a guide to future in vitro studies, the mean results for each particle diameter were converted to mass using unit density, providing results in fg or ng/µm2.
Results
Experimental
As expected both measured and predicted particle deposition efficiency was a function of particle MMAD (). Experimental particle deposition efficiency measurements for the 0.51 and 1.1 µm MMAD particles demonstrated high variability between individual cell culture inserts. The variation from cell culture insert to cell culture insert was calculated as the deposition efficiency in a specific cell culture insert minus the mean deposition efficiency of the row divided by the mean deposition efficiency of row (see supplemental Figures S3–S26). Some of the variability was the result of uncertainty in counting the number of particles on the channel exit filters. For the 0.51 and 1.1 µm MMAD particles, this variability was 2.3 and 1.1%, respectively. For the 2.2 and 3.3 µm MMAD particles, the particle counting variability on the channel exit filters was 0.2 and 0.007%, respectively. Another source of variability for the 0.51 µm MMAD particles was the low number of particles depositing on the cell culture inserts. Typically there were less than 10 particles depositing per cell culture insert even though between 12,850 and 24,375 particles were flowing through the channel, depending on the specific channel and run, and were collected on the channel exit filters. For the 1.1 µm MMAD particles, some of the variability between cell culture inserts can also be attributed to relatively low numbers of depositing particles/cell culture insert, typically less than 20/cell culture insert, despite between 16,314 and 24,721 particles flowing through each channel depending on the specific channel and run before being collected on the channel exit filters.
Table 1. Comparison of mean experimentally measured and CFD predicted particle deposition efficiency as a function of particle MMAD in the Vitrocell® 24/48 ALI in vitro exposure system.
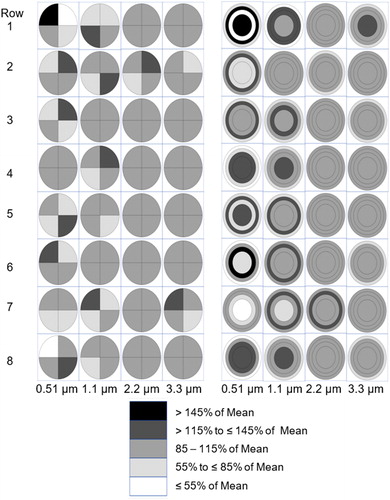
As expected, the variability in particle deposition across the cell culture inserts, regardless of approach (quadrant or circle and rings), was also a function of particle diameter and number of particles deposited on the cell culture inserts. There was substantial variability in deposition uniformity within and between rows in a single experimental run (see supplemental Figures S3–S26). The variability in mean particle deposition uniformity (N = 24 with 8 rows/run; 3 runs/particle diameter) between the six replicate cell culture inserts within a row (), for the 0.51, 1.1, 2.2 and 3.3 µm MMAD particles, was also a function of particle size (e.g., more cell culture inserts per row were within 15% of the mean). For 0.51, µm MMAD particles there were areas with greater than 45% variability from the mean particle deposition uniformity, while most of the variability from the mean ranged between 15 and 45%. The variability from the mean particle deposition uniformity using both approaches ranged between 15 and 45% for the 1.1 µm MMAD particles, was with 15% for the 2.2 µm MMAD particles, and also was within 15% for the 3.3 µm MMAD particles except for two instances in the equal area circle and ring approach. The variability in particle uniformity between the eight rows for each cell culture insert (), for the 0.51, 1.1, 2.1 and 3.3 µm MMAD particles was also a function of particle size (e.g., more cell culture inserts per row were within 15% of the mean). For each particle diameter, the variability in particle uniformity between the columns of each cell culture insert was similar to that seen in rows of cell culture inserts.
Figure 4. Mean experimentally measured particle deposition uniformity across the six cell culture inserts in a row by particle size in MMAD (top = 0.51, second = 1.1, third = 2.2, and bottom = 3.3 µm MMAD) in four equal area quadrants (top four rows) and a circle and three rings with equal area (bottom four rows) expressed as percent of mean. Each cell culture insert is a mean of 24 experimental measurements (8 rows/run; three experimental runs). Airflow is moving from left to right.
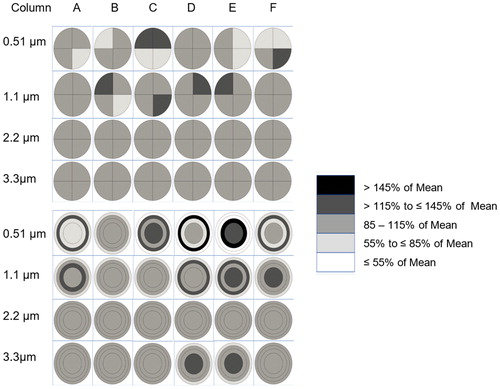
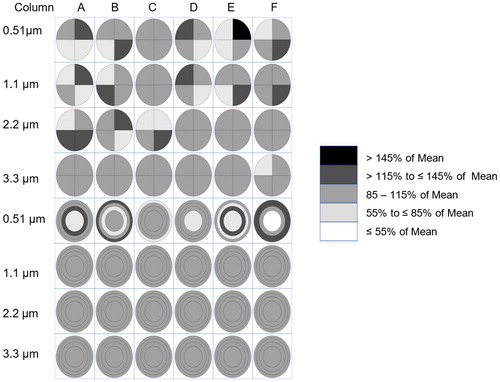
Figure 5. Experimentally measured particle deposition uniformity across cell culture inserts in a column by particle size in MMAD in four equal area quadrants (left four columns) and circle and three rings with equal area (right four columns) expressed as percent of mean. Each cell culture insert is a mean of 18 experimental measurements (6 inserts/run; three experimental runs). Airflow is moving from left to right.
The average deposition efficiency measured on the exit filters of the cell culture inserts was 0.9 ± 1.1% and 0.2 ± 0.2% for the 3.3 µm and 1.1 µm MMAD particles, respectively. Experimental measurements were higher than the Lagrangian and Eulerian CFD predictions for the 3.3 µm MMAD particles and lower than the Lagrangian and Eulerian CFD predictions for the 1.1 µm MMAD particles ().
Table 2. Lagrangian and Eulerian CFD predicted particle deposition efficiency as a function of particle MMAD (Lagrangian simulation used 107 particles injected at channel entrance with 500 s simulation) in the Vitrocell® 24/48 ALI in vitro exposure system including all deposition sites.
Finally, based upon the average number of 0.51, 1.1, 2.2, and 3.3 µm MMAD particles that deposited from 120 min exposure on the cell culture inserts (2.4 ± 1.6, 11 ± 4, 46 ± 11, and 72 ± 21, respectively) the deposited doses were 0.54 ± 36 fg/cm2, 23.2 ± 8.4 fg/cm2, 0.83 ng/cm2, and 4.4 ± 1.3 ng/cm2, respectively.
CFD Lagrangian simulation
Potential deposition of particles on the inside and outside of the inlet horns was not measured experimentally due to the difficulty in removing the horns without disturbing potential particle deposition and not being able to devise a reliable analysis strategy to distinguish particle losses on the inside from the outside of the inlet horn. Deposition of particles on the cell culture inserts walls and in the main channel of each row was also not measured experimentally due to technical limitations. These experimental limitations of particle tracking and deposition counting onto various surfaces of the system are not limitations for CFD simulations. Predicted deposition efficiencies onto these surfaces were determined as a function of the mass flow rate of deposited particles onto the surface to the mass flow of particles injected at the channel inlet.
(1)
(1)
where
Total mass flow rate of particles at channel inlet.
Predicted deposition efficiencies including particles that deposited in the channel, on the walls of the cell culture inserts, on the exit filters of the cell culture insert walls and in the cell culture inserts for both Eulerian and Lagrangian simulations are shown in . There was good agreement between experimentally measured and CFD predicted depositions efficiency except for the 3.3 µm MMAD particles. Statistical analysis indicated that for every particle diameter there was a statistically significantly difference (p < 0.05%) between experimental measurements and CFD predictions, with the absolute difference was ranging from 0.08 to 0.51% (0.51–3.3 µm MMAD particles). The pattern of increasing particle deposition efficiency as a function of particle diameter was consistent with the experimental results. Predicted quadrant and radial particle distribution across the cell culture inserts showed good agreement in that both showed more uniformity as the MMAD increased (). The largest differences in the quadrant and or circle and ring uniformity comparison between experimentally measured and Lagrangian predictions occurred with 0.51 µm MMAD particles.
Figure 6. Lagrangian CFD predicted particle deposition uniformity across six cell culture inserts in a row by particle size (top = 0.51, second = 1.1, third = 2.2, and bottom = 3.3 µm MMAD) in four equal area quadrants (top four rows) and circle and three rings with equal area (bottom four rows) expressed as percent of mean. One million particles were injected at the entrance of the in vitro exposure system with airflow moving from left to right.
CFD Eulerian simulation
Comparison of deposition efficiency versus the particle MMAD between Eulerian CFD predictions and experimental measurements shows good agreement () except of the 3.3 µm MMAD particles. Similar to the Lagrangian CFD, Eulerian CFD predictions of particle deposition were statistically significantly difference (p < 0.05%) from experimental measurements with the absolute difference was ranging from 0.003 to 0.374% (0.51–3.3 µm MMAD particles). Predicted deposition efficiency calculated for the channel () showed the same trend with agreement between the two CFD methods increasing as a function of MMAD. The particle deposition uniformity, predicted by the Eulerian CFD and expressed as percent of the mean showed a maximum of 1% variation (0.051 µm MMAD) between the six cell culture inserts in a row (), so only results for the fourth cell culture insert are shown in supplemental Figure S27. The most inhomogeneity was observed for the smallest diameter particles (MMAD = 0.51 µm) at the edge of the cell culture insert where particle deposition decreases. This was an effect of Brownian diffusion deposition of the small particles on the cell culture insert lateral wall which removes particles available to deposit on the cell insert. Larger particles (i.e., MMAD = 1.1, 2.2, 3.3 µm) showed only a slight deposition increase, on the order of 10%, at the cell culture insert (barely visible in supplemental Figure S27). This effect was attributed to the accumulation of particles in the boundary layer of the cell culture insert wall and their sedimentation parallel to the wall onto the insert.
Figure 7. Deposition efficiency [%] vs. particle MMAD [µm] for the experimental measurements (blue line), the Lagrangian CFD predictions (green line) and the Eulerian CFD predictions red line).
![Figure 7. Deposition efficiency [%] vs. particle MMAD [µm] for the experimental measurements (blue line), the Lagrangian CFD predictions (green line) and the Eulerian CFD predictions red line).](/cms/asset/6c8354da-204b-4d42-a00f-841b7c40fc6c/uast_a_1676877_f0007_c.jpg)
Discussion
The Lagrangian CFD simulated the results from the preliminary run when the common reservoir was not filled with media, PBS or deionized water beneath the cell culture inserts. The CFD simulation explains the result if one considers how a typical “air blast” nebulizer works (Phalen Citation1984). Airflow in the straight section of a 90 “T” configuration creates negative pressure that results in liquid being sucked up the short arm of the “T” and incorporated into the airstream.
Consistent with previous studies comparing experimentally measured particle deposition with CFD predictions (Comouth et al. Citation2013; Fujitani et al. Citation2015) and using similar criteria, we found good agreement between experimentally measured and CFD predicted particle deposition efficiency for solid monodisperse particles from 0.51 to 3.3 µm MMAD. Utilization of the two CFD approaches, Lagrangian and Eulerian, with their inherent differences using different software and computational platforms was unique for the predicted aerosol dosimetry performed in this study. Unlike these two previous studies (Comouth et al. Citation2013; Fujitani et al. Citation2015) in which statistical analysis was not performed, statistical analysis showed there were significant differences (p < 0.05) between experimentally measured and CFD predicted deposition efficiency for each solid monodisperse particle diameter studied.
In the current study, for 0.51–3.3 µm MMAD particles after 2 h of exposure with 6.5 mm cell culture inserts 4 mm from the inlet horn using 2 cc/min flowrate, experimentally measured deposition efficiency ranged from 0.013 to 0.86%. In comparison, Comouth et al. (Citation2013) used 24 mm diameter cell culture inserts that were 2 mm from the inlet horn with a 100 cc/min flowrate for up to 7 h to obtain deposition efficiencies of 0.7% and 2.5% for 0.1 µm and 2.0 µm MMAD particles, respectively. These deposition efficiencies reported by Comouth et al. (Citation2013) were estimated from 25 random microscopic fields/TEM grid (3 mm diameter) with TEM grids place at the center and around the perimeter of the 24 mm cell culture insert. Fujitani et al. (Citation2015) reported a deposition efficiency of 3.53 ± 2.81% in a single cell culture insert for 1005 nm monodisperse polystyrene latex particles using a similar technique. One TEM grid (grid size not stated) was placed at the center and four placed around the center TEM grid of an 11 mm diameter cell culture insert 1 mm away from the inlet horn using 7.8 cc/min flowrate over the 390 min exposure. With the differences in the ALI in vitro exposure systems (cell culture insert size, number of cell culture inserts, horn geometry, horn height, flowrates used, etc.) and methodologies used (sampling the cell culture insert surface with grids vs. analysis of the total cell culture insert surface) it is not surprising that their deposition efficiencies are an 1–2 orders of magnitude higher than found in the current study. More detailed comparison of deposition efficiency is best done with analytical solutions like in Lucci et al. (Citation2018) that can account for different experimental conditions (insert diameter, horn flowrate, different particle diameters, etc.).
In contrast to Kim et al. (Citation2013), but consistent with Comouth et al. Citation2013, we found the variability in particle deposition across the cell culture insert was a function of MMAD with smaller MMAD particles demonstrating greater variability. Both Kim et al. (Citation2013) and Comouth et al. (Citation2013) reported variability in particle deposition across the cell culture insert of particle sizes significantly smaller than the MMAD sizes used in the current study. Our average experimental results for 0.51 µm MMAD particles showed greater than 45% difference from the mean in particle deposition across the cell culture insert. The variability in particle deposition across the cell culture insert dropped to between 15 and 45% of the mean for 1.1 µm and 3.3 µm MMAD particles and was within ±15% of the mean for 2.2 µm MMAD particles. CFD predictions of variability in particle deposition across the cell culture insert were consistent with the experimental measurements.
There are several limitations of the work performed in this study. The primary limitation is that the experimental results only apply to solid inert particles, not to liquid droplets or more complex aerosols that contain liquid droplets and/or vapor. Another experimental limitation is the high variability in particle deposition efficiency for 0.51 and 1.1 µm MMAD particles which in part is due to variability in counting particles on channel exit filters and low number of particles depositing on the cell culture inserts. The low number of particles depositing on the cell culture inserts for 0.51 and 1.1 µm MMAD particles was inconsistent with results from the preliminary run using 3.3 µm MMAD particles. A more concentrated particle suspension in the nebulizer and longer exposure times (>2 h) may have helped reduce this limitation. A limitation of both the experimental and CFD work was that the aerosol entrance profile was not measured experimentally; therefore, the CFD predictions were based on a fully developed parabolic flow profile assumption. Previous experimental vs. CFD comparisons (Longest and Oldham Citation2006) demonstrated better agreement between experimental and CFD predicted deposition when the experimental aerosol entrance profile was measured. In the experiments, the loss of particles in the main channel, on the inside and outside of the inlet horns and walls of the cell culture insert were not measured and therefore could not be compared with the Lagrangian and Eulerian CFD predictions of particle deposition on these surfaces.
In summary, for 0.51–3.3 µm MMAD particles after 2 h of exposure, experimentally measured deposition efficiency ranged from 0.013 to 0.86% which translates to 0.54 fg/cm2–1.3 ng/cm2, respectively. The uniformity of particle deposition (N = 24) exceeded ±45% of the mean only for the 0.51 µm MMAD particles. The variability in particle deposition across the cell culture insets for solid particles illustrates the need for an appropriate number of replicates when using the Vitrocell® 24/48 in vitro exposure system, which will depend on the aerosol size and sensitivity of the in vitro endpoint. The deposition efficiency and variability in particle deposition across the cell culture inserts for solid particles should therefore be considered when designing exposure regimens using the Vitrocell® 24/48 ALI in vitro exposure system.
Supplemental Material
Download MS Word (2.3 MB)Acknowledgments
The authors acknowledge the editorial assistance of Eileen Y. Ivasauskas of Accuwrit Inc. The authors would also like to thank Mr. Tobias Krebs, Managing Director of Vitrocell® for his technical support during the conduct of this work.
Disclosure statement
No potential conflict of interest was reported by the authors.
Additional information
Funding
References
- Adamson, J., D. Thorne, A. Dalrymple, D. Dillon, and C. Meredith. 2013. Assessment of cigarette smoke particle deposition within the Vitrocell exposure module using quartz crystal microbalances. Chem. Central J. 7(1):50. doi: 10.1186/1752-153X-7-50.
- AeroSolved, Computational Fluid Dynamics Code. 2017. Accessed November 14, 2017. http://www.aerosolved.com.
- Asgari, M., F. Lucci, and A. K. Kuczaj. 2019. Multispecies aerosol evolution and deposition in a bent pipe. J. Aerosol Sci. 129:53–70. doi: 10.1016/j.jaerosci.2018.12.007.
- Aufderheide, M., W.-D. Heller, O. Krischenowski, N. Mohle, and D. Hochrainer. 2017. Improvement of the cultex® exposure by radial distribution of the test aerosol. Exp. Toxicol. Pathol. 69(6):359–365. doi: 10.1016/j.etp.2017.02.004.
- Comouth, A., H. Saathoff, K. H. Naumann, S. Muelhopt, H.-R. Paur, and T. Leisner. 2013. Modelling and measurement of particle deposition for cell exposure at the air-liquid interface. J. Aerosol Sci. 63:103–114.
- Elghobashi, S. 1994. On predicting particle-laden turbulent flows. Appl. Sci. Res. 52(4):309–329. doi: 10.1007/BF00936835.
- Frederix, E., A. Kuczaj, M. Nordlund, A. Veldman, and B. Geurts. 2017. Eulerian modeling of inertial and diffusional aerosol deposition in bent pipes. Comput. Fluids 159:217–231. doi: 10.1016/j.compfluid.2017.09.018.
- Fujitani, Y., Y. Sugaya, M. Hashiguchi, A. Furuyama, S. Hirano, and A. Takamia. 2015. Particle deposition efficiency at air-liquid interface of a cell exposure chamber. J. Aerosol Sci. 81:90–99. doi: 10.1016/j.jaerosci.2014.10.012.
- Ishikawa, S., T. Suzuki, and Y. Nagata. 2016a. Analysis of cigarette smoke deposition within an in vitro exposure system for simulating exposure in the human respiratory tract. Beitr. Zur Tabakforsch. Int. Contrib. Tobacco Res. 27:20–29. doi: 10.1515/cttr-2016-0004.
- Ishikawa, S., Y. Kanemaru, H. Nara, K. Erami, and Y. Nagata. 2016b. Assessing the mutagenic activities of smoke from different cigarettes in direct exposure experiments using the modified Ames Salmonella assay. Mutat. Res. Genet. Toxicol. Environ. Mutagen 803–804:13–21. doi: 10.1016/j.mrgentox.2016.04.008.
- Kam, K. M., L. Zeng, Q. Zhou, R. Tran, and J. Yang. 2013. On assessing spatial uniformity of particle distributions in quality control of manufacturing processes. J. Manufact. Syst. 32:154–166. doi: 10.1016/j.jmsy.2012.07.018.
- Kim, J. S., T. M. Peters, P. T. O'Shaughnessy, A. Adamcakova-Dodd, and P. S. Thorne. 2013. Validation of an in vitro exposure system for toxicity assessment of air-delivered nanomaterials. Toxicol. in Vitro 27:164–173. doi: 10.1016/j.tiv.2012.08.030.
- Lacroix, G., W. Koch, D. Ritter, A. C. Gutleb, S. T. Larsen, T. Loret, F. Zanetti, S. Constant, S. Chortarea, B. Rothen-Rutishauser, P. S. Hiemstra, E. Frejafon, P. Hubert, L. Gribaldo, P. Kearns, J.-M. Aublant, S. Diabaté, C. Weiss, A. de Groot, and I. Kooter. 2018. Air-liquid interface in vitro models for respiratory toxicology research: consensus workshop and recommendations. Appl. Vitro Toxicol. 4(2):91–106. doi: 10.1089/aivt.2017.0034.
- Longest, P. W., and M. J. Oldham. 2006. Mutual enhancements of CFD modeling and experimental data: a case study of micron particle deposition in a branching airway model. Inhalation Toxicol. 18(10):761–771. doi: 10.1080/08958370600748653.
- Lucci, F., N. D. Castro, A. A. Rostami, M. J. Oldham, J. Hoeng, Y. B. Pithawalla, and A. K. Kuczaj. 2018. Characterization and modeling of aerosol deposition in Vitrocell® exposure systems – exposure well chamber deposition efficiency. J. Aerosol Sci. 23:141–160. doi: 10.1016/j.jaerosci.2018.06.015.
- Majeed, S., S. Frentzel, S. Wagner, D. Kuehn, P. Leroy, P. A. Guy, A. Knorr, J. Hoeng, and M. C. Peitsch. 2014. Characterization of the Vitrocell® 24/48 in vitro aerosol exposure system using mainstream cigarette smoke. Chem. Central J. 8(1):62. doi: 10.1016/j.tiv.2017.04.021.
- Morris, J. B. 2012. Biologically-based modeling insights in inhaled vapor absorption and dosimetry. Pharmacol. Therap. 136(3):401–413. doi: 10.1016/j.pharmthera.2012.08.017.
- Neilson, L., C. Mankus, D. Thorne, G. Jackson, J. DeBay, and C. Meredith. 2015. Development of an in vitro cytotoxicity model for aerosol exposure using 3D reconstructed human airway tissue; application for assessment of e-cigarette aerosol. Toxicol. Vitro 29(7):1952–1962. doi: 10.1016/j.tiv.2015.05.018.
- Oldham, M. 2006. Challenges in validating CFD-derived inhaled aerosol deposition predictions. Inhalation Toxicol. 18(10):781–786. doi: 10.1080/08958370600748752.
- Oldham, M. J., J. Zhang, M. J. Rusyniak, D. B. Kane, and W. P. Gardner. 2018. Particle size distribution of selected electronic nicotine delivery system products. Food Chem. Toxicol. 113:236–240. doi: 10.1016/j.fct.2018.01.045.
- OpenFOAM, 2015 OpenFOAM. Accessed September 8, 2015.http://www.openfoam.org.
- Paur, H.-R., F. R. Cassee, J. Teeguarden, H. Fissan, S. Diabate, M. Aufderheide, W. G. Kreyling, O. Hanninen, G. Kasper, M. Riediker, B. Rothen-Rutishauser, and O. Schmid. 2011. In-vitro cell exposure studies for the assessment of nanoparticle toxicity in the lung- a dialog between aerosol science and biology. J. Aerosol Sci. 42(10):668–692. doi: 10.1016/j.jaerosci.2011.06.005.
- Phalen, R. F. 1984. Inhalation studies: Foundations and techniques, 89. Boca Raton, FL: CRC Press.
- Raabe, O. G. 1968. The dilution of monodisperse suspensions for aerosolization. Am. Ind. Hygiene Assoc. J. 29(5):439–443. doi: 10.1080/00028896809343031.
- Raabe, O. G. 1972. Operating characteristics of two compressed air nebulizers used in inhalation experiments. Fission product inhalation program annual report 1971–1972, 1–6. Inhalation Toxicology Research Institute, Albuquerque, N.M., LF-45.
- Rafidi, N., F. Brogaard, L. Chen, R. Hakansson, and A. Tabikh. 2018. CFD and experimental studies on capture of fine particles by liquid droplets in open spray towers. Sustain. Environ. Res. 28(6):382–388. doi: 10.1016/j.serj.2018.08.003.
- Secondo, L. E., N. J. Liu, and N. A. Lewinski. 2016. Methodological considerations when conducting in vitro, air-liquid interface exposures to engineered nanoparticles aerosols. Crit. Rev. Toxicol. 47(3):225–262. doi: 10.1080/10408444.2016.1223015.
- Steiner, S., S. Majeed, G. Kratzer, G. Vuillaume, J. Hoeng, and S. Frentzel. 2017. Characterization of the Vitrocell® 24/48 aerosol exposure system for its use in exposures to liquid aerosols. Toxicol. In Vitro 42:263–272. doi: 10.1016/j.tiv.2017.04.021.
- Thorne, D., and J. Adamson. 2013. A review of in vitro cigarette smoke exposure systems. Exp. Toxicol. Pathol. 65(7–8):1183–1193. doi: 10.1016/j.etp.2013.06.001.
- Thorne, D., J. Kilford, R. Payne, J. Adamson, K. Scott, A. Dalrymple, C. Meredith, and D. Dillon. 2013. Characterisation of a Vitrocell® VC 10 in vitro smoke exposure system using dose tools and biological analysis. Chem. Central J. 7(1):146. doi: 10.1186/1752-153X-7-146.
- Thorne, D., A. Dalrymple, D. Dillon, M. Duke, and C. Meredith. 2015. A comparative assessment of cigarette smoke aerosols using an in vitro air-liquid interface cytotoxicity test. Inhalation Toxicol. 12:629–640. doi: 10.3109/08958378.2015.1080773.
- Tippe, A., U. Heinzmann, and C. Roth. 2002. Deposition of fine and ultrafine aerosol particles during exposure at the air/cell interface. J. Aerosol Sci. 33(2):207–218.
- Upadhyay, S., and L. Palmberg. 2018. Air-liquid interface: relevant in vitro models for investigating air pollutant-induced pulmonary toxicity. Toxicol. Sci. 164(1):21–30. doi: 10.1093/toxsci/kfy053.
- Weber, S., M. Hebestreit, T. Wilms, L. L. Conroy, and G. Rodrigo. 2013. Comet assay and air-liquid interface exposure system: a new combination to evaluate genotoxic effects of cigarette whole smoke in human lung cell lines. Toxicol. Vitro 27(6):1987–1991. doi: 10.1016/j.tiv.2013.06.016.