
 ?Mathematical formulae have been encoded as MathML and are displayed in this HTML version using MathJax in order to improve their display. Uncheck the box to turn MathJax off. This feature requires Javascript. Click on a formula to zoom.
Abstract
The extensive use of air filters has encouraged advances in both the fabrication and characterization of air filter technology. An affordable and accessible means of assessing the quality of air filters is greatly needed because of the high demand for these filters. We developed a personal air filter test (PAFT) system for measuring filter pressure drop, efficiency, and quality of filtration. The PAFT system utilizes a PM sensor (Sharp, GP2Y1010AU0F) to measure filtration efficiency. PM sensor performance was evaluated and optimized to guarantee its suitability for this application. The sensor performance evaluation studied the output responses to sampling flow, particle diameter, and PM sources. We also improved the sensor’s sensitivity. The experimental results show that the sensor had no significant influence on the sampling flow. The sensor output was highly dependent on the particle size and PM source, but its response curves remained linear, which was an advantage for filter efficiency measurement. We measured the efficiency of nanofiber filters of various efficiencies, comparing the results to a reference efficiency as measured by a CPC (TSI, 3772). The test resulted in a filtration coefficient (Kf), which was used to correct the PAFT efficiency measurement results. We also conducted filtration efficiency tests on commercial mask filters and the results showed good agreement to the reference, with a small average error of about 2.5%. The complete design of the PAFT and experimental methods is discussed in detail.
Copyright © 2020 American Association for Aerosol Research
EDITOR:
Introduction
Particulate matter (PM) air pollution is a global issue due to its negative impact on respiratory health (Karlsson et al. Citation2009). PM2.5 and PM10 can easily enter the respiratory system and harm the lungs (Fujii et al. Citation2014). In some countries, e.g., China, Bangladesh, Pakistan, and India, high mortality rates have been correlated to elevated levels of PM2.5 air pollution (Shi et al. Citation2018). Many attempts have been made to reduce PM pollution risk to the lungs, one of these being the use of air filter technology. The extensive use of air filters in vehicles (Lee and Zhu Citation2014), food processing industries (Brincat et al. Citation2016), building ventilation systems (Shi et al. Citation2013), and masks (Huang and Huang Citation2007) has encouraged advances in both the fabrication (Munir et al. Citation2009) and the characterization (Balgis et al. Citation2015; Matulevicius et al. Citation2014; Shi et al. Citation2013) of air filter technology. Characterization of filters usually involves measuring their pressure drop and filtration efficiency, with both parameters being necessary to determine the filter quality factor (Balgis et al. Citation2015).
Filter pressure drop can be easily measured by differential-type pressure sensors, but filtration efficiency measurements require more complex procedures and apparatus. To determine filter efficiency, we need to obtain the amount of particle captured on the filter, which can also be calculated by measuring the particle concentration before and after filtration. This is the most common method. Möritz et al. (Citation2001) measured HVAC (Heating, Ventilation, and Air Conditioning) filter retention capability for microorganisms by collecting them on 6-stage Andersen impactors. This method, however, takes months to obtain filter retention capability data and also has a large standard deviation (Möritz et al. Citation2001). Some researchers report filtration efficiency based on particle mass concentration (Newcomer et al. Citation2018; Wilkes Citation2002), but most researchers report efficiency values based on particle number concentrations (Matulevicius et al. Citation2014). Advanced air filter testers, such as the TSI-3160 and TSI-3140, even provide an electrostatic classifier and condensation particle counters (CPCs), allowing the filtration efficiency to be expressed against particle diameter to determine the most penetrating particle size (MPPS). However, such air filter test systems are expensive and bulky. The high demand for filters designed for daily use makes a lower cost and more accessible apparatus for assessing their quality a top priority. We therefore developed a personal air filter test (PAFT) system that was low-cost, lightweight, portable, easy to use, and capable of measuring filter pressure drop, efficiency, and quality factor.
The PAFT system utilizes a PM sensor (Sharp, GP2Y1010AU0F) and two differential pressure sensors (TE Connectivity Measurement Specialties, GA100-015WD; and Sensirion, SDP1000-L05) to measure filter efficiency and pressure drop, respectively. The PM sensor has been typically used for indoor or outdoor PM monitoring (Singer and Delp Citation2018; Li et al. Citation2018; Patel et al. Citation2017; Olivares and Edwards Citation2015; Dickinson et al. Citation2018). The sensor performance when used for filter tests, such as in PAFT, must be established experimentally and include the sensor output response to different sampling flow rates, particle size, and PM source. We also improved the sensor sensitivity and reduced the sensor zero offset by adding an external amplifier circuit. The PAFT system was evaluated by testing nanofiber filters of various efficiencies and comparing the measurement results to reference efficiency as measured by a CPC (TSI, 3772). We also used the PAFT system to evaluate some commercial mask filters. The complete design of the PAFT and experimental setup will be discussed in detail.
Methods
PM sensor
Many PM sensors are commercially available with varying designs of light source, photodetector, particle sampling flow, and electrical signal conditioning. One of the most popular low-cost PM sensors is the Sharp GP2Y1010AU0F (abbreviated as GP2Y) (Hapidin et al. Citation2019; Li et al. Citation2018; Singer and Delp Citation2018; Sousan et al. Citation2018; Li and Biswas Citation2017; Patel et al. Citation2017; Wang et al. Citation2015; Sharp Citation2006). The GP2Y sensor has many advantages: it is compact, easy to operate, durable, low-rated for current and voltage, and low cost, giving it wide applicability in smart homes, ventilation systems, air purifiers or air cleaners, and portable air quality monitors. The GP2Y sensor picture, schematic diagram, and sensor placement inside a box are shown in .
Figure 1. (a) Original GP2Y sensor; (b) GP2Y sensor box; and (c) diagram showing the GP2Y sensor working principle.
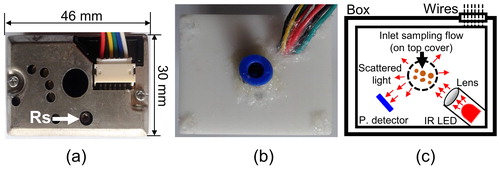
The GP2Y sensor relies on the collection of light scattered by particles to estimate PM concentration, as shown in . The sensor consists of a particle sampling flow, focused light source, photodetector, and signal conditioning. The particle sampling flow delivers the particles into the sensor detection area (dashed circle line in ). Unlike most PM sensors that use a fan or heating element to draw the sampling flow (Liu et al. Citation2017), the GP2Y relies on random diffusion to transport particles into the detection area. This minimizes the need for components that might otherwise drive up the GP2Y’s cost and low current consumption (typically 11 mA).
A focused light source illuminates the particles entering the detection area. The light source originates from an infrared light-emitting diode (IR-LED) equipped with a convex lens. The scattered light is then detected by a photodetector, which is configured with a 120° angle to the light source, preventing incidental light from interfering with the scattered light signal. By contrast, PM sensors, such as HPMA115S0-XXX, Shinyei PPD42NS, Nova fitness SDS011, and Winsen ZH03 (Hapidin et al. Citation2019), configure the photodetector to the light source at an angle of 90°, making a light trap necessary. The scattered light intensity has a linear dependency on the particle concentration at a specific operating range (Li and Biswas Citation2017). Therefore, the magnitude of the photodetector signal represents the particle concentration. A signal conditioning circuit converts the photodetector signal into an analog output voltage, which typically ranges from 0.9 to 3.4 V (Sharp Citation2006). According to the GP2Y sensor datasheet, an output voltage of 3.4 V should correspond to a detected particle mass concentration of about 500 µg/m3 using cigarette smoke as the test particles (Sharp Citation2006). The GP2Y sensors are provided with a sensitivity adjustment resistor (Rs) to change the sensor sensitivity (see ). The default Rs setting will make the GP2Y sensitivity approximately 0.5 V/(0.1 mg/m3) for cigarette smoke as the test particles (Sharp Citation2006). The change in Rs value alters the sensor sensitivity and zero offsets that will be discussed later.
The GP2Y sensor should be operated at the company recommended supply voltage of (5.0 ± 0.5) V, and the IR-LED of the sensor should be driven by a voltage pulse with a width of (0.32 ± 0.02) ms and a period of (10 ± 1) ms. After the rising edge of the IR-LED pulse, the output voltage of the sensor will rise to a maximum value and then fall to its initial level. The maximum output voltage value during one IR-LED pulse represents the particle concentration. The maximum output voltage values are obtained at 0.28 ms after the rising edge of the IR-LED pulses.
In this experiment, we employed a programmable analog-to-digital converter (ADC) module (PRJ, Teensy 3.2) to generate the IR-LED voltage pulses and capture the GP2Y output voltage. The Teensy 3.2 has 16-bit high-speed ADC ports. The ADC recorded the GP2Y output voltages every 10 ms, averaged 50 data points, and displayed the averaged data every 0.5 s. For the purposes of the PAFT, the GP2Y sensor was placed in a specially designed box () to prevent particle leakage. The box was further equipped with sealed fittings to connect the box with a regulated air flow and tubing system.
PAFT design
The performance evaluation of an air filter involves measurement of parameters such as filtration efficiency, pressure drop, and quality factor. Usually, filtration efficiency is measured as a function of particle size (e.g., Dhaniyala and Liu, Citation1999) allowing determination of the most penetrating particle size (MPPS) (Matulevicius et al. Citation2016). Such measurement can be done by an instrument such as a scanning mobility particle sizer (SMPS; Zhang et al. Citation2010). The SMPS system, however, requires many components that make it bulky and expensive (Wang and Flagan Citation1989). We therefore designed a simplified personal air filter test (PAFT) system as shown in to calculate the quality factor of an air filter by measuring its pressure drop and efficiency independent of particle size.
Figure 2. The personal air filter test (PAFT) design.
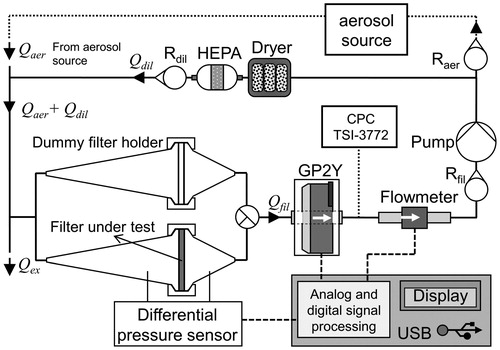
The PAFT design in consisted of an air flow supply, a filter holder, a differential pressure sensor, a GP2Y sensor, analog and digital signal processors, and a flowmeter. The air flow inside the PAFT was generated by a pump equipped with a silica desiccant dryer and a HEPA filter to provide a dry and clean air flow. The volumetric air flow rate in the PAFT system was controlled by rotameters: Raer controlled the air flow to the aerosol source; Rdil controlled the dilution air flow; and Rfil controlled the air flow passing through the filter under test (FUT). The aerosol source for the PAFT system could be atomizers (ultrasonic or jet), PM2.5 aerosol sources, or aerosol from a DMA outlet. In this case, rotameter Raer was an additional component for adjusting the air flow carrying the aerosol from the selected aerosol sources. The aerosol concentration for the filter efficiency measurement was adjusted by selecting appropriate dilution air flow (Qdil). A flowmeter (Honeywell, AWM5101VN) was employed to measure the air flow through the filter (Qfil) and calculate the filter face velocity. The pressure inside the filter holder was kept at ambient pressure during the measurement by allowing the excess airflow (Qex) to flow through an opening tube before the filter holder. Thus, to prevent the ambient particles from entering into the system, Qaer + Qdil must be higher than Qfil.
The filter under test (FUT) was placed tightly inside the filter holder. The filter holder containing the FUT was placed adjacent to an identical dummy filter holder. A three-way valve switched the dummy filter holder and the filter holder containing the FUT to measure the upstream and downstream particle concentration, respectively. The filtration efficiency was measured for a face velocity of 5.3 cm/s. This face velocity value is commonly used for nanofiber filter evaluation and is also typical for industrial equipment (Zhang et al. Citation2017; Zhu et al. Citation2017; Balgis et al. Citation2015; Matulevicius et al. Citation2014). The inner diameter of the filter holders was 2.0 cm, so Qfil for this face velocity was 1.0 L/min.
The filter penetration (P) is calculated as the ratio of particle concentration downstream of the FUT (Ndown) to that upstream (Nup) and the filtration efficiency (η) is defined as
(1)
(1)
In the PAFT, the GP2Y sensor was used to measure the upstream and downstream particle concentrations. As shown in , a CPC (TSI, 3772) was connected to the PAFT system as a reference for evaluation purposes only. During the filter efficiency measurement, the output voltage of the GP2Y and the particle concentration measured by the CPC were simultaneously recorded, and the data from both devices were compared and analyzed. We found that the filter efficiency of the PAFT system can be calculated directly from the GP2Y output voltage instead of using the particle number concentration.
The filter pressure drop (ΔP) was obtained by measuring the pressure difference across the filter at a Qfil setting. We used two differential pressure sensors, the GA100-015WD (abbreviated as GA) from TE Connectivity Measurement Specialties and the SDP1000-L05 (abbreviated as SDP) from Sensirion. These sensors have a different measurement range of 0–3.74 kPa for the GA, and -5–125 Pa for the SDP. Even though the SDP has a lower measurement range, its accuracy and resolution are better than those of the GA sensor. The choice of sensor should therefore depend on the measurement needs. For instance, in some cases, nanofibrous and regular mask filters could have a very low-pressure drop that only an SDP could measure.
The data from the filter efficiency and pressure drop measurement were used to calculate the filter quality factor (qf) using the following equation (Yun et al. Citation2007; Podgórski et al. Citation2006):
(2)
(2)
The qf indicates the efficiency of the filter per drop in pressure across the filter. A high qf indicates a more desirable filter, independent of cost. The GP2Y sensor, differential pressure sensors, and flowmeter were connected to an analog to digital signal processing system, and the processed data were displayed on an LCD screen. The processed sensor data can also be transferred to a graphical user interface (GUI) on a personal computer (PC) via universal asynchronous receiver/transmitter (UART) communication protocol.
Experimental setup
GP2Y sensor evaluation
The performance evaluation of the GP2Y sensor has been reported by many researchers (Hapidin et al. Citation2019; Li et al. Citation2018; Singer and Delp Citation2018; Sousan et al. Citation2018; Li and Biswas Citation2017; Patel et al. Citation2017; Wang et al. Citation2015). Briefly, they found that the GP2Y output response was linearly correlated to the particle mass concentration and the output response depended on particle size, density, morphology, size distribution, refractive indices, and material composition. Wang et al. (Citation2015) also found that each GP2Y sensor product might have a slightly different linearity and sensitivity. We therefore focused our evaluation on correlating the GP2Y output response to the particle number concentration instead of to the particle mass concentration.
depicts the experimental setup to evaluate and optimize the GP2Y sensor performance. The setup consisted of an air flow control, aerosol source, electrostatic classifier, and measurement block. The air flow control block provided a controlled, stable, dry, and clean air flow to the system. The aerosol source block generated aerosol for testing the GP2Y sensor. The aerosol for this experiment employed the jet atomization of polystyrene latex (PSL) suspensions with the atomizer flow rate (Qatom) controlled by the Mass Flow Controller 2 (MFC2) (Horriba, STEC SEC-E40). A cyclone separator eliminated coarse water droplets, and a diffusion dryer dried the atomized PSL particles. The aerosol concentration was adjusted by adding a clean dilute air flow controlled by the MFC1 (Horriba, STEC SEC-500).
Figure 3. Experimental setup for evaluating and optimizing the GP2Y sensor performance.
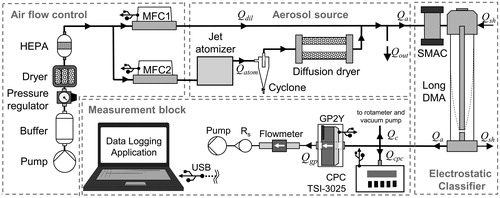
PSL particles are widely used to calibrate and evaluate aerosol instruments because of their spherical shape and narrow size distribution. Nevertheless, non-PSL particles may be present after atomization due to impurities in the suspension and in the deionized water used to dilute the suspension (Stabile et al. Citation2013; Kim et al. Citation2010). The deionized water droplets that do not contain a PSL particle usually end up as small-sized particles (size mode ∼ 21.5 nm) after droplet evaporation (Stabile et al. Citation2013). To eliminate the impurities, we charged particles using a surface micro-discharge aerosol charger (SMAC; Kwon et al. Citation2006) prior to passing them through a long differential mobility analyzer (LDMA; Song et al. Citation2006). The particles from the LDMA outlet were subsequently delivered to the measurement block where the GP2Y setup and a CPC (TSI, 3025a) were placed. The GP2Y setup consisted of a pump, rotameter Rs, and a flowmeter to provide the GP2Y external sampling flow (Qgp). The LDMA sheath flow (Qsh) and aerosol flow (Qa) were set at 15 and 1.5 L/min, respectively. A rotameter connected to a vacuum pump drew a compensating air flow (Qc) so that Qa/Qsh could be maintained at a constant ratio of 1/10.
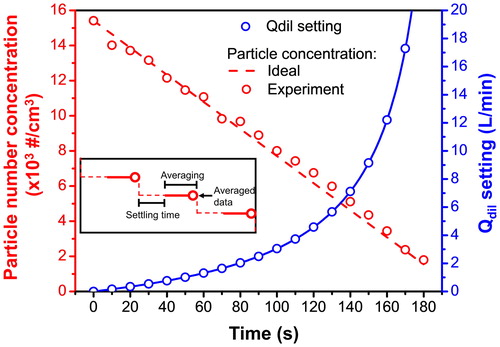
During the GP2Y evaluation, PSL particle concentrations were varied by dilution, by mixing the particle-laden air flow (Qatom) with a clean dilution air flow (Qdil). The Qdil was automatically and gradually increased by a GUI application with the increasing profile following the equation
(3)
(3)
where Ci and Cf are the initial and final particle concentrations, respectively. shows the particle concentration profile decreasing linearly with increasing Qdil following EquationEquation (3)
(3)
(3) . To maximize the range of generated particle concentrations, we also decreased the atomizer air flow (Qatom) with the Qdil set to its maximum limit. The GP2Y output voltage and the CPC readings were recorded after a period of settling. The resulting data were averaged and displayed in the data logging application.
Figure 4. The particle concentration decreasing profile by the gradual increase of Qdil.
Besides PSL particles, we also used PM2.5 test particles from the smoke of burning incense and mosquito repellant. However, due to the difficulty of controlling the burning process of these sources, stable PM2.5 generation over a long measurement period was difficult to achieve. Therefore, for PM2.5 particle sources, we varied the particle concentration using a decay method (Hapidin et al. Citation2019).
PAFT evaluation
To evaluate the PAFT performance, we tested some filters of varying efficiencies. To obtain the filter samples, we fabricated the filter membranes using an electrospinning technique, the details of which are given in the Supplementary Information (SI). We also employed the electrostatic classifier shown in to eliminate any smaller particles due to suspension impurity. To ensure charge-free conditions during the filter tests, the charged PSL particles from the LDMA were neutralized by placing another SMAC and a condenser downstream of the outlet of the LDMA.
The filter efficiencies measured by the GP2Y sensor (ηGP2Y) were compared to reference efficiencies measured by the CPC (ηCPC) (for the CPC placement see ). The error in the efficiency measurement is calculated as follows:
(4)
(4)
Test particles
Monodisperse polystyrene latex (PSL) particles
The PSL particles of varying geometric mean diameter (dpg) of 95, 163, 216, 234, and 303 nm were synthesized by a liquid-phase synthesis method. The synthesis was done in a batch-process reactor system consisting of a batch-glass reactor, a condensation glass tube, a nitrogen gas inlet, a mantle heater with a temperature controller, and a magnetic stirrer. The complete PSL making process is described in the Supplementary Information (SI).
PM2.5 sources
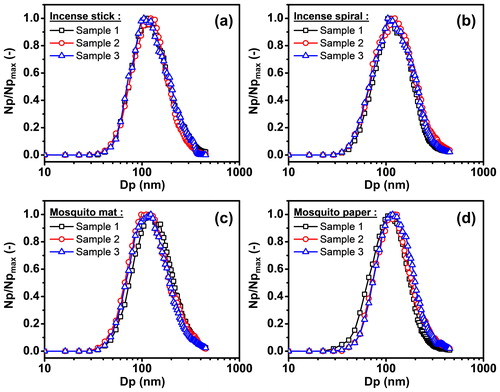
The PM2.5 test particles were produced by burning incense and mosquito repellant. We selected a number of commercially available incense and mosquito repellant products including incense sticks (Zheng Tan, Premium sandalwood incense stick), incense spirals (San Sheng Yuan, Artemisia mini coil incense), mosquito mats (Baygon, Max), and mosquito papers (HIT, Magic Expert). The burning incense and mosquito repellant were chosen since they have similar properties to ambient PM as well as being representative of PM2.5 sources (Zhang et al. Citation2016; Dacunto et al. Citation2015; Liu et al. Citation2015). shows the size distribution of the PM source samples. All samples had a similar size distribution.
Figure 5. The particle size distribution of PM sources for (a) incense stick, (b) incense spiral, (c) mosquito mat, and (d) mosquito paper. Each test consisted of three replicates.
Filter preparation
To evaluate the PAFT, we developed filters with a wide range in filtration efficiency. We created these using an electrospinning apparatus (Nachriebe 601, Integrated Laboratory of Materials and Instrumentation, Department of Physics, ITB, Bandung, Indonesia) (Zulfi et al. Citation2018). The polymer for making the filters used polyacrylonitrile (PAN) powder (purchased from Sigma Aldrich, Singapore) with a molecular weight of 150 kDa. Details are given in the SI.
Results and discussion
Evaluation and optimization of GP2Y sensor
GP2Y output response to sampling flow
To optimize the operation of GP2Y, we compared the GP2Y output response to particle number concentration at different sampling flow rates ranging from 0.05 to 2.82 L/min. We then determined the linearity of the GP2Y sensor response (output voltage) to particle number concentration (). The PSL particles used for this experiment had a dpg of 303 nm. The figure depicts a linear relationship between the particle number concentration and the output voltage of the GP2Y. The R2 value for all flow rates ranged from 0.9949 to 0.9987.
Figure 6. The GP2Y output voltage against particle number concentration at different sampling flow rates.
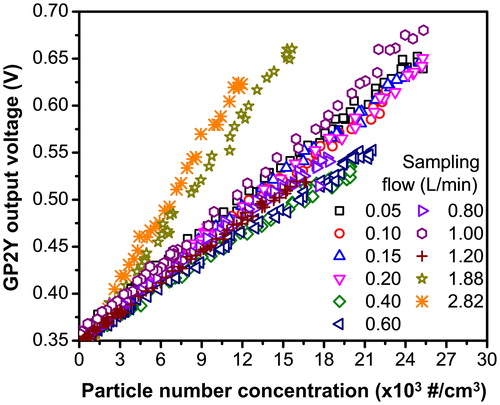
Previous experiments have shown the original GP2Y (GP2Y without external sampling flow) response to particle number concentration to have an R2 value of 0.960 (Hapidin et al. Citation2019). In the present results, almost all GP2Y responses had R2 values exceeding this number. This difference might be due to the addition of the sampling flow, which replaced the original sensor diffusive flow. The original GP2Y sensor relied strictly on diffusion to transport particles into the detection area, the slowness of which mechanism likewise slows the sensor response to changes in particle concentration and thus leads to measurement error (Wang et al. Citation2015). Wang et al. (Citation2015) have evaluated a commercial PM monitoring product (TSI-AirAssure PM2.5 Indoor Air Quality Monitor), which also utilizes the GP2Y sensor. The GP2Y sensor of this product is modified by adding an external fan to provide sampling flow through the sensor in a similar fashion as in the PAFT. They found that the GP2Y sensor with the sampling flow had better linearity than the original one. However, because of the box encapsulating our GP2Y sensor, we were unable to obtain GP2Y responses without an external sampling flow for purposes of comparison.
As shown in , the dependency of the GP2Y sensor sensitivity and zero offsets on the sampling flow cannot be conclusively determined. Significant difference in output response was not observed at sampling flow rates of 0.05 to 1.20 L/min. However, a higher output response was observed at sampling flow rates of 1.88 and 2.82 L/min. During the experiment with the sampling flow of 0.05 to 1.20 L/min, the Qa/Qsh ratio of the LDMA was maintained at a constant of 1/10. However, at sampling flows of 1.88 and 2.82 L/min and with the Qsh of the LDMA at 15 L/min, the Qa/Qsh ratio could not be set to 1/10, causing the increase in the sensor output response. This result implied that the sampling flow could not improve the sensor sensitivity or reduce the zero offset. However, because the filter holder had an inner diameter of 2 cm, we chose the GP2Y sampling flow of 1.00 L/min. This sampling flow rate resulted in a filter face velocity of 5.3 cm/s, which is the standard for filter efficiency measurement.
GP2Y output response to different particle size and source
We evaluated the GP2Y responses for different particle sizes and PM sources. shows the GP2Y output responses for PSL particles with the sizes of 95, 163, 216, 234, and 303 nm. The figure indicates a correspondence of sensor sensitivity to particle size similar to the Mie theory scattered intensity curve (Li and Biswas Citation2017). The sensor output varied linearly with particle number concentration with an R2 of 0.9247, 0.9929, 0.9924, and 0.9983 for particles sizes of 163, 216, 234, and 303 nm, respectively. Small particles (95 nm) were almost undetected by the sensor. Given the sensor output voltage limit of 3.4 V, when a linear fit is applied to , the maximum detectable particle number concentration should be 1.55 × 10⁷, 6.58 × 10⁶, 1.21 × 10⁶, 8.49 × 10⁵, and 2.38 × 10⁵ #/cm3 for PSL particles sized 95, 163, 216, 234, and 303 nm, respectively.
Figure 7. The GP2Y output responses to (a) PSL particles of various sizes (95, 163, 216, 234, and 303 nm) and (b) PM from various sources (incense stick, incense spiral, mosquito mat, and mosquito paper).
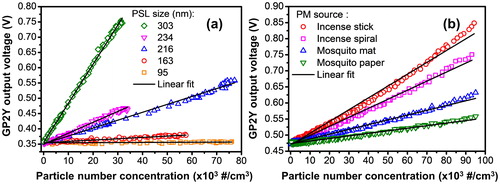
The GP2Y responses to the different PM2.5 sources also show a linear relationship to particle number concentration with R2 values of 0.9941, 0.9918, 0.9905, and 0.9776 for the incense sticks, incense spirals, mosquito mats, and mosquito papers, respectively (). Although the size distribution of all PM2.5 sources was similar (see ), the GP2Y response was different, which might be due to differences in density, refractive index, and material composition. Different particle densities and refractive index can lead to different scattering intensity by the particles (Wang et al. Citation2015). Moreover, the GP2Y uses an infrared light, which was likely absorbed by organic compounds present in these PM sources. Wang et al. (Citation2015) reported that the organic compounds in particles can absorb light due to their carbon-carbon bond vibrations. Since each PM source sample may have a different organic composition, the proportion of the light absorbed by each sample will also be different, leading to a different sensor response.
GP2Y sensor sensitivity improvement
The sensor sensitivity is explained in the SI. From , the original GP2Y sensitivity was about 12.8 and 3.7 µV/(#/cm3) for PSL (dpg of 303 nm) and incense stick particles, respectively. For the PAFT application, the original GP2Y sensitivity was inadequate, necessitating improvements. As mentioned before, the GP2Y sampling flow could not improve either the sensor sensitivity or the sensor zero offsets. Therefore, we improved the GP2Y sensor sensitivity and the zero offset by adjusting the sensor gain factor and adding additional components.
A sensitivity resistor (Rs) already connected to the internal amplifier circuit of the original GP2Y sensor (shown in ) allows for an adjustment of the sensor’s sensitivity. The default Rs value may be different among sensors. The GP2Y sensor used in this experiment had an Rs value of 13.4 kΩ, which according to the product datasheet, should give a sensor sensitivity of about 0.5 V/(0.1 mg/m3)(Sharp Citation2006). shows the sensor response to various Rs values using PSL with a dpg of 303 nm. The sensor sensitivity increased as the Rs value decreased, as indicated by the slope of the linear fit (). However, decreasing the Rs value caused an increase in the zero offset, as shown in , reducing the measurement resolution. We therefore added a high-speed amplifier component (Burr-Brown, INA111) to amplify the sensor output voltage and thereby reduce the zero offset.
Figure 8. (a) GP2Y output responses to different Rs values using 303 nm PSL particles; (b) the effect of different Rs values on the intercept and slope of the linear fit to the data; (c) the amplified GP2Y output response compared to the original response. The experiment was done using 303 nm PSL particles at 1.00 L/min.
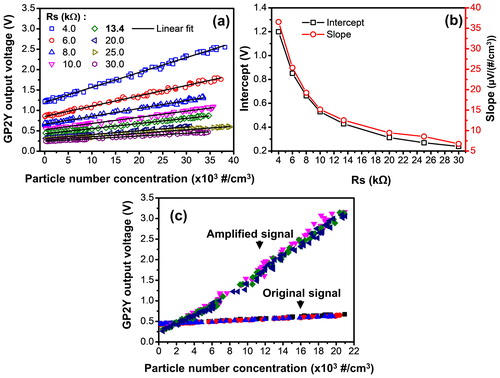
shows the GP2Y output response before conditioning (original signal) and after conditioning (amplified signal). The GP2Y sensor with a signal conditioning circuit had a significantly higher sensitivity and lower zero offset. However, the R2 value decreased slightly from 0.9954 for the original signal output to 0.9907 for the amplified signal output. The replicate test on the conditioned GP2Y sensor showed a consistent response, suggesting improved precision between these units. For the PAFT system, adding a differential-type amplifier circuit was simultaneously effective in increasing the sensitivity and reducing the zero offset. For sensor applications in large scale, distributed, and battery-operated air quality monitoring systems, the addition of the external sensor conditioning circuit may cause an increase in space, wattage, and cost, which is not desirable for large network operations. In such cases, a sensitivity adjustment via Rs value may be a more practical solution.
Evaluation of PAFT
GP2Y sensors are usually implemented in pollution monitoring networks or PM detectors to measure the mass concentration (mtotal) of PM. However, in this experiment, the GP2Y sensor output was instead linked to the particle number concentration (N). The particle number and mass concentration detected by the GP2Y sensor correlated with each other. Considering the GP2Y particle inlet design, the particles are counted as an ensemble rather than one by one. Therefore, to calculate a mass concentration based on the number concentration, we need to know the particle size distribution function, nd(dp) = dN/d(dp), and the particle density (ρp) (Li and Biswas Citation2017). The mass concentration detected by the sensor can then be expressed as follows:
(4)
(4)
where dp is the particle diameter, assuming the particles are spherical.
Furthermore, the mass concentration detected by the sensor can also be related to the sensor output signal (S) as follows:
(5)
(5)
where G is the signal gain factor, K is the sensor calibration factor, and S0 is the sensor zero offset at no particles, which typically ranges from 0–1.5 V (Sharp Citation2006). According to the manufacturer datasheet, the GP2Y sensor has a typical maximum output signal (S) of 3.4 V with a typical sensitivity of 0.5 V/(0.1 mg/m3) (Sharp Citation2006). The G value depends on the setting of the external signal gain to the sensor, or in this case, the gain of the instrumentation amplifier circuit. The K value depends on the internal signal conditioning of the GP2Y sensor, i.e., photodetector response, photodetector signal conditioning, and internal gain.
The mass concentration from EquationEquation (4)(4)
(4) can be derived and simplified to obtain the number concentration by applying the method of moments (Li and Biswas Citation2017; Wang et al. Citation2015). The number concentration (N) derived by the method of moments is expressed as follows (Li and Biswas Citation2017):
(6)
(6)
(7)
(7)
where σg and dpg represent the geometric standard deviation and the geometric mean diameter, respectively. The expression of the filtration efficiency can be obtained by substituting EquationEquation (7)
(7)
(7) for EquationEquation (1)
(1)
(1) :
(9)
(9)
where the subscript down and up denote the downstream and upstream particle conditions, respectively. We can see that some particle and sensor parameters (ρp, G, and K) are canceled out. However, the exponent terms make the efficiency equation complex. The filtration of particles by fibrous filters mainly involves diffusion, interception, and impaction mechanisms. Each mechanism dominates in different particle size ranges. For typical filtration face velocities (∼5 cm/s), particles larger than 1 µm are primarily captured on fibers by impaction and interception mechanisms, for sub-micron particles (0.1 to 1 µm) by interception and diffusion, and for ultrafine particles (<0.1 µm) by diffusion. The size dependent process of these filtration mechanisms results in an MPPS (Rajak et al. Citation2019). This also means that the particle size distribution will likely shift after the filtration process, changing the dpg and σg. While the dpg certainly affected the sensor output, as shown in , Liu et al. (Citation2017) also found that the σg affected the sensor output as particles with a higher σg (wider particle size distribution) contain more large particles, leading to a higher sensor output (Liu et al. Citation2017).
To simplify the equation, the exponential term was named the filtration coefficient (Kf), which is determined experimentally. Thus, EquationEquation (9)(9)
(9) can be rewritten as
(10)
(10)
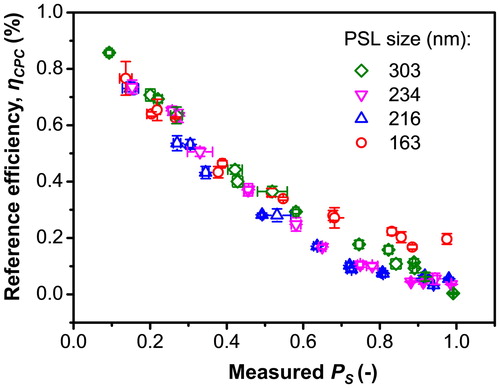
where PS = (S-S0)down/(S-S0)up. shows the experimental result of the PS measurement by the PAFT compared to the reference efficiency (ηCPC). The reference efficiency consisted of the efficiency values Ndown and Nup as measured by the CPC. The measurement was done using PSL particles with dpg of 303, 234, 216, and 163 nm. The figure depicts a similar trend for the ηCPC vs. PS for PSL with dpg of 303, 234, and 216 nm. For the 163 nm particles, a large deviation from the measured PS value occurred, especially for the filters with low efficiency. This was due to a small output signal from the GP2Y sensor. As shown in , the GP2Y gave a significantly smaller output response for 163 nm particles than for the other particle sizes, which could lead to inaccurate and erroneous filter efficiency measurement.
Figure 9. The comparison of Ps measured by the PAFT with the reference filter efficiency measured by the CPC reference instrument using PSL test particles at 163, 216, 234, and 303 nm.
We conducted a linear fit to the ηCPC vs. PS data to obtain the Kf, with the results shown in . The linear fit had a low coefficient of determination for some particle sizes. Therefore, we also applied polynomial fitting, which resulted in a higher coefficient of determination, to determine Kf. The fitting with the polynomial equation was empirically based on the best fit to the efficiency data.
Table 1. The fitting results to the ηCPC vs. PS data from .
Testing of commercial mask filters
The PAFT system was used to test the performance of selected commercial mask filters. We chose mask samples with different prices and factory rated efficiency, as listed in . The prices of the masks ranged from 0.023 to 16.04 USD per unit. We believe that pricing can reflect performance, as the masks with relatively high prices generally feature a more advanced design.
Table 2. Commercial mask filter samples used in this experiment.
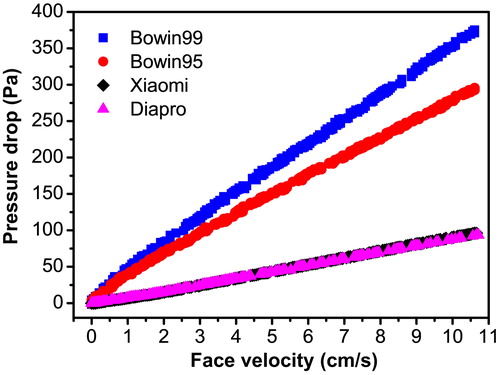
depicts the pressure drop of the masks as face velocity varied. The Xiaomi and Diapro pressure drops were measured by the SDP sensor because the pressure drop was relatively low (below 125 Pa for the face velocity of 10 cm/s). By contrast, the Bowin99 and Bowin95 had higher pressure drops and were measured by the GA sensor. The pressure drop of the mask samples showed a linear increase to the face velocity, which is consistent with Darcy’s law (Rajak et al. Citation2019). The pressure drops of the Diapro, Xiaomi, Bowin95, and Bowin99 masks at the face velocity of 5.3 cm/s were 45.50 ± 0.14, 46.57 ± 0.19, 156.81 ± 1.43, and 196.59 ± 1.19 Pa, respectively.
Figure 10. The pressure drop across the commercial filter masks tested.
shows the efficiency of the mask samples measured using 303, 234, 216, and 163 nm PSL particle sizes. The efficiency values were calculated by EquationEquation (10)(9)
(9) using the Kf = 1 (experimental data), and the results compared to calculations using the Kf from linear and polynomial fittings. Briefly, the correction to the efficiency calculation using Kf from polynomial fitting could reduce the average error to about 2.5% for the 303, 234, and 216 nm PSL particle sizes. By contrast, the average error for the 163 nm particle size was higher, at about 4.44%. As previously mentioned, the GP2Y output signal for a particle size of 163 nm was low, and the measured efficiency at this particle size or below had high uncertainty and could lead to inaccurate results. These results indicated that the PAFT system would be better applied to larger particle sizes.
Table 3. The efficiency of the mask filter samples, which were measured using PSL particles with the dpg of 303, 234, 216, and 163 nm and the face velocity of 5.3 cm/s.
The quality factor (qf) of the mask samples can be calculated using EquationEquation (2)(2)
(2) and the data in . Using the reference efficiency data, the qf of Diapro, Xiaomi, Bowin95, and Bowin99 for the 303 nm particle size was 0.030, 0.092, 0.024, and 0.022 Pa−1, respectively, whereas, using the data with the Kf from the polynomial fitting resulted in qf of 0.032, 0.082, 0.019, and 0.017 Pa−1, respectively. Xiaomi demonstrated a significantly higher quality factor than the other masks because it had both an efficiency close to that of the Bowin99 and a pressure drop as low as that of the Diapro mask. The relatively high price of the Xiaomi filter seems reasonable given its quality factor. Produced by the same company, the Bowin95 and Bowin99 masks had similar filter designs demonstrating a relatively similar high-pressure drop (almost three times that of the Diapro and Xiaomi masks). Although they have relatively high efficiency, the high-pressure drop in the Bowin95 and Bowin99 reduces their quality factor. The high-pressure drop might be the reason the company equips the masks with air valves to ease breathing (the Bowin95 has one air valve, and the Bowin99 two). Unfortunately, the current PAFT filter holder design could not include the valves in the test. The Diapro mask had the poorest collecting efficiency of the test samples. At the lowest price point, the Diapro mask consists of only three layers of nonwoven fabrics (prefilter, substrate, and main filter membrane) with poor sealing.
Future applications
The PAFT system performed well in measuring filter pressure drop and efficiency, with an average measurement error of about 2.5%. The portability and low cost of the device could prove beneficial for various applications. For instance, the system could be implemented to monitor the quality of HVAC filters (Möritz et al. Citation2001), portable filters (Newcomer et al. Citation2018), and cabin filters (Bull Citation2008). Real-time monitoring of these filters could determine when the filters should be replaced. The PAFT system can be used in filter or mask production sites for product quality control. The portability of the PAFT also makes it possible to directly assess the filter performances of ambient PM sources, e.g., PM in industrial sites, heavy-traffic roads, residences, and offices.
Conclusions
A new personal air filter test (PAFT) system was developed capable of measuring the pressure drop, efficiency, and quality factor of a range of filter types. The pressure drop measurement utilized two differential pressure sensors (TE Connectivity Measurement Specialties, GA100-015WD; Sensirion, SDP1000-L05), while the efficiency was measured by a commercial PM sensor (Sharp, GP2Y1010AU0F). The characterization of the PM sensor established its output response to different particle sizes, PM sources, and sampling flow rates. The sampling flow rate had a minor effect on the GP2Y sensor response. The experimental results showed that even though the sensor output largely depended on particle size and PM source, sensor response to particle number concentration was largely linear. The sensor output response to 163, 216, 234, and 303 nm PSL particles had a high linearity with an R2 of 0.9247, 0.9929, 0.9924, and 0.9983, respectively. For PM2.5 test particles from the smoke of incense sticks, incense spirals, mosquito mats, and mosquito papers, the R2 were 0.9941, 0.9918, 0.9905, and 0.9776, respectively. For the filter efficiency calculation, the high linearity of the sensor response cancels out the sensor calibration factor (K), gain factor (G), and particle density (ρp). The PAFT system was evaluated by measuring the efficiency of nanofiber filters and comparing the results to a reference efficiency measured by a CPC. The evaluation resulted in Kf values, based on the reference, which were used to correct the efficiency measurements. We also used the PAFT to test the efficiency of selected commercial mask filters, comparing the results to the reference. The efficiency of the mask filters, as measured by the PAFT, showed good agreement with the reference efficiency, with an average error of about 2.5% for the particle sizes of 216, 234, and 303 nm, but showed poor performance for particles sizes less than about 163 nm. Thus, the PAFT system can be used to quantitatively assess filter performance.
uast_a_1678734_sm1327.docx
Download MS Word (22.9 KB)Acknowledgment
D.A.H. gratefully acknowledges the Ministry of Research, Technology, and Higher Education Indonesia for the provision of a master leading to doctoral scholarship (PMDSU). The authors thank Prof. Kikuo Okuyama, Prof. Takafumi Seto, and Dr. Eng. Ferry Iskandar for providing LDMA and SMAC apparatus. D.A.H. thanks Widya Sinta Mustika, M.Si. and Iswanti Sihaloho, S.Si. for their technical support during the experiment.
Additional information
Funding
Related Research Data
References
- Balgis, R., C. W. Kartikowati, T. Ogi, L. Gradon, L. Bao, K. Seki, and K. Okuyama. 2015. Synthesis and evaluation of straight and bead-free nanofibers for improved aerosol filtration. Chem. Eng. Sci. 137:947–54. doi:10.1016/j.ces.2015.07.038.
- Brincat, J. P., D. Sardella, A. Muscat, S. Decelis, J. N. Grima, V. Valdramidis, and R. Gatt. 2016. A review of the state-of-the-art in air filtration technologies as may be applied to cold storage warehouses. Trends Food Sci. Technol. 50:175–85. doi:10.1016/j.tifs.2016.01.015.
- Bull, K. 2008. Cabin air filtration: Helping to protect occupants from infectious diseases. Travel Med. Infect. Dis. 6 (3):142–4. doi:10.1016/j.tmaid.2007.08.004.
- Dacunto, P. J., N. E. Klepeis, K.-C. Cheng, V. Acevedo-Bolton, R.-T. Jiang, J. L. Repace, W. R. Ott, and L. M. Hildemann. 2015. Determining PM2.5 calibration curves for a low-cost particle monitor: Common indoor residential aerosols. Environ. Sci.: Processes Impacts 17 (11):1959–66. doi:10.1039/C5EM00365B.
- Dickinson, K. L., M. Dalaba, Z. S. Brown, R. Alirigia, E. R. Coffey, E. Mesenbring, M. Achazanaga, D. Agao, M. Ali, E. Kanyomse, et al. 2018. Prices, peers, and perceptions (P3): Study protocol for improved biomass cookstove project in northern Ghana. BMC Public Health 18 (1):1209. doi:10.1186/s12889-018-6116-z.
- Dhaniyala, S., and B. Liu. 1999. Investigations of particle penetration in fibrous filters part I. Experimental. J. IEST 42 (1):32–40. doi:10.17764/jiet.42.1.k71lm163x574w701.
- Fujii, Y., W. Iriana, M. Oda, A. Puriwigati, S. Tohno, P. Lestari, A. Mizohata, and H. S. Huboyo. 2014. Characteristics of carbonaceous aerosols emitted from peatland fire in Riau, Sumatra, Indonesia. Atmos. Environ. 87:164–9. doi:10.1016/j.atmosenv.2014.01.037.
- Hapidin, D. A., C. Saputra, D. S. Maulana, M. M. Munir, and K. Khairurrijal. 2019. Aerosol chamber characterization for commercial particulate matter (PM) sensor evaluation. Aerosol Air Qual. Res. 19 (1):181–94. doi:10.4209/aaqr.2017.12.0611.
- Huang, J. T., and V. J. Huang. 2007. Evaluation of the Efficiency of Medical Masks and the Creation of New Medical Masks. J. Int. Med. Res. 35 (2):213–23. doi:10.1177/147323000703500205.
- Karlsson, H. L., J. Gustafsson, P. Cronholm, and L. Möller. 2009. Size-dependent toxicity of metal oxide particles-A comparison between nano- and micrometer size. Toxicol. Lett. 188 (2):112–8. doi:10.1016/j.toxlet.2009.03.014.
- Kim, S., C. Sioutas, and M. Chang. 2010. Electrostatic enhancement of the collection efficiency of stainless steel fiber filters. Aerosol Sci. Technol. 32 (3):197–213. doi:10.1080/027868200303731.
- Kwon, S. B., H. Sakurai, T. Seto, and Y. J. Kim. 2006. Charge neutralization of submicron aerosols using surface-discharge microplasma. J. Aerosol Sci. 37 (4):483–99. doi:10.1016/j.jaerosci.2005.05.007.
- Lee, E. S., and Y. Zhu. 2014. Application of a high-efficiency cabin air filter for simultaneous mitigation of ultrafine particle and carbon dioxide exposures inside passenger vehicles. Environ. Sci. Technol. 48 (4):2328–35. doi:10.1021/es404952q.
- Li, J., and P. Biswas. 2017. Optical characterization studies of a low-cost particle sensor. Aerosol Air Qual. Res. 17 (7):1691–704. doi:10.4209/aaqr.2017.02.0085.
- Li, J., H. Li, Y. Ma, Y. Wang, A. A. Abokifa, C. Lu, and P. Biswas. 2018. Spatiotemporal distribution of indoor particulate matter concentration with a low-cost sensor network. Build. Environ. 127:138–47. doi:10.1016/j.buildenv.2017.11.001.
- Liu, C., P. C. Hsu, H. W. Lee, M. Ye, G. Zheng, N. Liu, W. Li, and Y. Cui. 2015. Transparent air filter for high-efficiency PM2.5 capture. Nat. Commun. 6:6205. doi:10.1038/ncomms7205.
- Liu, D., Q. Zhang, J. Jiang, and D. R. Chen. 2017. Performance calibration of low-cost and portable particular matter (PM) sensors. J. Aerosol Sci. 112:1–10. doi:10.1016/j.jaerosci.2017.05.011.
- Matulevicius, J., L. Kliucininkas, D. Martuzevicius, E. Krugly, M. Tichonovas, and J. Baltrusaitis. 2014. Design and characterization of electrospun polyamide nanofiber media for air filtration applications. J. Nanomater. 2014:1–13. doi:10.1155/2014/859656.
- Matulevicius, J., L. Kliucininkas, T. Prasauskas, D. Buivydiene, and D. Martuzevicius. 2016. The comparative study of aerosol filtration by electrospun polyamide, polyvinyl acetate, polyacrylonitrile and cellulose acetate nanofiber media. J. Aerosol Sci. 92:27–37. doi:10.1016/j.jaerosci.2015.10.006.
- Möritz, M., H. Peters, B. Nipko, and H. Rüden. 2001. Capability of air filters to retain airborne bacteria and molds in heating, ventilating and air-conditioning (HVAC) systems. Int. J. Hyg. Environ. Health 203 (5-6):401–9. doi:10.1078/1438-4639-00054.
- Munir, M. M., F. Iskandar, K. Khairurrijal, and K. Okuyama. 2009. High performance electrospinning system for fabricating highly uniform polymer nanofibers. Rev. Sci. Instrum. 80 (2):026106. doi:10.1063/1.3079688.
- Newcomer, D. A., P. LaPuma, R. Brandys, and A. Northcross. 2018. Capture efficiency of portable high-efficiency air filtration devices used during building construction activities. J. Occup. Environ. Hyg. 15 (4):285–92. doi:10.1080/15459624.2017.1422869.
- Olivares, G., and S. Edwards. 2015. The Outdoor Dust Information Node (ODIN) – Development and performance assessment of a low cost ambient dust sensor. Atmos. Meas. Tech. Discuss. 8 (7):7511–33. doi:10.5194/amtd-8-7511-2015.
- Patel, S., J. Li, A. Pandey, S. Pervez, R. K. Chakrabarty, and P. Biswas. 2017. Spatio-temporal measurement of indoor particulate matter concentrations using a wireless network of low-cost sensors in households using solid fuels. Environ. Res. 152:59–65. doi:10.1016/j.envres.2016.10.001.
- Podgórski, A., A. Bałazy, and L. Gradoń. 2006. Application of nanofibers to improve the filtration efficiency of the most penetrating aerosol particles in fibrous filters. Chem. Eng. Sci. 61 (20):6804–15. doi:10.1016/j.ces.2006.07.022.
- Rajak, A., D. A. Hapidin, F. Iskandar, M. M. Munir, and K. Khairurrijal. 2019. Controlled morphology of electrospun nanofibers from waste expanded polystyrene for aerosol filtration. Nanotechnology 30 (42):425602. doi:10.1088/1361-6528/ab2e3b.
- Sharp. 2006. Compact Optical Dust Sensor. Accessed May 14, 2019. https://www.sparkfun.com/datasheets/Sensors/gp2y1010au_e.pdf.
- Shi, B., L. E. Ekberg, and S. Langer. 2013. Intermediate air filters for general ventilation applications: An experimental evaluation of various filtration efficiency expressions. Aerosol Sci. Technol. 47 (5):488–98. doi:10.1080/02786826.2013.766667.
- Shi, Y., T. Matsunaga, Y. Yamaguchi, Z. Li, X. Gu, and X. Chen. 2018. Long-term trends and spatial patterns of satellite-retrieved PM2.5 concentrations in South and Southeast Asia from 1999 to 2014. Sci. Total Environ. 615:177–86. doi:10.1016/j.scitotenv.2017.09.241.
- Singer, B. C., and W. W. Delp. 2018. Response of consumer and research grade indoor air quality monitors to residential sources of fine particles. Indoor Air 28 (4):624–39. doi:10.1111/ina.12463.
- Song, D. K., H. M. Lee, H. Chang, S. S. Kim, M. Shimada, and K. Okuyama. 2006. Performance evaluation of long differential mobility analyzer (LDMA) in measurements of nanoparticles. J. Aerosol Sci. 37 (5):598–615. doi:10.1016/j.jaerosci.2005.06.003.
- Sousan, S., A. Gray, C. Zuidema, L. Stebounova, G. Thomas, K. Koehler, and T. Peters. 2018. Sensor selection to improve estimates of particulate matter concentration from a low-cost network. Sensors (Switzerland) 18 (9):3008. doi:10.3390/s18093008.
- Stabile, L., C. V. Trassierra, G. Dell’Agli, and G. Buonanno. 2013. Ultrafine particle generation through atomization technique: The influence of the solution. Aerosol Air Qual. Res. 13 (6):1667–77. doi:10.4209/aaqr.2013.03.0085.
- Wang, S. C., and R. C. Flagan. 1989. Scanning electrical mobility spectrometer. J. Aerosol Sci. 20 (8):1485–8. doi:10.1016/0021-8502(89)90868-9.
- Wang, Y., J. Li, H. Jing, Q. Zhang, J. Jiang, and P. Biswas. 2015. Laboratory evaluation and calibration of three low-cost particle sensors for particulate matter measurement. Aerosol Sci. Technol. 49 (11):1063–77. doi:10.1080/02786826.2015.1100710.
- Wilkes, A. R. 2002. Measuring the filtration performance of breathing system filters using sodium chloride particles. Anaesthesia 57 (2):162–8. doi:10.1046/j.1365-2044.2002.02328.x.
- Yun, K. M., C. J. Hogan, Y. Matsubayashi, M. Kawabe, F. Iskandar, and K. Okuyama. 2007. Nanoparticle filtration by electrospun polymer fibers. Chem. Eng. Sci. 62 (17):4751–9. doi:10.1016/j.ces.2007.06.007.
- Zhang, Q., J. Welch, H. Park, C. Y. Wu, W. Sigmund, and J. C. M. Marijnissen. 2010. Improvement in nanofiber filtration by multiple thin layers of nanofiber mats. J. Aerosol Sci. 41 (2):230–6. doi:10.1016/j.jaerosci.2009.10.001.
- Zhang, R., C. Liu, P. C. Hsu, C. Zhang, N. Liu, J. Zhang, H. R. Lee, Y. Lu, Y. Qiu, S. Chu, et al. 2016. Nanofiber air filters with high-temperature stability for efficient PM2.5 removal from the pollution sources. Nano Lett. 16 (6):3642–9. doi:10.1021/acs.nanolett.6b00771.
- Zhang, S., H. Liu, F. Zuo, X. Yin, J. Yu, and B. Ding. 2017. A controlled design of ripple-like polyamide-6 nanofiber/nets membrane for high-efficiency air filter. Small 13 (10):1603151. doi:10.1002/smll.201603151.
- Zhu, M., J. Han, F. Wang, W. Shao, R. Xiong, Q. Zhang, H. Pan, Y. Yang, S. K. Samal, F. Zhang, et al. 2017. Electrospun nanofibers membranes for effective air filtration. Macromol. Mater. Eng. 302 (1):1600353. doi:10.1002/mame.201600353.
- Zulfi, A., M. M. Munir, D. A. Hapidin, A. Rajak, D. Edikresnha, F. Iskandar, and K. Khairurrijal. 2018. Air filtration media from electrospun waste high-impact polystyrene fiber membrane. Mater. Res. Exp. 5 (3):035049. doi:10.1088/2053-1591/aab6ef.