
 ?Mathematical formulae have been encoded as MathML and are displayed in this HTML version using MathJax in order to improve their display. Uncheck the box to turn MathJax off. This feature requires Javascript. Click on a formula to zoom.
Abstract
Molecular singly charged clusters generated by electrospray sources are commonly used for calibration measurements of ultrafine Condensation Particle Counters (CPCs) in the sub-2 nm size range. This technique has been limited to the smallest singly charged clusters. In this study, we used a bipolar electrospray source combining two electrosprays of opposite polarities to generate singly charged clusters of ammonium salts dissolved in acetonitrile, i.e., tetra-heptyl ammonium bromide (THABr) and tetra-butyl ammonium iodide (TBAI) clusters. A high-resolution UDMA acts as a classifier for positively and negatively charged clusters which are used as mobility standards for the measurement of the complete ascent of the detection efficiency curve of three ultrafine CPCs. The CPCs characterized in this work are two laminar flow-type CPCs using n-butanol (TSI UCPC Model 3776, TSI Inc., Minneapolis, MN USA) and diethylene glycol (DEG) (TSI UCPC Model 3777, TSI Inc.) as working fluid and the turbulent mixing-type DEG-based Particle Size Magnifier (Airmodus A10 PSM). The clusters generated by the bipolar electrospray source are analyzed for their elemental composition using the Atmospheric Pressure interface Time-Of-Flight mass spectrometer (ioniAPi-TOF, Ionicon Analytik GmbH, Austria) in positive and negative ion mode. We present mobility-dependent mass spectra from experiments using the UDMA and the ioniAPi-TOF in series for the analysis of positively charged clusters when operating the electrospray source in unipolar and in bipolar mode to demonstrate the charge reduction and purity of the sample.
EDITOR:
Introduction
The study of new particle formation has encouraged the development of instrumentation capable of analyzing nanoparticles at the transition from molecular clusters to newly formed particles. In recent years, the Atmospheric Pressure interface Time-of-Flight mass spectrometer (APi-TOF) has become a common technique for the analysis of single ions to molecular clusters in laboratory and field experiments (Junninen et al. Citation2010). The APi-TOF instrument enabled the measurement of charged clusters at mobility equivalent diameters between 1 and 2 nm during new particle formation (Almeida et al. Citation2013). Bridging the gap between the measurement of large molecular clusters and the lower detection limit of particle counters has become a major challenge in aerosol science. The number concentration of particles is commonly inferred from particle counting by optical detection subsequent to condensational growth. The cutoff diameter, i.e., the size where 50% of particles are detected, is a parameter characterizing a Condensation Particle Counter’s (CPC’s) performance. For ultrafine CPCs, the cutoff diameter lies in the size range between 1 and 4 nm depending on the working fluid, working principle and instrument design. Detailed instrument characterization studies are therefore essential to follow the growth of newly formed particles. Aerosol standards with nanometer dimensions for instrument calibration are produced by means of electrospray generation. Previous studies (Kangasluoma et al. Citation2013; Ude and Fernández de la Mora Citation2005) have demonstrated that solutions of tetra-alkyl ammonium halides are well-suited for the clean generation of mobility standards at inverse mobilities below 2 Vs/cm2 for instrument calibration (Cai et al. Citation2018; Jiang et al. Citation2011). It should be noted though that the mobility spectra for cluster ions electrosprayed from tetra-alkyl ammonium halides are dominated by larger multiply charged clusters leading to a too pronounced background to distinguish mobility peaks of singly charged clusters (Attoui et al. Citation2013). The analysis of mass spectra showed distinct presence of peaks assigned to multiply charged clusters from tetra-heptyl ammonium bromide (Fernández de la Mora, Thomson, and Gamero-Castaño Citation2005). The technique of generating mobility standards from electrospray has so far been limited to the smallest clusters consisting of monomers and dimers due to the dominant presence of higher charge states. Therefore, counting efficiencies obtained from mobility standards were typically limited to 1–3 data points omitting major parts of a counting efficiency curve. The high background composed of cluster ions at higher charge states can be reduced by means of controlled neutralization by exposing the cluster ions to ions of opposite polarity produced by, e.g., an aerosol neutralizer (Steiner et al. Citation2017) or their direct counter-ions (Fernández de la Mora and Barrios-Collado Citation2017). The latter technique has the advantage that exact knowledge of the chemical composition of the counterpart ions is given. In this study, we exploit the technique of combining two electrospray sources described in the study of Fernández de la Mora and Barrios-Collado (Citation2017) for the generation of dominantly singly charged clusters for the calibration of three different commercially available ultrafine CPCs. Prior to counting efficiency measurements, the generated clusters are analyzed to ensure exact knowledge of the sample composition.
Ultrafine CPCs have a detection limit in the 1–3 nm mobility diameter size range depending on the supersaturation of the condensing vapor that the aerosol sample is exposed to. Various approaches have been made to activate the smallest particles. A laminar flow butanol-based CPC (Stolzenburg and McMurry Citation1991) has become a standard instrument for particle counting and paved the way for the commercially available and widely used TSI UCPC Model 3776 which was characterized in this study at modified temperature settings. The use of different working fluids in laminar flow CPCs (Wimmer et al. Citation2013; Iida, Stolzenburg, and McMurry Citation2009) has further decreased the lowest detectable particle size. The second particle counter characterized in this study is a laminar flow DEG-based particle counter that is commercially available as the TSI UCPC Model 3777. Subsequent to particle activation, particles are detected in a “booster”-stage butanol-based CPC (TSI CPC Model 3772). Further research on instrument design and working principle to achieve high supersaturation for the promotion of condensational growth have led to the development of mixing-type CPCs (Sgro and Fernández de la Mora Citation2004) such as the commercially available Airmodus A10 PSM (Vanhanen et al. Citation2011) which exposes the aerosol sample to a DEG vapor in a turbulent mixing chamber to achieve supersaturation and activate condensational growth. The Airmodus PSM is the third instrument that was implemented in the experimental setup of this study in combination with the Airmodus A20 butanol-based CPC. The above-mentioned CPC types are widely used for number concentration as well as size distribution measurements when coupled to a Differential Mobility Analyzer (DMA) that classifies particles according to their electrical mobility in both laboratory and ambient environments. Evidently, number concentration and size distribution measurements in the size range of the cutoff diameter require detailed instrument characterization. Uncertainties on the number size distribution in the size range of freshly nucleated particles are especially sensitive to the detailed knowledge of the detection efficiency curve (Kangasluoma and Kontkanen Citation2017). Therefore, it is of large experimental interest to have a variety of aerosol standards in the critical mobility size range available.
In this work, we first present mass spectra obtained by the ioniAPi-TOF (Ionicon Analytik GmbH, Austria) in positive ion mode and directly compare mass and mobility spectra when the electrospray source is operated in unipolar and in bipolar mode. Further, we demonstrate results from an experimental setup comprising three commercially available ultrafine CPCs, which are characterized in parallel using the molecular clusters generated by the electrospray source in both polarities, and positively and negatively charged silver particles produced from a tube furnace.
Experimental methods
Cluster generation from the bipolar electrospray source
The bipolar electrospray source was described recently (Fernández de la Mora Citation2018; Fernández de la Mora and Barrios-Collado Citation2017) and is commercially available from SEADM, S.L., Spain. A stainless-steel chamber combines two electrospray capillaries that are inserted into two vial holders containing the analyte solution which are set at opposite high voltages. The analyte solution is pushed to the capillary tips (silica capillaries, 125 µm inner diameter) which are electrostatically separated by a 50% transparent stainless-steel mesh. Different mesh sizes are available to separate the capillary tips. In this study, we used a mesh that isolates the two electrospray regions to the center point of the bipolar electrospray chamber (half mesh). The bipolar electrospray source chamber is filled with a dry and clean carrier gas which transports charge reduced ions to the next stage. The relative humidity (RH) of the transport gas was monitored and was found <2% using SHT75 sensors with an accuracy of 1.8% RH. The approach for charge reduction of combining ions of a certain composition with their counter-ions gives control of the composition of the anion and cation. By reducing the charge state, dominantly singly charged clusters are generated. For the generation of charged clusters, tetra-butyl ammonium iodide (TBAI) and tetra-heptyl ammonium bromide (THABr), are dissolved in acetonitrile at a concentration of 1 mMol/L. Positively and negatively charged clusters of the form
were produced, where n is the number of neutral pairs in the cluster and z the number of cations. The ideal position of the two capillaries, i.e., where the single electrospray currents measured by two nano-amperemeters are independent from each other, was empirically determined. The electrospray currents between 100 and 200 nA were found to be most stable over time periods for a measurement run of 1–2 h when the pressure applied to the vials containing the analyte solution was kept between 1 and 10 mbar. Cleanliness of the sample solution and the capillaries proved to be of essential importance, therefore the capillaries were rinsed through multiple times using ethanol and methanol before and after each measurement run.
For the calibration of the CPCs, it is critical that only singly charged clusters are present in the sample. Therefore, a cluster composition analysis is conducted using the ioniAPi-TOF in positive and negative ion mode. Second, a reference measurement of the counting efficiency is performed using silver particles generated by a tube furnace and subsequent particle charging in an 241Am charger. With this setup, a charge state of of the classified silver particles at sizes below 5 nm can be assumed (Fuchs Citation1963) and the resulting counting efficiency used as a reference.
To ensure that the electrospray is run at optimum conditions, both electrospray currents need to be carefully adjusted so that symmetric sprays of positive and negative polarity can be established. The approach in this study is to classify one resolvable peak at a mobility equivalent diameter that is in the size range where the counting efficiency reaches its maximum value (plateau) and compare the number concentration measured by the CPC and a Faraday Cup Electrometer (FCE) at varying ratio of the electrospray currents. The FCE used here was developed at the University of Vienna and is based on the design presented by Winklmayr et al. (Citation1991) with an improved response time of 0.1 s. When the counting efficiency approaches the expected value, it can be inferred that singly charged clusters clearly dominate the sample. An example demonstration is displayed in Figure S1 with additional details in the online supplementary material (SI).
Mobility and mass analysis
The intention of this study is to verify that solely singly charged cluster ions are classified in the Vienna-type high-resolution UDMA (Steiner et al. Citation2010). Large multiply charged ions having the same electrical mobility would pass through the DMA and lead to multiple counts in the FCE, which we used as the reference instrument during the counting efficiency measurements. The clusters generated by the electrospray source in unipolar and bipolar mode were analyzed by coupling the DMA to the ioniAPi-TOF, which is described elsewhere (Leiminger et al. Citation2019), in positive/negative ion mode (see ). The tandem DMA-MS technique has been used in previous studies, e.g., on electrosprayed ionic liquid nanodrops (Hogan and Fernández de la Mora Citation2009), tetra-hexyl ammonium bromide clusters (Rus et al. Citation2010) and THABr clusters (Fernández de la Mora, Thomson, and Gamero-Castaño Citation2005). Limitations of this setup are given by resolution power of the DMA, transmission of the DMA and mass-dependent transmission of the mass spectrometer (Leiminger et al. Citation2019; Heinritzi et al. Citation2016).
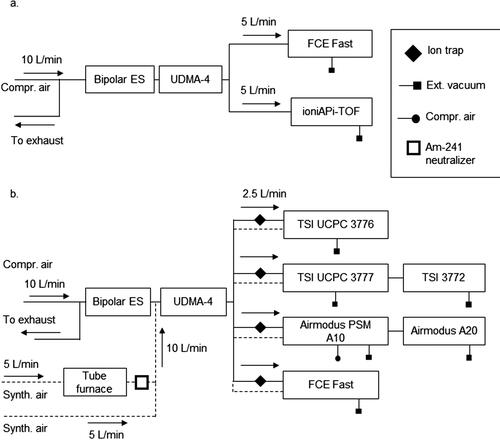
Figure 1. Two setups were used to, first (a), analyze the clusters generated by the bipolar electrospray source by a tandem UDMA-MS setup where positively/negatively charged clusters are classified in the UDMA-4 and subsequently analyzed for their mass-to-charge ratio in the ioniAPi-TOF in positive/negative ion mode. Second, panel (b), counting efficiency measurements were conducted using three different ultrafine CPC (TSI UCPC Model 3776, TSI UCPC Model 3777 and Airmodus PSM A10) in parallel and a fast-response FCE as a reference instrument using ion traps at the counter inlets (continuous lines). For the silver measurements, the bipolar electrospray is replaced by a tube furnace and silver particles are generated and subsequently charged using an aerosol neutralizer (dashed lines).
The Vienna-type high resolution DMA used in this study is referred to as UDMA-4 which was designed to measure mobilities of clusters and ions down to 1 nm. The precursor prototype to the UDMA-4 is the UDMA-1, which was found to have a comparatively large resolution power of 15 to separate charged molecular clusters (Steiner et al. Citation2010). The design of the cylindrical Vienna-type UDMA-4 was improved for an increased laminarization of the sheath flow and allows to use sheath flow rates between 400 and 1000 L/min. As discussed in Flagan (Citation1999), the resolution power of a DMA is inferred from the ratio of the mobility at the peak of the transfer function to the full width half maximum of the transfer function. At the sheath flow (Qsh) and aerosol flow (Qa) settings used during the experiments of this study (Qsh = 1000 L/min, Qa = 10 L/min), the resolution power of the UDMA-4 was found to be 20 at the size of the THABr monomer at the used experimental conditions.
The large sheath flow rates are not measurable using conventional flow meters, therefore the sheath flow rate is calibrated using a mobility standard. The linear relationship between inverse electrical mobility, Z, and set voltage, V, allows to infer the actual flow rate from an operational characterization factor, K:
(1)
(1)
A fast-response FCE collects charged particles on a filter and measures the electrical current to obtain the mobility spectrum. The centroid electrical mobilities of the resolvable peaks in the mobility spectrum were derived by applying normal (Gaussian) fits to the single mobility peaks. The approximate mobility equivalent diameter, was calculated from an empirical formula valid in the particle size range of 0.5–5 nm (Mäkelä et al. Citation1996) as
(2)
(2)
The electrical mobility, Z, is given in units of m2/Vs and the mobility equivalent diameter in m assuming singly charged particles. Note that in the size range of molecular clusters, the mobility equivalent diameter can only be regarded as a convenient size indicator.
In addition to the mobility analysis, the generated clusters were analyzed for their elemental composition using the ioniAPi-TOF with hexapole ion guides. The ion transfer properties of the instrument for the mass range of the analyzed clusters are therefore an important parameter. Compared with APi-TOF instruments with quadrupole ion guides, e.g., APi-TOF MS, Aerodyne Research Inc. and Tofwerk AG, instruments with higher multipole ion guides are assumed to have a broader mass window (Gerlich Citation2004). The ioniAPi-TOF was recently characterized regarding ion transmission efficiency, mass range transmission and the effect of ion transfer properties by Leiminger et al. (Citation2019).
We investigated positively charged clusters using the ioniAPi-TOF in positive ion mode when the electrospray was operated in unipolar and bipolar mode. Three-dimensional mass-mobility spectra (Rus et al. Citation2010; Hogan and Fernández de la Mora Citation2009) were obtained using the tandem UDMA-MS setup that is schematically shown in . The UDMA-4 voltage was stepped at an increment of 10 V and integration of the mass spectra for 15 s in the mass range up to 2000 Th yielded the mass-mobility spectra.
Additional non size-resolved measurements were performed in positive ion mode by coupling the electrospray source directly at the ioniAPi-TOF inlet for chemical analysis at increased ion transmission and are presented in Figure S2.
Negatively charged clusters were analyzed using the ioniAPi-TOF in negative ion mode by classifying distinct peaks at a fixed voltage in the UDMA-4 and recording the corresponding mass spectra. The time-of-flight of the ioniAPi-TOF was adjusted to a mass range up to 3400 Th in positive ion mode and up to 5000 Th in negative ion mode.
Counting efficiency measurements
Counting efficiency measurements of the three ultrafine CPCs in parallel were performed using the setup presented in . Dry and particle-free air is drawn into the high-resolution UDMA-4 at an aerosol flow rate of 10 L/min which is controlled by the individual inlet flow rates of the particle counters which are each set to 2.5 L/min. The relatively high aerosol flow rate of 10 L/min was chosen to be able to characterize the three CPCs in parallel at adequate number concentrations detected in the FCE (>1000 The UDMA-4 is operated at ∼1000 L/min sheath flow rate. Subsequently, the flow carrying the particles is evenly split using a four-way splitter and is drawn into the three ultrafine CPCs and the FCE. At each measurement point, the classifier voltage is fixed, and the ion traps set to ground voltage for a duration of 120 s. For the background measurement, the classifier voltage is kept constant with the ion traps set to ±500 V to remove all charged particles. Since particle counting in the FCE is size-independent, it is used as a reference instrument to infer the counting efficiency of every CPC. By comparing the number concentration of each CPC, NCPC, to the measured number concentration in the FCE, NFCE, the counting efficiency, η, is determined as
(3)
(3)
When switching the electrospray from unipolar to bipolar mode, an increased neutral background is measured behind the classifier which we assume to originate from the recombination of bipolar ions leading to a high number concentration of neutral particles. A fraction of the neutral particles is still counted by the CPCs when the DMA is in classifier mode. The CPCs count both neutral and charged particles whereas the FCE accounts only for charged particles. Therefore, the CPC number concentration is background corrected by removing all charged particles using the ion traps at the counter’s inlets. Simultaneously, the FCE’s baseline is determined by removing all charged particles using the ion trap at the FCE inlet. Thus, only the fraction of charged particles measured behind the classifier is accounted for. Depending on the settings of the bipolar electrospray, an increased background is also observed in the FCE, i.e., charged particles, when the classifier is set to zero. This background most likely originates from extraordinarily high ion concentrations that are not completely filtered out by the DMA when operating the electrospray in bipolar mode.
For the counting efficiency measurements, the CPCs and the PSM were operated at temperature and flow settings which allow to have the increase of the detection efficiency curve within the size range of the inverse mobility between 1 and 4 Vs/cm2. The PSM saturator temperature was set to 80 °C and the growth tube temperature to 1 °C at 1.0 L/min saturator flow rate. In principle, the PSM can be operated at settings that further increase the detection efficiency (Kangasluoma et al. Citation2013). The TSI UCPC Model 3776 was operated at reduced nucleation temperature to increase the supersaturation inside the CPC which mainly determines the CPC detection efficiency (Barmpounis et al. Citation2018). The temperature of the saturator, was set to 33.1 °C and the condenser temperature,
was decreased from standard factory settings to 1.1 °C which results in
These temperature settings of the TSI UCPC Model 3776 have been presented by a previous study (Tauber, Brilke, et al. Citation2019). The inlet flow rate was augmented to 2.5 L/min to reduce diffusional particle losses at the instrument inlet. Likewise, the TSI UCPC Model 3777 was operated at modified temperature settings with the saturator temperature set to 66 °C and the condenser temperature decreased to 10 °C.
Additional counting efficiency measurements were conducted using silver particles (Ag) generated by a tube furnace (Scheibel and Porstendörfer Citation1983) and charged in a bipolar radioactive charger (see , dashed lines). In the investigated particle size range between 1 and 5 nm, it can be assumed that only singly charged particles enter the DMA. For each measurement, the mean concentration at fixed classifier voltage measured in the CPCs was compared to the mean concentration measured in the FCE for 120 s. The background measurement was performed by setting the classifier voltage to zero to account for possible homogeneous nucleation inside the CPCs and the FCE noise level. Silver particles are considered as a widely-used standard of a spherical and insoluble test aerosol for laboratory characterization of ultrafine CPCs and therefore serve here as a reference case of a well-studied system (Hermann et al. Citation2007; Petäjä et al. Citation2006).
Results and discussion
Mobility and mass analysis
The mobility spectra were recorded by the FCE for THABr and TBAI clusters of both polarities and are shown in . The peaks are labeled with the number of neutral pairs in the cluster, n, where n = 0 corresponds to the monomer, n = 1 to the dimer and so forth. Contrary to mobility spectra from a unipolar electrospray source (Attoui et al. Citation2013; Steiner et al. Citation2010), the presented spectra exhibit a larger number of resolvable peaks which was also shown by Fernández de la Mora and Barrios-Collado (Citation2017). Note that in the positive spectrum for THABr the abundance of the ion peak (tetramer) is lower than its neighboring peaks but clearly resolved. Similar observations have been made by Ude and Fernández de la Mora (Citation2005). During the preparation of our experiments, we found the 50% transparent half mesh configuration of the bipolar electrospray chamber favorable compared to the full mesh for resolving the tetramer. The electric field and flow configuration in the bipolar electrospray chamber might promote the abundance of the tetramer. For the negative spectrum of TBAI at n = 7,8 the peaks are not fully resolved. However, we find a range of peaks that can potentially be used as mobility standards. The positive THABr spectra reveal resolvable peaks up to n = 10, whereas for TBAI clusters up to n = 18 can be detected. The inverse electrical mobilities, 1/Z [Vs/cm2], of the resulting peaks were determined by fitting a normal (Gaussian) function to the series of peaks up to the decamer. The clusters were classified in the UDMA-4 and the mass-to-charge ratio was measured in the ioniAPi-TOF in either positive or negative ion mode. The experiments were conducted in laboratory conditions at atmospheric pressure, T = 22 °C and RH < 3.5%. The mobility peaks, which were clearly resolved and identified in the ioniAPi-TOF, are listed in with their inverse electrical mobility, 1/Z [Vs/cm2], exact atomic mass, m/z [Th], and approximate diameter, dZ [nm], calculated from EquationEquation (2)
(2)
(2) .
Figure 2. Positive and negative mobility spectra of tetra-heptyl ammonium bromide (THABr) und tetra-butyl ammonium iodide (TBAI) cluster ions recorded by the FCE. Peak labels denote the number of neutral pairs in the cluster, n.
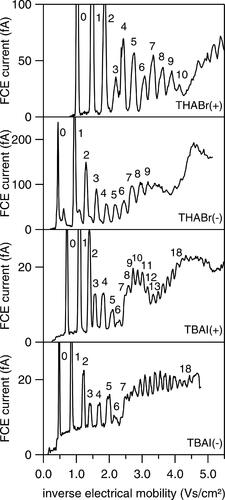
Table 1. Inverse mobilities, 1/Z [Vs/cm2], and approximated mobility diameter, [nm], using EquationEquation (2)
(2)
(2) for positively (
) and negatively (
singly charged (z = 1) tetra-butyl ammonium iodide and tetra-heptyl ammonium bromide clusters. The exact atomic mass is listed as m/z [Th].
For the assignment of mobility peaks to their mass, the UDMA-4 was coupled to the ioniAPi-TOF. The signal measured by the FCE was proved to be sufficiently high and the UDMA-4 resolving power was large enough to clearly distinguish single molecular ions. The ioniAPi-TOF mass calibration was conducted using the clusters generated by the bipolar electrospray source. For the analysis of the mass spectra, m/z values were converted to n/z, where n is the number of neutral pairs in the cluster by calculating (Rus et al. Citation2010)
(4)
(4)
The mass of the cation and cation-ion-pair is given by and
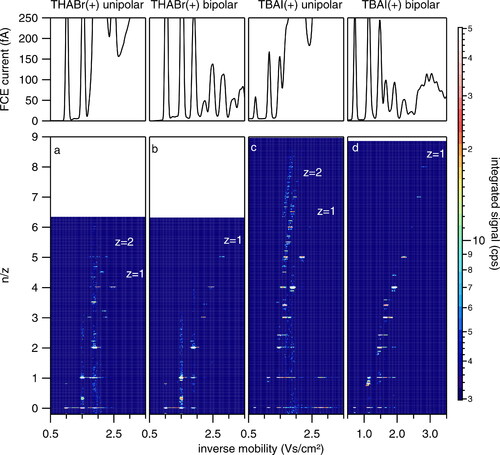
respectively. The representation by n/z gives a clear indication of multiply charged ions present in the spectra which then appear at fractions of the integer values of n/z. shows the ratio of number of neutral pairs in the cluster to their charge state vs. the inverse electrical mobility of the cluster in unipolar mode (a, c) and bipolar mode (b, d). Clearly, in unipolar mode, higher charge states clusters are present with doubly charged clusters at half integer n/z values (z = 2) and triply charged clusters at third integer values (z = 3). Whereas in bipolar mode, these multiply charged ions disappear which suggests the dominant presence of singly charged clusters. We observe large contributions of the smaller monomer and dimer clusters when classifying the dimer or trimer, respectively. We suggest that at the transition from ambient pressure to the low pressure in the ioniAPi-TOF smaller clusters (n < 3) do not remain intact which results in a source of additional ions at smaller mobilities detected in the ioniAPi-TOF. Similar observations of positively charged THABr clusters have been made by Ude and Fernández de la Mora (Citation2005).
Figure 3. The upper panel shows the positive mobility distribution measured in the FCE during each measurement run. Positive mass-mobility spectra from electrosprayed THABr and TBAI clusters are added in the lower panel when the electrospray is operated in unipolar (a, c) and bipolar (b, d) mode. When operated in unipolar mode, the positive electrospray is used only whereas in bipolar mode the positive and negative electrosprays are combined. The color scheme in the mass-mobility spectra shows the logarithmically scaled signal of intensity measured by the ioniAPi-TOF. Panels (a) and (c) show the spectra of clusters when the electrospray is operated in unipolar mode and higher charge states are detected (white labels) for THABr and TBAI clusters. In bipolar mode, higher charge states disappear, (b) and (d).
Positive mass-mobility spectra for TBAI reveal similar patterns regarding unipolar vs bipolar mode as demonstrated in . Distinct bands of ions at higher charge states become visible in unipolar mode which are not detected in bipolar mode. Additional peaks appear at higher m/z when the trimer, tetramer and pentamer are classified. Likewise, in the unipolar mobility-mass spectrum we observe signals from the monomer when classifying the dimer. Correspondingly, signals of smaller cluster ions (n/z = 0, 1, 2, 3) appear when classifying clusters up to n/z = 4. This indicates an instability of the smaller clusters when entering the vacuum system of the mass spectrometer.
The resolving power of the DMA is critical to ensure chemical purity of the classified cluster. The mobility spectra shown in exhibit non-ideal shapes of the mobility peaks which can be explained by non-idealities in the DMA geometry, i.e., DMA eccentricity. Non-idealities in the DMA eccentricity and thus limited resolving power can generally be addressed by using a different DMA geometry such as a parallel-plate DMA. However, the UDMA-4 resolving power showed to be large enough to resolve single peaks as presented in .
Ion transmission of the tandem DMA-MS setup is limited by the transmission of the UDMA-4 and the ioniAPi-TOF. A higher transmission probability of larger ions is expected in the UDMA-4 while ion transmission in the ioniAPi-TOF is lower at higher m/z due to a decreased duty cycle and lower transmission of heavier ions. The reduced transmission efficiency was accounted for by increasing the sampling duration. The DMA-MS system would benefit from an improved ion transmission in the DMA, which has cylindrical geometry in this case. In principal, a parallel-plate DMA with optimized geometry for cluster transmission is recommended for DMA-MS studies, as shown in Rus et al. (Citation2010). In this study, additional non size-resolved measurements were performed to verify the non-presence of higher charge states by installing the electrospray source directly at the ioniAPi-TOF inlet. The positive mass spectra are presented in Figure S2. THABr clusters of charge states z = +2 are marked in the upper panel and correspond to the m/z values as listed in the study of Fernández de la Mora, Thomson, and Gamero-Castaño (Citation2005). These and clusters of higher charge states are substantially reduced in bipolar mode (lower panel) indicating the dominant presence of singly charged clusters.
In principle, negative ions from an electrospray source can cluster with and ionize substances present in the carrier gas. Therefore, the possibility of ion-adducts forming due to impurities in the carrier gas needs to be considered. Negatively charged THABr clusters were analyzed by operating the UDMA-4 in fixed voltage mode and at a sample duration of 1–2 h depending on the signal intensity. shows the mass spectra of each classified negatively charged THABr cluster to the number of neutral pairs in the cluster calculated from EquationEquation (4)(4)
(4) . The spectra were normalized to the intensity at the dominant peak, i.e., the expected mass-to-charge ratio or n value, respectively, to facilitate the comparison. The series of dominant peaks is observed at the expected mass-to-charge values for clusters up to 8 neutral pairs per cluster, i.e., the nonamer. Commonly, the instrument resolution of the ioniAPi-TOF substantially decreases at the upper end of the mass range. In this case, at the mass of the monomer (m/z = 79 Th) an instrument resolution of 1370 is derived, which decreases for larger masses. The maximum flight-time in the ioniAPi-TOF was increased by reducing the extraction frequency to allow the detection of ions at higher m/z.
Figure 4. Negative mass spectra were measured by the ioniAPi-TOF of THABr for each classified mobility peak in the mobility distributions demonstrated in . The mass-to-charge ratio was calculated to the number of neutral pairs in the cluster using EquationEquation (4)(4)
(4) where
Th and
Th. The dataset of each classified cluster was normalized to the intensity at the expected cluster mass. The measured intensities of large clusters are low compared to small clusters based on a reduced transmission efficiency of the ioniAPi-TOF at larger masses which in turn have a higher transmission probability in the UDMA-4.
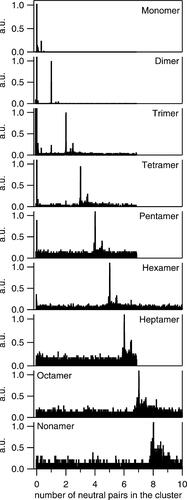
When classifying the monomer, dimer and trimer, we observe peaks of clusters of with acetonitrile and ethanol. Ethanol is used for rinsing the capillaries before and after each measurement run. Though RH in the system is monitored and kept to a minimum (<3.5% RH), we also detect
water clusters. In the case of the classified monomer, an additional prominent peak is observed at m/z = 232 Th which was not identified here. The relative abundance of this peak to the expected monomer peak at m/z = 79 Th is 0.2:1. This peak might originate from
forming adducts with possible impurities in the pressurized air used as carrier gas. At larger clusters, an additional signal at a similar distance to the cluster mass of the classified mobility peak is noted. For classified clusters up to n = 4 (pentamer), a monomer peak is detected with highest relative abundance for the classified trimer (5:1). As discussed earlier, we suggest that the smaller clusters originate from evaporation at the TOF transition which was also suggested by previous tandem DMA-MS studies (Ude and Fernández de la Mora Citation2005). At larger clusters (n > 3), an additional ion signal in the region of the classified cluster is recorded. Due to the low resolution in this high mass range, these peaks cannot be identified. Since the operational settings are at the experimental limit of the instrument, we cannot exclude that the signal originates from scattering of heavy ions, i.e., the large clusters, at the detector.
In summary, the mass-mobility study of the clusters generated by the bipolar electrospray revealed that, firstly, positive and negative mobility spectra of THABr and TBAI as large as 3–4 nm can be obtained using the high-resolution UDMA-4. Second, by stepping the UDMA-4 voltage and sampling positively charged clusters, mass-mobility spectra were generated and the reduction of multiply charged clusters when operating the electrospray in bipolar mode was verified and supported by results from a non-size-resolved measurement of the mass-to-charge ratio (Figure S2). Ultimately, mass spectra recorded by the ioniAPi-TOF in negative ion mode demonstrated that the series of the first mobility peaks corresponds to the expected cluster mass, i.e., mobility peaks were clearly assigned to their mass-to-charge ratio.
CPC counting efficiency
Silver particle measurements
First, we present results from counting efficiency measurements using silver particles to have a reference to a well-known aerosol test substance. The results of the counting efficiency curves from charged silver particles using the tube furnace as aerosol source are presented in . The counting efficiency is plotted versus the mobility equivalent diameter which is calculated from EquationEquation (2)(2)
(2) . At small sizes, an additional increase of the counting efficiency is observed for the Airmodus PSM and the TSI UCPC Model 3776. In the lower panel of , the mobility distributions of ions generated by the bipolar
aerosol neutralizer in the absence of particles were added. Clearly, charger ions are activated by the TSI UCPC Model 3776 and, much more pronounced, by the Airmodus PSM when positively charged particles are classified. This observation highlights the importance of accounting for ions produced by the aerosol neutralizer present in the aerosol sample (Hering et al. Citation2017). The cutoff diameters, at which 50% of the particles are detected, D50, are listed in . For negatively charged silver particles, we observe a decrease of the cutoff diameter for the TSI UCPC Model 3776 and the TSI UCPC Model 3777. Note that the cutoff diameter for positively charged silver particles of the Airmodus PSM is omitted due to the increased activation efficiency at small sizes caused by charger ions present in the sample. The reason for a decreased cutoff diameter in the case of negatively charged silver particles remains unclear and ion composition of silver was not measured by this study. Sign preferences regarding the activation probability have been observed by previous studies (Tauber, Brilke, et al. Citation2019; Winkler et al. Citation2008).
Figure 5. Counting efficiency results using positively (+) and negatively (−) charged silver (Ag) particles produced in a tube furnace. The lower panel shows the normalized mobility distribution of charger ions produced in the bipolar neutralizer in the absence of particles. A sigmoidal fit function was applied to the data points and are presented as continuous (Ag+) and dashed (Ag−) lines.
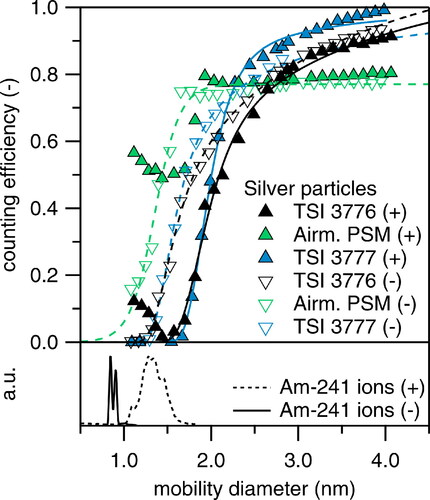
Table 2. Cutoff diameters, D50, in nm at 50% counting efficiency for the three characterized particle counters. The TSI UCPC Model 3776 and the TSI UCPC Model 3777 were operated at modified temperature settings.
Tetra-alkyl ammonium halide cluster measurements
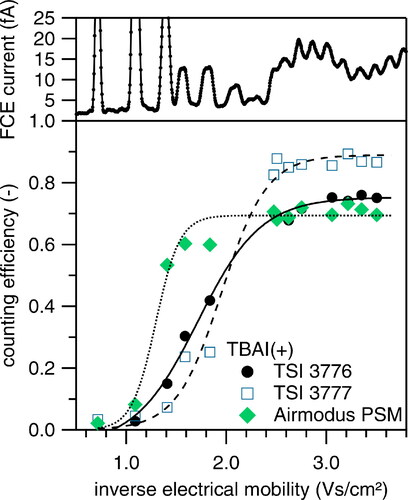
As a next step, we discuss results for mobility standards from positively charged TBAI clusters and compare the plateau height of the activation curves. demonstrates the counting efficiency vs. the inverse electrical mobility of the size-selected positively charged TBAI clusters with the corresponding mobility spectrum of the generated clusters shown in the upper panel. Evidently, the plateau of the activation curve approaches the maximum activation efficiency in the 3–4 nm range of about 90% for the TSI 3777 and about 70% in the PSM. As we have seen in the results of the silver particle measurement in , the cutoff curves of the TSI 3776 and the TSI 3777 reach a plateau at approximately 4 nm, which corresponds to the maximum activation efficiency in the investigated size range when only singly charged clusters are analyzed. Based on EquationEquation (3)(3)
(3) , the size-selected clusters are therefore equally counted in the CPCs and the FCE when using the mobility standards by the bipolar electrospray. Hence, multiply charged clusters are negligible in the sample which would lead to overcounting in the FCE and thus an underestimated counting efficiency.
Figure 6. Counting efficiency measurements from positively charged TBAI clusters were plotted against the inverse electrical mobility, 1/Z. The positive mobility spectrum recorded by the FCE is presented in the upper panel. Mobility peaks are classified in the UDMA-4 and are carried into the particle counters, the TSI UCPC Model 3776 and TSI UCPC Model 3777 which are operated at modified temperature setting and the Airmodus PSM. Uncertainties in the counting efficiency are dominated by the 10% and 5% counting accuracy of the CPCs and the FCE and are not depicted here.
summarizes the counting efficiency measurements for the two tetra-alkyl ammonium halides for both polarities and the resulting cutoff diameters are reviewed in . An overview of the resulting cutoff diameters for the different substances and CPCs is given in . The error bars in were estimated from the UDMA-4 resolution at the monomer peak during each measurement run. Results of the study by Kangasluoma et al. (Citation2016), which included the investigation of the activation behavior of three different CPC’s using THABr clusters generated from a tube furnace and subsequent charging in an 241Am charger, were added as black markers.
Figure 7. Results of the counting efficiency measurements using positively and negatively charged THABr and TBAI clusters generated by the bipolar electrospray source vs. the mobility equivalent particle diameter. A sigmoidal fit function was applied to the data points and are presented as continuous (TSI UCPC Model 3776), dashed (TSI UCPC Model 3777) and dotted (Airmodus PSM) lines.
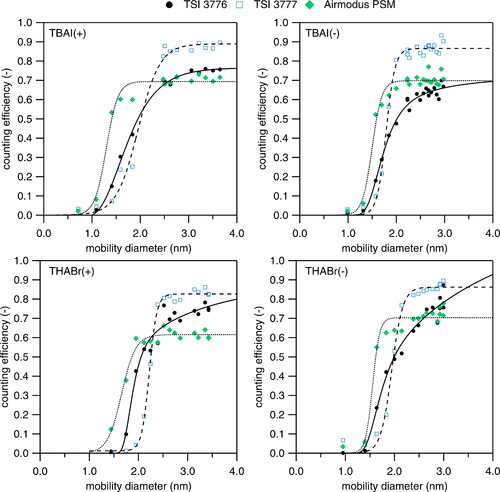
Figure 8. Summary of the resulting cutoff diameters (listed in ) for the TSI UCPC Model 3776, the TSI UCPC Model 3777 and the Airmodus PSM using silver particles, THABr and TBAI as test aerosols. Upward arrows represent positively charged particles and downward arrow negatively charged particles, respectively. Measurement uncertainties were derived from the UDMA-4 resolution using the positive THABr monomer as calibrant ion. Results of THABr measurements from the study of Kangasluoma et al. (Citation2016) were added as black markers(*), note that the counters were operated here at different settings.
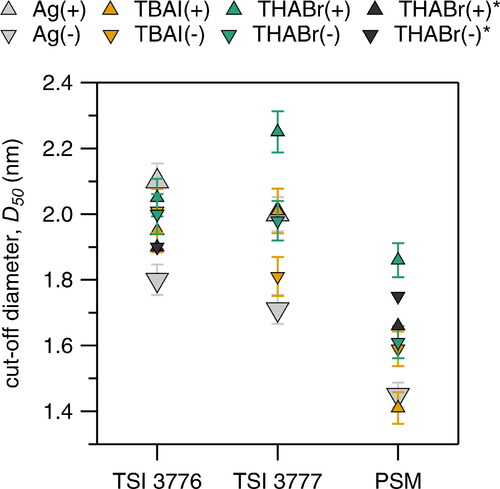
A trend toward an improved activation efficiency, i.e., lower cutoff diameter, can be observed for the DEG-based counters with lowest cutoff diameters for the turbulent mixing-type Airmodus PSM (see ). However, least scattering of the results when different substances and polarities are tested is found for the modified TSI UCPC Model 3776. Indeed, the cutoff diameters from the tetra-alkyl ammonium halides agree within the measurement uncertainty (see ). This finding suggests a reduced composition dependency of the cutoff diameter for the butanol based and modified TSI UCPC Model 3776. Based on the study of Barmpounis et al. (Citation2018), a maximum saturation ratio of about 4.6 is achieved in a butanol-based laminar flow type CPC for the temperature settings at at reduced condenser temperature. Tauber, Steiner, et al. (Citation2019) derived a maximum of the saturation ratio between 4.5 and 4.6 for the TSI UCPC Model 3776 which was used in this study. In a previous study by Tauber et al. (Citation2018) negatively charged THABr/TBAI monomer,
and
are found to activate at saturation ratios between 4.47 and 4.57 using an adiabatic expansion-type particle counter and n-butanol vapor. The activation of monoatomic ions with a mobility diameter close to 1 nm would be possible according to the estimated supersaturation profile inside the CPC condenser. Hence, the cutoff diameter at 2 nm can be attributed to the CPC geometry and flow settings, e.g., diffusional losses in the capillary at the saturator inlet at a flow rate of 0.05 L/min. The TSI UCPC Model 3777 operates at a capillary flow rate of 0.15 L/min and yields lowered cutoff diameters compared to the TSI UCPC Model 3776 which supports limitations due to inlet geometries and flow rate settings. However, the activation in the DEG-based TSI UCPC Model 3777 will differ from the activation achieved in the TSI UCPC Model 3776. Since the PSM activation is based on supersaturation from turbulent mixing of the supersaturated vapor and the aerosol sample, higher activation efficiencies can be accomplished (Kangasluoma et al. Citation2013; Vanhanen et al. Citation2011). The resulting cutoff diameters from the study of Kangasluoma et al. (Citation2016) are comparable to the results of this study. However, note that the CPC operational settings were different.
A tendency to improved detection, i.e., lower cutoff diameter, of TBAI toward THABr clusters is observed for the DEG-based counters, see . TBAI and DEG are both relatively polar in contrast to THABr and n-butanol. A better solubility of TBAI in DEG can therefore be expected and explain the lower cutoff diameter.
A polarity dependence cannot be inferred from the cutoff diameters for the tetra-alkyl ammonium halides (see ). With clusters being composed of either a surplus of a cation or anion, structural effects, i.e., the composition of the sample, on the cutoff diameter might dominate over the polarity of the cluster (Kangasluoma et al. Citation2013).
Conclusion
The bipolar electrospray source proved to be a powerful tool to generate bipolar mobility spectra dominated by singly charged clusters from THABr and TBAI when coupled with the UDMA-4 at decent concentrations for subsequent analysis and instrument calibration purposes. In combination with the ioniAPi-TOF in positive and negative ion mode, mobility peaks were clearly assigned to their masses for clusters up to the nonamer. Effective reduction of higher charge states of ions generated from the electrospray when switching from unipolar to bipolar mode was confirmed from the ioniAPi-TOF measurement.
We have demonstrated that the mobility standards generated by the bipolar electrospray source can be used to characterize ultrafine CPCs. Counting efficiency measurements were performed for two laminar flow CPCs using n-butanol and DEG as working fluid (TSI UCPC Model 3776 and 3777) at modified temperature settings and the turbulent mixing type Airmodus PSM in the 1–4 nm size range. The comparison of CPC and FCE concentration at larger classified clusters confirmed that the aerosol sample consists of essentially singly charged clusters when comparing the resulting cutoff curves to the results from the silver measurements. The generation of dominantly singly charged clusters can be concluded from the combined results of the counting efficiency measurements and the chemical analysis.
The cutoff analysis using high-resolution mobility classification showed a significantly reduced composition dependency when using the butanol-based TSI UCPC Model 3776 at modified temperature settings compared to the DEG-based TSI UCPC Model 3777 and Airmodus PSM. This finding is of general interest for the measurement of sub-3 nm particle concentration and size distribution measurement of newly formed particles, especially when the composition of the sample is not known during ambient measurements. Given its precision in the size and composition of seed particles the setup presented here may well serve as a calibration standard in future CPC calibration studies.
Supplemental Material
Download MS Word (465.8 KB)Additional information
Funding
References
- Almeida, J., S. Schobesberger, A. Kürten, I. K. Ortega, O. Kupiainen-Määttä, A. P. Praplan, A. Adamov, A. Amorim, F. Bianchi, M. Breitenlechner, et al. 2013. Molecular understanding of sulphuric acid-amine particle nucleation in the atmosphere. Nature 502 (7471):359–63. doi:10.1038/nature12663.
- Attoui, M., M. Paragano, J. Cuevas, and J. Fernández de la Mora. 2013. Tandem DMA generation of strictly monomobile 1–3.5 nm particle standards particle standards. Aerosol Science and Technology 47 (5):499–511. doi:10.1080/02786826.2013.764966.
- Barmpounis, K., A. Ranjithkumar, A. Schmidt-Ott, M. Attoui, and G. Biskos. 2018. Enhancing the detection efficiency of condensation particle counters for sub-2 nm particles. Journal of Aerosol Science117:44–53. doi:10.1016/j.jaerosci.2017.12.005.
- Cai, R., M. Attoui, J. Jiang, F. Korhonen, J. Hao, T. Petäjä, and J. Kangasluoma. 2018. Characterization of a high-resolution supercritical differential mobility analyzer at reduced flow rates. Aerosol Science and Technology 52 (11):1332–43. doi:10.1080/02786826.2018.1520964.
- Fernández de la Mora, J. 2018. Mobility analysis of proteins by charge reduction in a bipolar electrospray source. Analytical Chemistry90 (20):12187–90.
- Fernández de la Mora, J., and C. Barrios-Collado. 2017. A bipolar electrospray source of singly charged salt clusters of precisely controlled composition. Aerosol Science and Technology 51 (6):778–86. doi:10.1080/02786826.2017.1302070.
- Fernández de la Mora, J., B. A. Thomson, and M. Gamero-Castaño. 2005. Tandem mobility mass spectrometry study of electrosprayed tetraheptyl ammonium bromide clusters. Journal of the American Society for Mass Spectrometry 16 (5):717–32. doi:10.1016/j.jasms.2005.01.019.
- Flagan, R.C. 1999. On differential mobility analyzer resolution. Aerosol Science and Technology 30 (6):556–70. doi:10.1080/027868299304417.
- Fuchs, N.A. 1963. On the stationary charge distribution on aerosol particles in a bipolar ionic atmosphere. Geofisica Pura e Applicata 56 (1):185–93. ISSN 0367-4355, doi:10.1007/BF01993343.
- Gerlich, D. 2004. Applications of RF fields and collision dynamics in atomic mass spectrometry. Journal of Analytical Atomic Spectrometry 19 (5):581–90. doi:10.1039/b404032p.
- Heinritzi, M., M. Simon, G. Steiner, A. C. Wagner, A. Kürten, A. Hansel, and J. Curtius. 2016. Characterization of the mass-dependent transmission efficiency of a CIMS. Atmospheric Measurement Techniques9 (4):1449–60. doi:10.5194/amt-9-1449-2016.
- Hering, S. V., G. S. Lewis, S. R. Spielman, A. Eiguren-Fernandez, N. M. Kreisberg, C. Kuang, and M. Attoui. 2017. Detection near 1 nm with a laminar- flow, water-based condensation particle counter. Aerosol Science and Technology 51 (3):354–62. doi:10.1080/02786826.2016.1262531.
- Hermann, M., B. Wehner, O. Bischof, H. S. Han, T. Krinke, W. Liu, A. Zerrath, and A. Wiedensohler. 2007. Particle counting efficiencies of new TSI condensation particle counters. Journal of Aerosol Science38 (6):674–82. doi:10.1016/j.jaerosci.2007.05.001.
- Hogan, C. J., and J. Fernández de la Mora. 2009. Tandem ion mobility-mass spectrometry (IMS-MS) study of ion evaporation from ionic liquid-acetonitrile nanodrops. Physical Chemistry Chemical Physics. 11 (36):8079–90. doi:10.1039/b904022f.
- Iida, K., M. R. Stolzenburg, and P. H. McMurry. 2009. Effect of working fluid on sub-2 nm particle detection with a laminar flow ultrafine condensation particle counter. Aerosol Science and Technology 43 (1):81–96. doi:10.1080/02786820802488194.
- Jiang, J., M. Chen, C. Kuang, M. Attoui, and P. H. McMurry. 2011. Electrical mobility spectrometer using a diethylene glycol condensation particle counter for measurement of aerosol size distributions down to 1 nm. Journal of Aerosol Science 45 (4):510–251. doi:10.1080/02786826.2010.547538.
- Junninen, H., M. Ehn, T. Petäjä, L. Luosujärvi, T. Kotiaho, R. Kostiainen, U. Rohner, M. Gonin, K. Fuhrer, M. Kulmala, et al. 2010. A high-resolution mass spectrometer to measure atmospheric ion composition. Atmospheric Measurement Techniques 3 (4):1039–53. doi:10.5194/amt-3-1039-2010.
- Kangasluoma, J., H. Junninen, K. Lehtipalo, J. Mikkilä, J. Vanhanen, M. Attoui, M. Sipilä, D. R. Worsnop, M. Kulmala, and T. Petäjä. 2013. Remarks on ion generation for CPC detection efficiency studies in sub-3-nm size range. Aerosol Science and Technology 47 (5):556–63. doi:10.1080/02786826.2013.773393.
- Kangasluoma, J., and J. Kontkanen. 2017. On the sources of uncertainty in the sub-3 nm particle concentration measurement. Journal of Aerosol Science112:34–51.
- Kangasluoma, J., A. Samodurov, M. Attoui, A. Franchin, H. Junninen, F. Korhonen, T. Kurtén, H. Vehkamäki, M. Sipilä, K. Lehtipalo, et al. 2016. Heterogeneous nucleation onto ions and neutralized ions: Insights into sign-preference. The Journal of Physical Chemistry C120 (13):7444–50. doi:10.1021/acs.jpcc.6b01779.
- Leiminger, M., S. Feil, P. Mutschlechner, A. Ylisirniö, D. Gunsch, L. Fischer, A. Jordan, S. Schobesberger, A. Hansel, and G. Steiner. 2019. Characterisation of the transfer of cluster ions through an atmospheric pressure interface time-of-flight mass spectrometer with hexapole ion guides. Atmospheric Measurement Techniques 12 (10):5231–46. doi:10.5194/amt-12-5231-2019.
- Mäkelä, J. M., M. Riihelä, A. Ukkonen, V. Jokinen, and J. Keskinen. 1996. Comparison of mobility equivalent diameter with Kelvin-Thomson diameter using ion mobility data. The Journal of Chemical Physics105 (4):1562–71. doi:10.1063/1.472017.
- Petäjä, T., G. Mordas, H. Manninen, P. P. Aalto, K. Hämeri, and M. Kulmala. 2006. Detection efficiency of a water-based TSI condensation particle counter 3785. Aerosol Science and Technology 40 (12):1090–7. doi:10.1080/02786820600979139.
- Rus, J., D. Moro, J. A. Sillero, J. Royuela, A. Casado, F. Estevez-Molinero, and J. Fernández de la Mora. 2010. IMS-MS studies based on coupling a differential mobility analyzer (DMA) to commercial API-MS systems. International Journal of Mass Spectrometry298 (1-3):30–40. doi:10.1016/j.ijms.2010.05.008.
- Scheibel, H. G., and J. Porstendörfer. 1983. Generation of monodisperse Ag- and NaCl-aerosols with particle diameters between 2 and 300 nm. Journal of Aerosol Science14 (2):113–26. doi:10.1016/0021-8502(83)90035-6.
- Sgro, L. A., and J. Fernández de la Mora. 2004. A Simple turbulent mixing CNC for charged particle detection down to 1.2 nm. Aerosol Science and Technology 38 (1):1–11. doi:10.1080/02786820300982.
- Steiner, G., M. Attoui, D. Wimmer, and G. P. Reischl. 2010. A medium flow, high-resolution Vienna DMA running in recirculating mode. Aerosol Science and Technology 44 (4):308–15. doi:10.1080/02786821003636763.
- Steiner, G., A. Franchin, J. Kangasluoma, V. M. Kerminen, M. Kulmala, and T. Petäjä. 2017. Production of neutral molecular clusters by controlled neutralization of mobility standards. Aerosol Science and Technology 51 (8):946–55. doi:10.1080/02786826.2017.1328103.
- Stolzenburg, M. R., and P. H. McMurry. 1991. An ultrafine aerosol condensation nucleus counter. Aerosol Science and Technology 14 (1):48–65. doi:10.1080/02786829108959470.
- Tauber, C., S. Brilke, P. J. Wlasits, P. S. Bauer, G. Köberl, G. Steiner, and P. M. Winkler. 2019. Humidity effects on the detection of soluble and insoluble nanoparticles in butanol operated condensation particle counters. Atmospheric Measurement Techniques 12 (7):3659–71. doi:10.5194/amt-12-3659-2019.
- Tauber, C., X. Chen, P. E. Wagner, P. M. Winkler, C. J. Hogan, and A. Maißer. 2018. Heterogeneous nucleation onto monoatomic ions: Support for the Kelvin-Thomson theory. ChemPhysChem 19 (22):3144–9. doi:10.1002/cphc.201800698.
- Tauber, C., G. Steiner, and P. M. Winkler. 2019. Counting efficiency determination from quantitative intercomparison between expansion and laminar flow type condensation particle counter. Aerosol Science and Technology 53 (3):344–54. doi:10.1080/02786826.2019.1568382.
- Ude, S., and J. Fernández de la Mora. 2005. Molecular monodisperse mobility and mass standards from electrosprays of tetra-alkyl ammonium halides. Journal of Aerosol Science36 (10):1224–37. doi:10.1016/j.jaerosci.2005.02.009.
- Vanhanen, J., J. Mikkilä, K. Lehtipalo, M. Sipilä, H. E. Manninen, E. Siivola, T. Petäjä, and M. Kulmala. 2011. Particle size magnifier for nano-CN detection. Aerosol Science and Technology 45 (4):533–42. doi:10.1080/02786826.2010.547889.
- Wimmer, D., K. Lehtipalo, A. Franchin, J. Kangasluoma, F. Kreissl, A. Kürten, A. Kupc, A. Metzger, J. Mikkilä, T. Petäjä, et al. 2013. Performance of diethylene glycol-based particle counters in the sub-3nm size range. Atmospheric Measurement Techniques 6 (7):1793–804. doi:10.5194/amt-6-1793-2013.
- Winkler, P. M., G. Steiner, A. Vrtala, H. Vehkamäki, M. Noppel, K. E. J. Lehtinen, G. P. Reischl, P. E. Wagner, and M. Kulmala. 2008. Heterogeneous nucleation experiments bridging the scale from molecular ion clusters to nanoparticles. Science 319 (5868):1374–7. doi:10.1126/science.1149034.
- Winklmayr, W., G. P. Reischl, A. O. Lindner, and A. Berner. 1991. A new electromobility spectrometer for the measurement of aerosol size distributions in the size range from 1 to 1000 nm. Journal of Aerosol Science 22 (3):289–96. doi:10.1016/S0021-8502(05)80007-2.