
 ?Mathematical formulae have been encoded as MathML and are displayed in this HTML version using MathJax in order to improve their display. Uncheck the box to turn MathJax off. This feature requires Javascript. Click on a formula to zoom.
Abstract
An instrumental trifecta now exists for aerosol separation and classification by aerodynamic diameter (Dae), mobility diameter (Dm) and mass (m) utilizing an aerodynamic aerosol classifier (AAC), differential mobility analyzer (DMA) and aerosol particle mass analyzer (APM), respectively. In principle, any combination of two measurements yields the third. These quantities also allow for the derivation of the particle effective density (ρeff) and dynamic shape factor (χ). Measured and/or derived deviations between tandem measurements are dependent upon the configuration but are generally <10%. Notably, nonphysical values of χ (<1) and ρeff (>bulk) were determined by the AAC-APM. Harmonization of the results requires the use of χ in the determination of m and Dm from the AAC-DMA and AAC-APM requiring either a priori assumptions or determination from another method. Further errors can arise from assuming instead of measuring physical conditions – e.g., temperature and pressure affect the gas viscosity, mean free path and the Cunningham slip correction factor therefore impacting Dm and Dae – but are expected to have a smaller impact than χ. Utilizing this triplet of instrumentation in combination allows for quantitative determination of χ and the particle density (ρp). If the bulk density is known or assumed, then the packing density can be determined. The χ and ρp were determined to be 1.10 ± 0.03 and (1.00 ± 0.02) g cm−3, respectively, for a water stabilized black carbon mimic that resembles aged (collapsed) soot in the atmosphere. Assuming ρbulk = 1.8 g cm−3, a packing density of 0.55 ± 0.02 is obtained.
Copyright © 2020 American Association for Aerosol Research
EDITOR:
1. Introduction
Physical and morphological properties (size, effective density and shape factor) and the number density of particles are required to predict aerosol behavior. Measuring these parameters accurately at the sub-micrometer level poses many challenges and several methods currently exist to quantify these properties. Most investigations use a differential mobility analyzer (DMA) – first demonstrated in 1975 (Knutson and Whitby Citation1975) to classify particles based upon their mobility diameter (Dm); i.e., the measured diameter that has the equivalent mobility of a spherical particle with a single net charge (q = ±1) in an electric field. The invention and development of the aerosol particle mass analyzer (APM) in 1996 (Ehara, Hagwood and Coakley Citation1996) and the centrifugal particle mass analyzer (CPMA) in 2005 (Olfert Citation2005) has allowed for the additional classification of particles by mass (m) by the balance of centrifugal and electrostatic forces. The combination of Dm and m measured by a DMA in tandem with an APM or CPMA allow for the calculation of effective density (ρeff), mass-mobility exponent (Dfm) and effective dynamic shape factor (χeff) for particles <1 μm (Ehara et al. Citation1996; McMurry et al. Citation2002; Olfert, Symonds, and Collings Citation2007)
An extensive review by (Park et al. Citation2008) provides examples of tandem DMA measurements. Briefly explained here, variations in experimental design have used a DMA coupled with different aerosol measurement techniques. For example, a DMA and an electrical low-pressure impactor (ELPI) coupled system – set up in series set by (Maricq, Podsiadlik, and Chase Citation2000) and in parallel by (Virtanen, Ristimäki, and Keskinen Citation2004) – determined Dm, Dae, and ρeff. A DMA coupled with an optical particle counter and an aerodynamic particle sizer determined aerosol refractive index and ρeff (Hand and Kreidenweis Citation2002).
One drawback to the DMA, APM and CPMA is that these classification methods require the use of charged particles which presents complications in the analysis (Wang and Flagan Citation1990; Radney and Zangmeister Citation2016). To circumvent these issues, the aerodynamic aerosol classifier (AAC) was developed in 2013 (Tavakoli and Olfert Citation2013) and instead uses the response of the particle to an applied centrifugal force and counteracting drag force to determine the aerodynamic diameter (Dae). The AAC was first demonstrated in a tandem AAC-DMA configuration by (Tavakoli and Olfert Citation2014) to measure the m, ρeff, Dfm and χeff of liquid dioctyl sebacate droplets and fresh soot. Utilizing this triad of instrumentation in combination allows for the determination of the dynamic shape factor (χ) and particle density (ρp).
The pairwise collection of an AAC, DMA and APM (i.e., AAC-DMA, AAC-APM and DMA-APM) allows for independent determinations of Dae, Dm and m and the derivation ρeff and χ, see . Since the AAC, DMA and APM use different methods for aerosol classification (i.e., relaxation time, electrical mobility and mass-to-charge ratio), tandem combinations may result in variations in measured properties. In this study, multiple combinations of tandem measurements (AAC-DMA, AAC-APM and DMA-APM) are utilized to determine m, ρeff and χeff for solid, nearly spherical particles composed of ammonium sulfate. The results from these three independent measurements are compared and discussed. Utilizing the triplet of instrumentation, we demonstrate the quantitative determination of χ and ρp for an aged black carbon mimic.
Figure 1. Schematic representation of the instruments and the corresponding measured values – mobility diameter (Dm), aerodynamic diameter (Dae) and particle mass (m) – the tandem measurement pairs (connected by lines) and the corresponding derived values. Pairwise combination allows for determination of effective density (ρeff) and effective dynamic shape factor (χeff). The combination of all three measurements allows for the quantitative determination of the dynamic shape factor (χ) and particle density (ρp). The circle (black), square (red) and triangle (green) are used throughout the manuscript to denote the corresponding measurement results.
2. Materials and methods
Block diagrams of the experimental setups to perform pairwise comparisons are shown in . The sizing instruments were compared using ammonium sulfate (AS, 1 mg mL−1) and a H2O-dispersible black carbon aerosol mimic (CB, 0.2 mg mL−1) that resembles aged, collapsed soot; see Zangmeister et al. (Citation2019) for a full description. Aerosols were generated from solution and suspension, respectively, using a constant output atomizer (TSI 3076)Footnote1 and subsequently dried using a pair of silica gel diffusion dryers (TSI 3062). Size classification was performed by either an AAC (Dae, , Cambustion) or a DMA (Dm, , TSI 3081 long DMA as part of a TSI 3080 electrostatic classifier).
Figure 2. Block diagram of the two experimental setups (a and b) used in this study to achieve three configurations (AAC-DMA, AAC-APM, DMA-APM). *N corresponds to soft X-ray charge neutralizer.
The Dae-selected aerosol stream () was charge neutralized using a soft X-ray source (TSI 3088) and sent to a parallel system consisting of a tandem DMA and condensation particle counter (CPC, TSI 3081 long DMA as part of a TSI 3082 electrostatic classifier with a TSI 3775 CPC) and a tandem APM (Kanomax 3602)-CPC (TSI 3775); raw data for AS can be found in Table S2 of the online supplementary information (SI). The flow through these systems was maintained at 300 cm3 min−1 and 250 cm3 min−1 by the CPCs. A cavity ring-down spectrometer is normally situated between the APM and CPC and receives a 50 cm3 min−1 clean air backflush to prevent particle deposition on the mirrors (Radney and Zangmeister Citation2016). Although the CRD was in place, the CRD data was not utilized and will not be discussed in this analysis. Dae selection spanned 150 nm to 550 nm (AS) or 150 nm to 400 nm (CB) with the aerodynamic size resolution (Rae) of the AAC being maintained at 10 for all experiments. All reported data were generated from a single 5 min mobility diameter (Dm) or 10 min mass (m) distribution scan corresponding to 112 samples and ≈ 600 samples, respectively. Thus, the reported measurement results utilize Type B uncertainties (see SI) while reported averages utilize Type A uncertainties (1σ standard deviation across the data set).
The geometric mean mobility diameter, μgeo (see EquationEquation (32)(32)
(32) ), as a function of Dae was determined from the AAC-DMA measurements. In the other experimental setup (), the aerosol stream was Dm-selected at this μgeo and then passed to a parallel system consisting of a tandem DMA-CPC (i.e., scanning mobility particle sizer, SMPS) and a tandem APM-CPC; raw data for AS can be found in Table S3 of the SI. DMA and APM measurements used sheath:aerosol flow of 10:1 and a classification parameter (λc) of 0.32, respectively (Ehara et al. Citation1996).
The operational parameters of the AAC and DMA were chosen to maintain an aerodynamic size resolution (Rae, see EquationEquation (24)(24)
(24) ) and mobility bandwidth (ΔZp/Zp, see EquationEquation (25)
(25)
(25) ) of 0.1, respectively. Unlike the DMA and AAC, the APM transfer function is an asymmetric trapezoid and the peak transmission efficiency is λc-dependent (Kuwata Citation2015). For the APM with λc = 0.32, Δm/m in the negative and positive directions is to -0.24 and 0.27, respectively; see . However, since m scales with D3, the larger Δm/m is comparable to the Rae and ΔZp/Zp of 0.1; see Section 3.4 for a complete discussion of the transfer functions.
The DMAs were calibrated using polystyrene latex spheres atomized from water prior to initiation of the described experiments. Additional details in the calibration and characterization of the DMA and APM are described in Radney and Zangmeister (Citation2016); results shown in Figure S1 of the SI. AAC performance was verified by the manufacturer at the beginning of this study and was reevaluated by the manufacturer at the end of data collection.
3. Theory
The fundamental theory and operational parameters for the AAC, DMA and APM are well-known; see Tavakoli and Olfert (Citation2013), Knutson and Whitby (Citation1975) and Ehara et al. (Citation1996), respectively. Here we give an overview of the relevant theory to highlight the nuances between instruments that will be relevant to the presented results and discussion. As shown in , particle classification by the AAC, DMA and APM rely on a combination of the non-contact forces: centrifugal (Fcen), drag (Fdrag), and/or electrostatic (Felec). In addition to these forces (black arrows), particle streamlines (gray dotted lines) and flows have been included; the centrifugal particle mass analyzer (CPMA) has also been included in for comparison to the APM. All figures are drawn with assuming the radial direction is upwards and flows progress from left to right.
Figure 3. Forces (F), flows (Q), axes of rotation (ω) and particle trajectories (dotted gray lines) in the (a) aerodynamic aerosol classifier (AAC), (b) differential mobility analyzer (DMA), (c) the aerosol particle mass analyzer (APM) and (d) the centrifugal particle mass analyzer (CPMA). All figures are oriented with the radial (r) and transversal (z) axes shown in the center of the figure. Subscripts: aerosol (a), sheath (sh), exhaust (exh), sample (sa), electrical (elec), centrifugal (cen).
Both the aerodynamic diameter (Dae) and the mobility diameter (Dm) quantified by the AAC and the DMA, respectively, are defined relative to a spherical particle. Spherical particles are often assumed, although not necessarily accurate. For comparing sizes, the volume equivalent diameter (Dve)
(1)
(1)
can be used where m is the particle mass and ρp is the particle density, including air voids. For homogeneous particles without air voids, ρp = ρbulk.
3.1. AAC
Any particle moving at a constant velocity (v) experiences equal applied and drag forces
(2)
(2)
where for a sphere in any flow regime (e.g., free-molecular, transition or continuum) (Kulkarni, Baron, and Willeke Citation2011)
(3)
(3)
v and μ are the particle’s velocity and the gas viscosity and Bsp is the mechanical mobility of a sphere
(4)
(4)
The drag force experienced by non-spherical particles is greater than that experienced by a volume equivalent sphere with the same velocity and flow regime effectively reducing B. The dynamic shape factor (χ) represents the ratio of B for a non-spherical particle (Bnon) to that of the volume equivalent sphere (Bve) (Kasper Citation1982)
(5)
(5)
The Cunningham slip correction factor (Cc(D)) has been included to account for decreased drag in the free-molecular and transition regimes relative to the continuum regime. The generic form of the Cunningham slip correction factor Cc(D) (Kulkarni et al. Citation2011) is
(6)
(6)
where λg is the mean free path of the gas at the temperature (T) and pressure (P) of the measurement. For air at T = 298.15 K and P = 101.325 kPa: μ = 1.837 × 10⁻⁵ kg m−1 s−1 and λg = 67.9 nm.
The rotating annular region of the AAC applies a centrifugal force (Fcen)
(7)
(7)
where r and ω are the radial position of the particle and rotation speed, respectively. Thus,
(8)
(8)
with the particle relaxation time (τ) defined as (Hinds Citation1999)
(9)
(9)
Combining EquationEquations (8)(8)
(8) and Equation(9)
(9)
(9)
(10)
(10)
allowing τ to be directly measured
(11)
(11)
where Qsh, Qexh, r1, r2 and L are the sheath flow, exhaust flow, inner classifier radius (56 mm), outer classifier radius (60 mm) and the classifier length (206 mm), respectively. If operating under balanced flows, then Qsh = Qexh and Qa = Qs (the aerosol and sample flows, respectively) (see ) and the numerator of EquationEquation (11)
(11)
(11) simplifies to 2Qsh.
The aerodynamic diameter (Dae) is defined as the diameter of a sphere with standard density (ρ0 = 1 g cm−3) and the same velocity as that being measured. Since m = ρV
(12)
(12)
which rearranges to
(13)
(13)
and it follows that
(14)
(14)
Note that determination of Dae requires that either ρp and χ are known or assumed thus making Dae an estimated parameter; χ = 1 is often assumed in EquationEquation (14)(14)
(14) to allow this underdetermined system to be solved. An effective dynamic shape factor (χeff) is then determined from EquationEquation (13)
(13)
(13) as in (Tavakoli and Olfert Citation2013; Tavakoli, Symonds, and Olfert Citation2014; Kazemimanesh et al. Citation2019). In another instance, (Tavakoli and Olfert Citation2014) did not need to explicitly account for χ since only Dae and Dm, not Dve, were compared. See discussion below.
3.2. DMA
In the DMA, an electric field is applied between two, usually concentric, electrodes (see ) imparting and electrostatic force (Felec) on the charged particles
(15)
(15)
where q, e, and E are the net number of charges on the particle, the elementary electric charge (≈ 1.602 × 10⁻¹⁹ C) and the electric field strength, respectively. The electric mobility (Zp) is (DeCarlo et al. Citation2004)
(16)
(16)
where Dm is defined as the diameter of a sphere with the same electrical mobility as that being measured. Combining EquationEquations (5)
(5)
(5) and Equation(16)
(16)
(16) ,
(17)
(17)
and Dve does not necessarily equal Dsp. DMA measurements typically assume a single net charge is present on the particle. Zp can be related to the physical dimensions of the classifier by
(18)
(18)
where r1 = 0.937 cm, r2 = 1.961 cm and L = 44.369 cm and V is the applied voltage.
3.3. APM
The aerosol particle mass analyzer (APM) is essentially the combination DMA and AAC that is capable of directly measuring particle mass. The classifier rotates about an axis generating Fcen (EquationEquation (7)(7)
(7) ) while an electric potential is applied to the inner electrode generating Felec (EquationEquation (15)
(15)
(15) ); see . Thus,
(19)
(19)
and
(20)
(20)
where r1 = 24 mm and r2 = 25 mm. As can be seen from EquationEquation (20)
(20)
(20) , the APM classifies particles based upon their effective mass (meff) where
(21)
(21)
During APM classification, the particles of interest will have no net radial velocity and Fdrag = 0. The result is that the APM directly measures particle mass without any assumptions of particle shape (χ) but does assume a single net charge. If ρp is known, then Dve can be directly calculated from EquationEquation (1)(1)
(1) , otherwise, in combination with a DMA, the effective density ρeff is calculated as
(22)
(22)
It is worth mentioning that the Cambustion centrifugal particle mass analyzer (CPMA) (see ) operates similarly to the Kanomax APM except that the inner electrode rotates slightly faster than the outer electrode causing Fcen to decrease with radius. This causes particles to exhibit a stable flow for a larger fraction of the operating area impacting the transfer function. We direct the reader to (Olfert and Collings Citation2005) and (Sipkens, Olfert, and Rogak Citation2020b) for an in-depth comparison of the APM and CPMA.
3.4. Transfer functions
Thus far, the transfer functions of the AAC, DMA and APM have been treated as Dirac delta functions. The actual transfer functions have finite widths that are a function of the operating parameters. Since the AAC, DMA and APM utilize different mechanisms for particle classification (relaxation time, electrical mobility and mass-to-charge ratio) these resolutions are often reported utilizing different metrics: relaxation time (Rτ) or aerodynamic size (Rae) resolution, sheath:aerosol flow and the classification parameter (λc), respectively. Here, we relate these resolution metrics to the height and full width of the transfer functions at baseline.
For the AAC, the relaxation time resolution (Rτ) is defined based upon the ratio of Qsh to Qaero and assumes that these flows are balanced, laminar and constant:
(23)
(23)
The AAC transfer function is an isosceles triangle with respect to relaxation time. The fraction of particles transmitted at τ, t(τ) = 1.0, and drops to 0 at τ ± Rτ (Tavakoli and Olfert Citation2013). Rather than utilizing Rτ, the AAC resolution can be defined based upon the aerodynamic diameter resolution (Rae)
(24)
(24)
For constant Rae, the rotation speed and sheath flow of the AAC are a function of the classified particles. Presently, Rae = 10 with Qsh and ω adjusted accordingly by the instrument. The full width of the transfer function is two times Rae and is 0.2 (Rae = 10).
For the DMA – assuming laminar flow and that the particles are non-diffusing – the transfer function is an isosceles triangle with respect to the electrical mobility (Zp). The fraction of particles transmitted at Zp, t(Zp) = 1.0 (Knutson and Whitby Citation1975; Hagwood, Sivathanu, and MulHolland Citation1999; Kuwata Citation2015) and drops to 0 at Zp ± ΔZp where
(25)
(25)
The full width of the transfer function is two times ΔZp/Zp and for the present measurements is 0.2 (Qsh/Qaero = 10). The Zp dependence of the DMA transfer function causes it to be asymmetric with respect to Dm.
The transfer function of the APM – assuming uniform laminar flow – is an asymmetric trapezoid with a center at meff (Lall et al. Citation2008, Citation2009; Kuwata Citation2015). The APM classification parameter (λc) is
(26)
(26)
and represents the ratio of the axial (L/v) and radial (1/2τω2) transversal times of an uncharged particle. Following (Kuwata Citation2015), the width of the transfer function at baseline in the positive and negative directions (Δm+/ms and Δm-/ms, respectively, or Δm±/ms collectively) is
(27)
(27)
where
(28)
(28)
and the center of the classification region (rc)
(29)
(29)
r1 and r2 are the radius of the inner (24 mm) and outer (25 mm) electrodes, respectively. The transmission probability is
(30)
(30)
spanning from
(31)
(31)
Presently, λc = 0.32 corresponding to Δm-/meff = 0.242 and Δm+/meff = 0.275 and t(meff) = 0.73.
The DMA, AAC and APM transfer functions in their native measurands (Zp, Dae and m) are plotted in , respectively. The combined values transformed to Dve are shown in utilizing the operational parameters outlined above. The absolute widths of the transfer functions will scale with size, so these values should be considered representative for this Dve. For these calculations, a spherical AS particle with a physical diameter of 250 nm and bulk density was assumed; i.e., Dp = Dm = Dve = 250 nm, ρp = ρeff = ρbulk = 1.77 g cm−3, χ = 1, mp = 14.4 fg and Dae = 356 nm.
Figure 4. Calculated transfer functions for the (a) DMA (solid), (b) AAC (dashed) and (c) APM (dotted) in their native units of electrical mobility (Zp), aerodynamic diameter (Dae), and mass (m). (d) All transfer functions converted to volume equivalent diameter (Dve) for a spherical AS assuming a physical diameter of 250 nm and bulk density; see discussion in text.
Note, the transfer function calculated in is for the APM and not the CPMA. The CPMA transfer function has a similar trapezoidal shape but higher t(m) = 1 independent of λc; see Olfert and Collings (Citation2005) and Sipkens et al. (Citation2020b) for detailed comparisons of the APM and CPMA transfer functions.
3.5. Data inversions
Scanning measurements by the AAC, DMA or APM are often performed and the data must be inverted in order to determine the underlying particle distributions; e.g., Mai and Flagan (Citation2018) and Stolzenburg (Citation2018) for the DMA and Rawat et al. (Citation2016) and Sipkens Sipkens, Olfert, and Rogak (Citation2020a) for the DMA-APM. However, in the present work, data inversions were not performed since the parameters of interest (Dae, Dm and m for the AAC, DMA and APM, respectively) could be determined directly from the instrumental setpoint (Dae and Dm) or from fitting the distributions of the scanned data (Dm and m). We assume that the aerosol concentration is constant over the width of the transfer functions (Stolzenburg and McMurry Citation2018) but expect this assumption to have little impact on our measurements since: (1) the geometric or arithmetic means are the quantity of interest and (2) these deviations are small relative to the instrumentally imposed measurement resolution.
3.6. Multiple charging
All classification methods that are charge dependent suffer from multiple charging issues (|q| > 1) and this is especially true for the DMA and APM. Prior to classification by these instruments, the aerosol stream is passed through a charge neutralizer (*N in ) to impart a known bipolar charge distribution to the particles (Wiedensohler and Fissan Citation1988; Tigges et al. Citation2015). The q of particles exiting the charge neutralizer is a strong function of particle size, shape (Rogak, Flagan, and Nguyen Citation1993), neutralizer age and type (Tigges et al. Citation2015), and to a lesser extent particle morphology (Covert, Wiedensohler, and Russell Citation1997).
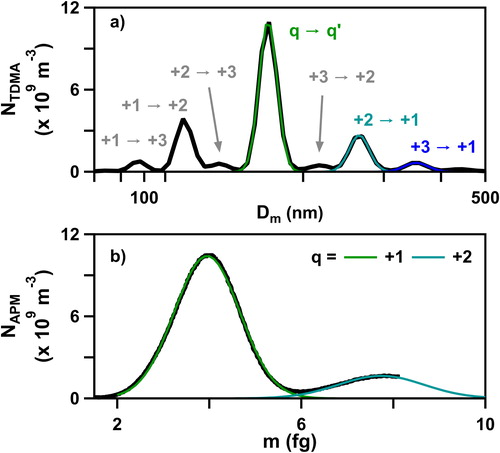
To demonstrate these multiple charging artifacts, we performed tandem DMA (TDMA) measurements whereby particles exiting an upstream DMA are passed through a second neutralizer and DMA and the corresponding size distribution was measured; see . A representative TDMA size distribution is shown in for AS aerosol with a nominal Dae ≈ 250 nm (Dm = 169 nm). The notation q → q’ in denotes the charge of particles exiting the first and second DMAs, respectively. The size distribution exhibits multiple peaks beyond just that selected by the upstream DMA (Dm = 169 nm); in the case of Dm = 169 nm (green line), the peak is composed primarily of particles with q = q′ = +1 with smaller fractions of q = q′ = +2 and +3 also present (Mamakos Citation2016). In addition, q → q′ of +2 → +1, +3 → +1, +1 → +2, +1 → +3, +2 → +3 and +3 → +2 are observed at Dm = 265.2 nm, 352.9 nm, 110.1 nm, 87.33 nm, ≈ 217 nm and ≈ 131 nm, respectively. To determine Dm, the mobility distributions were fit utilizing multiple log-normal distributions
(32)
(32)
and A, μgeo and σgeo are the peak amplitude, the geometric mean diameter and the geometric standard deviation. For consistency, we will continue to refer to fitted μgeo as the Dm of the distribution. The summation and the i subscripts denote that all peaks with N > 7.5 × 10⁸ m−3 were included in the fit. Other higher order multiples could also be present but unresolved – e.g., +4 → +2, +6 → +3, etc. (Mamakos Citation2016) – since the soft X-ray neutralizer produces a greater fraction of q > +1 than the radioactive neutralizers (Tigges et al. Citation2015). These redistributed charges are only present in the TDMA measurements and only apply to the illustrative data presented here. Even if a significant number of higher order charges are present, they are not expected to impact the determination of Dm.
Figure 5. (a) Tandem DMA number density (NTDMA) as a function of mobility diameter for AS particles with an aerodynamic diameter (Dae) ≈ 250 nm. Particle net charge (q) is denoted as q → q′ where q and q′ correspond to the q in the first and second DMA, respectively. (b) DMA-APM number density (NAPM) as a function of mass (m). The net charge +1 (green), +2 (cyan) and +3 (blue) on the particles is shown.
To determine the average particle mass, the distribution of N as a function of m was measured by the APM and were fit utilizing multiple Gaussian distributions
(33)
(33)
where A, m and σ correspond to the peak amplitude, the mass and the width (i.e., standard deviation) of the distribution. Similar to Dm (EquationEquation (32)
(32)
(32) ), and for consistency throughout, we will continue to refer to the average mass of the distribution (meff,q) as m. The summations and q have been included to denote that all peaks with q ≥ +1 were included in the fit; see . In instances where particles are non-spherical with low effective densities, even this approach has its limitations (Radney et al. Citation2014).
When performing DMA-APM measurements, the particles are not sent through a second charge neutralizer prior to the APM. Thus, all particles exiting the DMA having a common electrical mobility with physical diameters (and hence masses) that scale with charge as shown by the +2 → +1 (cyan) and +3 → +1 (blue) traces in . These particles bearing larger charges can also be seen in the mass distributions of N as shown in .
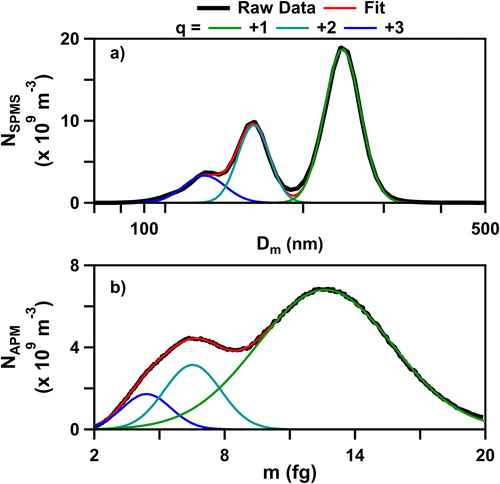
Separation of particles by an AAC, versus a DMA, poses slightly different challenges when combined with a downstream DMA or APM (). The AAC separates particles based upon their relaxation time to an applied centrifugal force and is charge independent. However, upon passing from the AAC to either a DMA or APM, the particles must pass through a charge neutralizer in order to reach an equilibrium bipolar charge distribution independent of the incoming charge state (Wiedensohler and Fissan Citation1988). This causes the size distribution to exhibit multiple peaks where all particles have a common Dae but a q-dependent Dm; see for AAC-DMA measurements of AS with Dae = 350 nm. In the AAC-APM, versus the DMA-APM, the contributions of particles bearing q > +1 cannot necessarily be isolated as seen in .
Figure 6. (a) AAC-DMA number density (NSMPS) as a function of mobility diameter for AS particles with aerodynamic diameter (Dae) = 350 nm. (b) AAC-APM number density (NAPM). The net charge +1 (green), +2 (cyan) and +3 (blue) on the particles is shown.
For the purpose of comparing the tandem measurements (AAC-DMA, AAC-APM and DMA-APM) the quantities of interest will derive from the geometric and arithmetic means of the measured size and mass distributions by the DMA and APM, respectively. As a result, the impact of multiple charging on the reported results is only expected to be significant for smaller particles where overlap between successive charges increases. Non-spherical particles with low effective densities, such as fresh soot, would exhibit similar problems but are not considered here; e.g., Radney et al. (Citation2014) and Tavakoli and Olfert (Citation2014). The smallest AS particles measured presently had Dm ≈ 100 nm with ρp = 1.77 g cm−3 while for CB the smallest Dm ≈ 150 nm and ρp = 1.00 g cm−3 so the multiple charging effects are resolvable.
3.7. Comparing tandem measurements
A fundamental objective of this article is to compare the measured and derived parameters from each of the tandem techniques (AAC-DMA, AAC-APM and DMA-APM); see and . In the case of the AAC-DMA, τ and Zp are measured (EquationEquations (11)(11)
(11) and Equation(18)
(18)
(18) , respectively) from which B (EquationEquation (16)
(16)
(16) ), and hence m (EquationEquation (9)
(9)
(9) ) can be calculated. For the AAC-APM, τ and m are measured (EquationEquations (11)
(11)
(11) and Equation(20)
(20)
(20) , respectively), from which B (EquationEquation (9)
(9)
(9) ), and hence Dm (EquationEquation (16)
(16)
(16) ) can be calculated. For the DMA-APM, Zp and m are measured (EquationEquations (17)
(17)
(17) and Equation(20)
(20)
(20) , respectively) from which B, and hence τ (EquationEquation (9)
(9)
(9) ) can be determined. Dae is determined from τ in all configurations assuming χ = 1 (EquationEquation (14)
(14)
(14) ). For all tandem combinations, a ρp must be assumed in order to estimate Dve (EquationEquation (1)
(1)
(1) ) and χeff (EquationEquation (5)
(5)
(5) ).
4. Results and discussion
4.1. Ammonium sulfate
In principle, measured pairwise combinations of τ (Dae), Zp (Dm) and/or m by an AAC, DMA and/or APM, respectively, can be used to derive the third quantity (as shown in ). In one configuration, particles were classified by Dae with the AAC and Dm and mp were measured in parallel (). For direct comparability between measurements, in the second configuration (), particles were classified by the DMA using the measured Dm from the AAC-DMA. As a result, the Dm data from the DMA-APM has not been included in the Dm comparisons (see ).
Figure 7. Comparison of three different measurements – AAC-DMA (circles, black), AAC-APM (squares, red), and DMA-APM (triangles, green) – of ammonium sulfate (AS) aerosol spanning Dae from 150 nm to 550 nm. (a) Mobility diameter (Dm) determined from AAC-DMA measurement and AAC-APM calculation; (b) Dm % deviation; (c) particle mass (m); (d) m % deviation; (e) effective density (ρeff); (f) ρeff % deviation; (g) effective shape factor (χeff); (h) χeff % deviation.
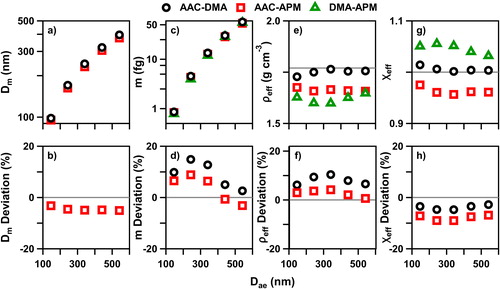
In the case of AS, the calculated Dm (AAC-APM, red squares) were consistently smaller than the measured Dm (AAC-DMA, black circles), see , with an average deviation of (-4 ± 1)% (). The relative deviations between measurements (i) are calculated as
(34)
(34)
The relative deviations of were calculated with a representing the AAC-APM and b the AAC-DMA. For all other calculations of relative deviation (), a represents either the AAC-DMA or AAC-APM and b the DMA-APM.
The AAC-DMA measures τ and Zp from which the Dae (EquationEquation (14)(14)
(14) ) and Dm (EquationEquation (16)
(16)
(16) ) are derived. Similar to the investigations of (Tavakoli and Olfert Citation2013; Tavakoli et al. Citation2014; Kazemimanesh et al. Citation2019), we assume that χ = 1 in EquationEquation (14)
(14)
(14) allowing for Dae to be calculated; χeff is later calculated from Dve. The m calculated from the AAC-DMA can be compared to the m directly measured by the AAC-APM and DMA-APM; see . In general, the AAC-DMA tends to report the highest m of all measurements. The average m deviation between the DMA-APM and the AAC-DMA and the AAC-APM are (9 ± 5)% and (4 ± 5)% for AS, respectively. All measures of m agree within 15%.
Particle effective density (ρeff) is an important parameter that can serve as a metric of particle morphology and may be used to convert size distributions to mass distributions or from mobility distributions to aerodynamic distributions (Johnson et al. Citation2018); the μgeo of the Dm fits were utilized in the calculation of ρeff, see EquationEquations (22)(22)
(22) and Equation(32)
(32)
(32) .The average ρeff for AS spanning 150 nm ≤ Dae ≤ 550 nm are (1.62 ± 0.02) g cm−3, (1.75 ± 0.01) g cm−3 and (1.91 ± 0.04) g cm−3 for the DMA-APM, AAC-DMA and AAC-APM, respectively. The % deviations are (8 ± 2)% and (18 ± 3)% for the AAC-DMA and AAC-APM versus the DMA-APM, respectively (). Notably, the ρeff determined from the AAC-APM measurements are not physically reasonable considering the bulk density of AS is 1.77 g cm−3 and these particles are not expected to be perfectly spherical and may contain voids (Zelenyuk, Cai, and Imre Citation2006).
The dynamic shape factor (χ) is another useful metric for quantifying particle morphology. It is defined as the ratio of the drag force experienced by a non-spherical particle to the drag force experienced by a volume-equivalent spherical particle with the same velocity and flow regime with values of 1 for perfect spheres and ≫ 1 for lacey aggregates. In the case of AS, the DMA-APM, AAC-DMA and AAC-APM yielded χeff of 1.05 ± 0.01, 1.006 ± 0.005, 0.97 ± 0.03, respectively; we refer to these as effective dynamic shape factors (χeff) because a particle density (ρp) – here ρp = ρbulk = 1.77 g cm−3 – must be assumed. This is different than the dynamic shape factor (χ) determined for CB below from the triplet of instruments where ρp is not assumed. The deviations are (-4 ± 1)% and (-8 ± 1)% for the AAC-DMA and AAC-APM versus the DMA-APM, respectively. As with ρeff, the AAC-APM measurements are not physically reasonable (χ < 1), even though all measurements are within 8% of each other.
4.2. Data harmonization
The governing behavior of the classifiers (AAC, DMA and APM) and associated mathematical relationships are highly interconnected due to their similarity (see ). On average there is an 8% deviation in ρeff between the AAC-DMA (1.75 ± 0.01) g cm−3, and the DMA-APM (1.62 ± 0.02) g cm−3 and an 18% deviation between the DMA-APM and the AAC-APM (1.91 ± 0.04) g cm−3. If instead ρeff was calculated with the Dm from the AAC-DMA and mp from the AAC-APM, ρeff = (1.66 ± 0.1) g cm−3 and the deviation decreases to 2.7%; within measurement uncertainty (see Table S1 of the SI for uncertainties). This indicates that the m calculated from the AAC-DMA and Dm calculated from the AAC-APM are responsible for the deviations.
The relaxation time (τ = mB, EquationEquation (9)(9)
(9) ) assumes sphericity. However, the mass that of interest is for a non-spherical particle (AS) requiring that χ be included in EquationEquation (9)
(9)
(9) ; i.e.
(35)
(35)
Utilizing χeff from the DMA-APM to calculate m in EquationEquation (35)(35)
(35) decreases the average ρeff from (1.75 ± 0.01) g cm−3 to (1.67 ± 0.02) g cm−3 with a deviation of 3.4%, nearly within the calculated uncertainty of 2.9% and 3.2% for the AAC-DMA and DMA-APM, respectively. This also implies that the Dae calculated from τ should also be decreased by ≈ √τ (EquationEquation (14)
(14)
(14) ).
Like τ, Dm assumes sphericity, so the actual particle mobility will be smaller by a factor of χ. Utilizing χeff from the DMA-APM to calculate Dm for the AAC-APM decreases ρeff from (1.91 ± 0.04) g cm−3 to (1.62 ± 0.02) g cm−3 and the deviation is < 1%.
The observations presented above demonstrate that data harmonization between the DMA-APM, AAC-DMA and AAC-APM requires the use of χ since it is the conversion factor between sphericity and non-sphericity. To a lesser extent, data harmonization could also be impacted by: (1) the assumed physical and thermodynamic parameters (μ = 18.3245 × 10⁻⁶ Pa s and λg= 68.29 nm at T = 295.61 K and P = 99.6 kPa) and (2) the Cunningham slip correction factor which is dependent upon both the surface roughness and the physical state (solid or liquid) of the particle (Allen and Raabe Citation1985) and have uncertainties on the order of 1.2% (Tavakoli and Olfert Citation2014) and 2.1% (Allen and Raabe Citation1985), respectively.
Tavakoli and Olfert (Citation2014) measured the ρeff of dioctyl sebacate (DOS), an organic liquid, using the AAC-DMA and obtained ρeff that agreed very well with ρbulk: (0.903 ± 0.090) g cm−3 versus (0.913 ± 0.003) g cm−3, respectively, a -1.1% difference. We attribute this agreement to the fact that DOS is a liquid and forms smooth, spherical, void-free particles (i.e., χ = 1 so Cc(D) is well-known) and so the analysis above was not necessary. However, it is possible that the soot masses of Tavakoli and Olfert (Citation2014) could be in error since χ was not utilized in the determination of m, but rather calculated afterwards. For CB (see below), this distinction results in the calculated mass being ≈ 10% higher than measured.
4.3. Carbon black
In addition to AS, an aged black carbon mimic (CB) was also investigated. Unlike AS, which is a solid and nearly spherical, the CB particles consists of spherical monomers ≈ 30 nm in diameter agglomerated into a larger particle with a compacted morphology (You et al. Citation2016). Utilizing the combination of τ, B (from Dm) and m measured by the AAC, DMA and APM – tandem configuration of – χ (EquationEquation (35)(35)
(35) ) and ρp (EquationEquation (1)
(1)
(1) ) were be quantitatively determined to be 1.09 ± 0.03 and (1.00 ± 0.03) g cm−3, respectively, with a minor size dependence; see . Assuming ρbulk = 1.8 g cm−3 for CB, this implies that CB has a packing density (θf) of 0.55 ± 0.02 which higher than expected for soot compacted through water condensation and evaporation (Zangmeister et al. Citation2014).
Table 1. Measured and calculated parameters for CB.
5. Summary
The AAC, DMA and APM measure the aerodynamic diameter (Dae from τ), mobility diameter (Dm from Zp) and mass (m). Combining these three measurements allow for the dynamic shape factor (χ) and particle density (ρp) to be determined quantitatively. However, the use of two out of the three quantities to define mass, size, shape and/or density is subject to uncertainty. Specifically, mass and size values determined by these three configurations vary by up to 10% causing the effective density to vary by up to 18%. More importantly, nonphysical values are sometimes reported. Further errors can arise, especially when utilizing an AAC, from assuming a dynamic shape factor (χ). Physical conditions are also important but to a lesser extent than χ; e.g., T and P affect the gas viscosity, mean free path and Cunningham slip correction factor therefore impacting Dm and Dae. Uncertainties in the effective dynamic shape factor can easily be greater than 10% when utilizing a paired combination of instruments with the triplet circumventing these issues. Understanding these differences is required to harmonize methods, improve data agreement and enable quantitative comparability between studies.
| Nomenclature | ||
| AAC | = | aerodynamic aerosol classifier |
| APM | = | aerosol particle mass analyzer |
| AS | = | ammonium sulfate |
| B | = | mechanical mobility (m N−1 s−1) |
| Cc | = | Cunningham slip correction factor |
| χ | = | dynamic shape factor |
| CB | = | carbon black |
| CPMA | = | centrifugal particle mass analyzer |
| CPC | = | condensation particle counter |
| D | = | diameter (nm) |
| DMA | = | differential mobility analyzer |
| Δx | = | width of x’s transfer function |
| e | = | elementary charge (≈ 1.602 × 10⁻¹⁹ C) |
| F | = | force (N) |
| L | = | length (cm) |
| λc | = | APM classification parameter |
| λg | = | mean free path (nm) |
| m | = | mass (fg) |
| μ | = | gas viscosity (kg m−1 s−1) |
| μgeo | = | geometric mean diameter (nm) |
| N | = | number density of particles (m−3) |
| P | = | pressure (kPa) |
| q | = | net charge |
| Q | = | flow (L min−1) |
| r | = | radius (cm) |
| R | = | resolution |
| ρ | = | density (g cm−3) |
| σ | = | distribution width |
| T | = | temperature (K) |
| τ | = | relaxation time (ns) |
| V | = | voltage (V) |
| Zp | = | electrical mobility (m2 V−1 s−1) |
| ω | = | rotation speed (rotations min−1) |
| Subscripts | ||
| ae | = | aerodynamic |
| aero | = | aerosol |
| bulk | = | bulk |
| c | = | center |
| eff | = | effective |
| m | = | mobility |
| non | = | non-spherical |
| p | = | particle |
| s | = | sample |
| sh | = | sheath |
| sp | = | spherical |
| ve | = | volume equivalent |
| 1 | = | inner |
| 2 | = | outer |
Supplemental Material
Download MS Word (75.5 KB)Additional information
Funding
Notes
1 NIST Technical Disclaimer: Certain commercial equipment, instruments, or materials (or suppliers, or software, …) are identified in this paper to foster understanding. Such identification does not imply recommendation or endorsement by the National Institute of Standards and Technology, nor does it imply that the materials or equipment identified are necessarily the best available for the purpose.
References
- Allen, M. D., and O. G. Raabe. 1985. Slip correction measurements of spherical solid aerosol particles in an improved Millikan apparatus. Aerosol Sci. Technol. 4 (3):269–286. doi:10.1080/02786828508959055.
- Covert, D., A. Wiedensohler, and L. Russell. 1997. Particle charging and transmission efficiencies of aerosol charge neutralizes. Aerosol Sci. Technol. 27 (2):206–214. doi:10.1080/02786829708965467.
- DeCarlo, P. F., J. G. Slowik, D. R. Worsnop, P. Davidovits, and J. L. Jimenez. 2004. Particle morphology and density characterization by combined mobility and aerodynamic diameter measurements. Part 1: Theory. Aerosol Sci. Technol. 38 (12):1185–1205. doi:10.1080/027868290903907.
- Ehara, K., C. Hagwood, and K. J. Coakley. 1996. Novel method to classify aerosol particles according to their mass-to-charge ratio—Aerosol particle mass analyser. J. Aerosol Sci. 27 (2):217–234. doi:10.1016/0021-8502(95)00562-5.
- Hagwood, C., Y. Sivathanu, and G. Mulholland. 1999. The DMA transfer function with Brownian motion a trajectory/Monte-Carlo approach. Aerosol Sci. Technol. 30 (1):40–61. doi:10.1080/027868299304877.
- Hand, J. L., and S. M. Kreidenweis. 2002. A new method for retrieving particle refractive index and effective density from aerosol size distribution data. Aerosol Sci. Technol. 36 (10):1012–1026. doi:10.1080/02786820290092276.
- Hinds, W. C. 1999. Aerosol technology: Properties. In Behavior, and measurement of airborne particles. New York, NY: John Wiley & Sons, Inc.
- Johnson, T. J., M. Irwin, J. P. R. Symonds, J. S. Olfert, and A. M. Boies. 2018. Measuring aerosol size distributions with the aerodynamic aerosol classifier. Aerosol Sci. Technol. 52 (6):655–665. doi:10.1080/02786826.2018.1440063.
- Kasper, G. 1982. Dynamics and measurement of smokes. I. Size characterization of nonspherical particles. Aerosol Sci. Technol. 1 (2):187–199. doi:10.1080/02786828208958587.
- Kazemimanesh, M., A. Moallemi, K. Thomson, G. Smallwood, P. Lobo, and J. S. Olfert. 2019. A novel miniature inverted-flame burner for the generation of soot nanoparticles. Aerosol Sci. Technol. 53 (2):184–195. doi:10.1080/02786826.2018.1556774.
- Knutson, E. O., and K. T. Whitby. 1975. Aerosol classification by electric mobility: Apparatus, theory, and applications. J. Aerosol Sci. 6 (6):443–451. doi:10.1016/0021-8502(75)90060-9.
- Kulkarni, P., P. A. Baron, and K. Willeke. ed. 2011. Aerosol measurement: Principles, techniques and applications. Hoboken, NJ: John Wiley & Sons, Inc. doi:10.1002/9781118001684.
- Kuwata, M. 2015. Particle classification by the tandem differential mobility analyzer–particle mass analyzer system. Aerosol Sci. Technol. 49 (7):508–520. doi:10.1080/02786826.2015.1045058.
- Lall, A., X. Ma, S. Guha, G. Mulholland, and M. Zachariah. 2009. Online nanoparticle mass measurement by combined aerosol particle mass analyzer and differential mobility analyzer: Comparison of theory and measurements. Aerosol Sci. Technol. 43 (11):1075–1083. doi:10.1080/02786820903095484.
- Lall, A. A., W. Rong, L. Mädler, and S. K. Friedlander. 2008. Nanoparticle aggregate volume determination by electrical mobility analysis: Test of idealized aggregate theory using aerosol particle mass analyzer measurements. J. Aerosol Sci. 39 (5):403–417. doi:10.1016/j.jaerosci.2007.12.010.
- Mai, H., and R. C. Flagan. 2018. Scanning DMA data analysis I. Classification transfer function. Aerosol Sci. Technol. 52 (12):1382–1399. doi:10.1080/02786826.2018.1528005.
- Mamakos, A. 2016. Methodology to quantify the ratio of multiple-to single-charged fractions acquired in aerosol neutralizers. Aerosol Sci. Technol. 50 (4):363–372. doi:10.1080/02786826.2016.1153034.
- Maricq, M. M., D. H. Podsiadlik, and R. E. Chase. 2000. Size distributions of motor vehicle exhaust PM: A comparison between ELPI and SMPS measurements. Aerosol Sci. Technol. 33 (3):239–260. doi:10.1080/027868200416231.
- McMurry, P. H., X. Wang, K. Park, and K. Ehara. 2002. The relationship between mass and mobility for atmospheric particles: A new technique for measuring particle density. Aerosol Sci. Technol. 36 (2):227–238. doi:10.1080/027868202753504083.
- Olfert, J. S. 2005. A numerical calculation of the transfer function of the fluted centrifugal particle mass analyzer. Aerosol Sci. Technol. 39 (10):1002–1009. doi:10.1080/02786820500380222.
- Olfert, J. S., and N. Collings. 2005. New method for particle mass classification—The Couette centrifugal particle mass analyzer. J. Aerosol Sci. 36 (11):1338–1352. doi:10.1016/j.jaerosci.2005.03.006.
- Olfert, J. S., J. P. R. Symonds, and N. Collings. 2007. The effective density and fractal dimension of particles emitted from a light-duty diesel vehicle with a diesel oxidation catalyst. J. Aerosol Sci. 38 (1):69–82. doi:10.1016/j.jaerosci.2006.10.002.
- Park, K., D. Dutcher, M. Emery, J. Pagels, H. Sakurai, J. Scheckman, S. Qian, M. R. Stolzenburg, X. Wang, J. Yang, et al. 2008. Tandem measurements of aerosol properties—A review of mobility techniques with extensions. Aerosol Sci. Technol. 42 (10):801–816. doi:10.1080/02786820802339561.
- Radney, J. G., R. You, X. Ma, J. M. Conny, M. R. Zachariah, J. T. Hodges, and C. D. Zangmeister. 2014. Dependence of soot optical properties on particle morphology: Measurements and model comparisons. Environ. Sci. Technol. 48 (6):3169–3176. doi:10.1021/es4041804.
- Radney, J. G., and C. D. Zangmeister. 2016. Practical limitations of aerosol separation by a tandem differential mobility analyzer–aerosol particle mass analyzer. Aerosol Sci. Technol. 50 (2):160–172. doi:10.1080/02786826.2015.1136733.
- Rawat, V. K., D. T. Buckley, S. Kimoto, M.-H. Lee, N. Fukushima, and C. J. Hogan. Jr, 2016. Two dimensional size–mass distribution function inversion from differential mobility analyzer–aerosol particle mass analyzer (DMA–APM) measurements. J. Aerosol Sci. 92:70–82. doi:10.1016/j.jaerosci.2015.11.001.
- Rogak, S. N., R. C. Flagan, and H. V. Nguyen. 1993. The mobility and structure of aerosol agglomerates. Aerosol Sci. Technol. 18 (1):25–47. doi:10.1080/02786829308959582.
- Sipkens, T. A., J. S. Olfert, and S. N. Rogak. 2020a. Inversion methods to determine two-dimensional aerosol mass-mobility distributions: A critical comparison of established methods. J. Aerosol Sci. 140:105484. doi:10.1016/j.jaerosci.2019.105484.
- Sipkens, T. A., J. S. Olfert, and S. N. Rogak. 2020b. New approaches to calculate the transfer function of particle mass analyzers. Aerosol Sci. Technol. 54 (1):111–127. doi:10.1080/02786826.2019.1680794.
- Stolzenburg, M. R. 2018. A review of transfer theory and characterization of measured performance for differential mobility analyzers. Aerosol Sci. Technol. 52 (10):1194–1175. doi:10.1080/02786826.2018.1514101.
- Stolzenburg, M. R., and P. H. McMurry. 2018. Accuracy of recovered moments for narrow mobility distributions obtained with commonly used inversion algorithms for mobility size spectrometers. Aerosol Sci. Technol. 52 (6):614–625. doi:10.1080/02786826.2018.1455963.
- Tavakoli, F., and J. S. Olfert. 2013. An instrument for the classification of aerosols by particle relaxation time: Theoretical models of the aerodynamic aerosol classifier. Aerosol Sci. Technol. 47 (8):916–926. doi:10.1080/02786826.2013.802761.
- Tavakoli, F., and J. S. Olfert. 2014. Determination of particle mass, effective density, mass–mobility exponent, and dynamic shape factor using an aerodynamic aerosol classifier and a differential mobility analyzer in tandem. J. Aerosol Sci. 75:35–42. doi:10.1016/j.jaerosci.2014.04.010.
- Tavakoli, F., J. P. R. Symonds, and J. S. Olfert. 2014. Generation of a monodisperse size-classified aerosol independent of particle charge. Aerosol Sci. Technol. 48 (3):i–iv. doi:10.1080/02786826.2013.877121.
- Tigges, L., A. Wiedensohler, K. Weinhold, J. Gandhi, and H. J. Schmid. 2015. Bipolar charge distribution of a soft X-ray diffusion charger. J. Aerosol Sci. 90:77–86. doi:10.1016/j.jaerosci.2015.07.002.
- Virtanen, A., J. Ristimäki, and J. Keskinen. 2004. Method for measuring effective density and fractal dimension of aerosol agglomerates. Aerosol Sci. Technol. 38 (5):437–446. doi:10.1080/02786820490445155.
- Wang, S. C., and R. C. Flagan. 1990. Scanning electrical mobility spectrometer. Aerosol Sci. Technol. 13 (2):230–240. doi:10.1080/02786829008959441.
- Wiedensohler, A., and H. J. Fissan. 1988. Aerosol charging in high purity gases. J. Aerosol Sci. 19 (7):867–870. doi:10.1016/0021-8502(88)90054-7.
- You, R., J. G. Radney, M. R. Zachariah, and C. D. Zangmeister. 2016. Measured wavelength-dependent absorption enhancement of internally mixed black carbon with absorbing and nonabsorbing materials. Environ. Sci. Technol. 50 (15):7982–7990. doi:10.1021/acs.est.6b01473.
- Zangmeister, C. D., C. D. Grimes, R. R. Dickerson, and J. G. Radney. 2019. Characterization and demonstration of a black carbon aerosol mimic for instrument evaluation. Aerosol Sci. Technol. 53 (11):1–12. doi:10.1080/02786826.2019.1660302.
- Zangmeister, C. D., J. G. Radney, L. T. Dockery, J. T. Young, X. Ma, R. You, and M. R. Zachariah. 2014. Packing density of rigid aggregates is independent of scale. Proc. Natl. Acad. Sci. USA 111 (25):9037–9041. doi:10.1073/pnas.1403768111.
- Zelenyuk, A., Y. Cai, and D. Imre. 2006. From agglomerates of spheres to irregularly shaped particles: Determination of dynamic shape factors from measurements of mobility and vacuum aerodynamic diameters. Aerosol Sci. Technol. 40 (3):197–217. doi:10.1080/02786820500529406.