
 ?Mathematical formulae have been encoded as MathML and are displayed in this HTML version using MathJax in order to improve their display. Uncheck the box to turn MathJax off. This feature requires Javascript. Click on a formula to zoom.
Abstract
We report measurements of the size, concentration, and hygroscopicity of ultrafine particles (UFPs) emitted during thermal spraying of ceramic coatings in an industrial setting. High concentrations (i.e., higher than 106 cm−3) of fractal-like UFPs were measured inside the spraying booths of the facility. The emitted UFPs were found to take up small amounts of water when exposed to elevated relative humidity (RH = 87%) within a Hygroscopic Tandem Differential Mobility Analyzer (HTDMA) system. The hygroscopicity of the sampled particles was distinguishably lower compared to those of the atmospheric background aerosol particles present in the breathing air. UFPs smaller than 90 nm that are produced by the thermal spraying process, exhibit hygroscopic factors less than unity in a systematic way. This behavior indicates that the particles were irregularly shaped at dry conditions, and that they underwent a shape change (i.e., restructuring) upon humidification inside the HTDMA. The fractal-like structure of process-emitted UFPs was further corroborated by Transmission Electron Microscopy (TEM) conducted on samples collected at dry conditions on site.
Copyright © 2020 American Association for Aerosol Research
EDITOR:
1. Introduction
Release of airborne particles in the workplace has become an issue of growing concern with regard to worker exposure (Pietroiusti et al. Citation2018; Viitanen et al. 2017), given their well-established adverse respiratory and cardiovascular impacts (Oberdörster Citation2001; World Health Organization Citation2016; Gakidou et al., 2017; Landrigan Citation2017). Ultrafine particles (UFPs) in particular, which entail the highest risks, may be unintentionally emitted during different industrial processes such as welding (Zhang et al. Citation2013), ceramic tile sintering (Fonseca et al. Citation2016), atmospheric plasma spraying (Salmatonidis et al. Citation2019), laser ablation (Salmatonidis et al. Citation2018), or iron casting (van Broekhuizen Citation2017). Thermal spraying processes, such as atmospheric plasma spraying (APS) and High Velocity Oxy-fuel (HVOF) have been associated with high UFP emissions (Salmatonidis et al. Citation2019). Unintentional release of UFPs in industrial settings frequently results in high exposure concentrations, which contrast with relatively low background particle concentrations (Fonseca et al. Citation2015; Dahmann Citation2016; van Broekhuizen Citation2017). Nevertheless, distinguishing between the two particle populations based on their intrinsic properties, is of primary importance for assessing their potential toxicological and health impacts (Ganguly, Breen, and Pillai Citation2018; Limbach et al. Citation2007; Song, Li, and Du Citation2009).
Discriminating unintentionally released UFPs – also referred to as process-generated or incidental nanoparticles – from background aerosol particles using methods based on spatially or temporally distributed observations are already reported in the literature (Kuhlbusch et al. Citation2011, Kuhlbusch, John, and Quass Citation2009; Schill and Chosewood Citation2013; OECD Citation2015; Asbach, Clavaguera, and Todea Citation2016; Dahmann Citation2016). Most of these methods employ instruments to quantify background and UFP sources in terms of aerosol metrics such as particle number or mass concentrations (Ono-Ogasawara, Serita, and Takaya Citation2009; Peters et al. Citation2008; OECD Citation2015), but not based on intrinsic particle properties such as morphology. This is mainly due to the fact that most of the instruments available for exposure monitoring employ these metrics (Asbach, Clavaguera, and Todea Citation2016), posing a challenge for source identification and distinction between process-generated and background aerosol particles; something that state-of-the-art aerosol instrumentation can achieve (Kalantzi and Biskos Citation2014).
Apart from the concentration of UFPs, having information of their size distribution and hygroscopic behavior is key to understanding their impacts upon human health. This is because these are two intrinsic properties that define the deposition efficiency of inhaled particles in the human respiratory system (Löndahl et al. Citation2007; Ching and Kajino Citation2018). The size of the inhaled particle affects directly their deposition efficiency in the different parts of the respiratory system, whereas the hygroscopicity can have an indirect effect as it can change the size and morphology of the particles within the respiratory system. In fact, aerosol hygroscopicity plays a significant role given that inhaled particles are exposed to relative humidity (RH) levels close to 99% in the human respiratory system (Anselm et al. Citation1990; Ferron, Kreyling, and Haider Citation1988), at which the size, structure, and consequently the deposition patterns, of the particles can change (Löndahl et al. Citation2007). The mixing state of the inhaled aerosol also plays an important role on particle deposition in the human respiratory system, and consequently on the associated health effects. In externally mixed aerosols, particles having the same size at dry conditions but different chemical composition, will grow to different sizes, and therefore exhibit different deposition patterns, upon inhalation. Along these lines, it has been shown that the deposition of externally mixed fresh hydrophobic urban soot in the alveolar region can be underestimated by 5 to 20% if treated as internally mixed with more hygroscopic background aerosols (Ching and Kajino Citation2018).
An additional motive for probing the hygroscopic behavior of aerosol particles is that it can be used as a metric to identify particles with irregular morphology (i.e., fractal-like particles) as their shape can change from that of open to more compact structures at elevated RH conditions during the measurements. This phenomenon is manifested as an apparent shrinking of the particles when exposed to elevated RH, which can significantly affect other size/shape-related metrics (e.g., their Lung Deposition Surface Area; Asbach et al. Citation2017). Observations of restructuring upon humidification have been reported for non-spherical but hygroscopic particles (e.g., sodium chloride particles; Krämer, Pöschl, and Niessner Citation2000; Biskos et al. Citation2006a), as well as for hydrophobic non-spherical fractal-like particles (e.g., soot particles; Weingartner, Baltensperger, and Burtscher Citation1995; Tritscher et al. Citation2011).
In this work we report on measurements of the size distribution of UFPs emitted at a thermal spraying facility under real-world operating conditions. In addition, we use a Hygroscopic Tandem Differential Mobility Analyzer (HTDMA; Rader and McMurry Citation1986) to probe the hygroscopic behavior (i.e., the ability to take up water and restructure upon exposure to elevated water vapor concentrations), as well as the mixing state of the UFPs in the collected samples. Transmission electron microscopy (TEM) grids were used to sample the emitted particles in order to verify that they had irregular shapes at dry conditions and to determine their chemical composition (using Energy Dissipative X-ray Spectroscopy; EDX).
2. Experimental
Particle concentrations and hygroscopicities were monitored during thermal spraying at an industrial-scale precision engineering workshop (T.M. Comas, Blanes, Spain). The measurements were carried out over a 4-day period, and were representative of the usual operating conditions in the plant. Although data were collected and analyzed during the whole duration of the campaign, in this study only selected representative of the described thermal spraying processes are presented.
The facility has three thermal spraying booths located in an area of approximately 240 m2 (14 m wide and 17 m in length) that includes a central area and is described in detail elsewhere (Salmatonidis et al. Citation2019). Different spraying techniques were used in each of the booths (cf. Figure S1 in the online supplementary information [SI]), and the results presented in this work are from the spraying processes in booths #1 and #3.
Booth #1 housed an Atmospheric Plasma Spraying (APS) system, characterized by high temperatures (5–20 × 103 °C) and relatively low projection velocities (200–500 m/s), that was used to spray TiO2-Al2O3 or Cr-Ni powder blends with mean grain diameters of 36.0 and 76.5 µm, respectively. At the very high temperatures that are developed during APS, the feedstock is melted and driven through the formed jet toward the workpiece, i.e., the surface being coated (Pawlowski Citation2008). The metal vapors are oxidized by entrained air and condense in the cold zone of the jet (Fauchais, Vardelle, and Dussoubs Citation2001; Mauer, Vaßen, and Stöver Citation2011; Planche, Bolot, and Coddet Citation2003) between the plasma gun and the workpiece; a mechanism that results in nanoparticle formation (cf. Figure S2a). According to this mechanism, the primary nanoparticles emitted by APS should principally have spherical shapes as they mainly originate from condensation of gaseous or liquid precursors.
Figure 1. Example of inverted HTDMA measurements of particles having dry electrical mobility diameters of 30 (a) and 90 (b) nm, and their corresponding hygroscopic factor(s) at 87% RH, conducted in booth #3 when the door was open and no activity was taking place. Note that the 30-nm particles were internally mixed (i.e., unimodal distribution when exposed to 87% RH), while in contrast their 90-nm counterparts exhibited a wider distribution upon humidification in these measurements. This can be analyzed in two separate modes (indicating that they were externally mixed), thus having two hygroscopic factors (i.e., g1 and g2).
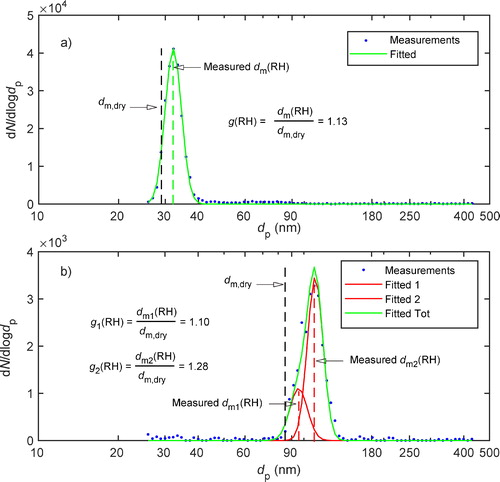
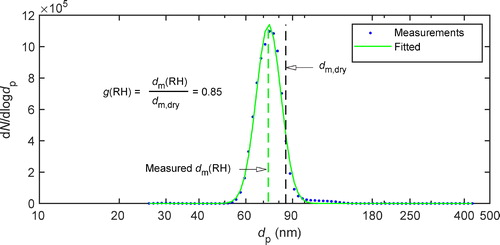
Figure 2. Example of an inverted HTDMA measurement of particles having a dry electrical mobility diameter of 90 nm, and their corresponding hygroscopic factor at 87% RH, carried out in booth #3 during thermal spraying. Note that in these measurements, the assumed 90-nm particles (i.e., determined based on the operational settings of DMA-1, assuming that the particles have a spherical shape) exhibited a unimodal distribution (i.e., internally mixed) when exposed to 87% RH, with a hygroscopic factor <1.0. The latter is a clear indication of hydrophobic particles with irregular shape that undergo restructuring upon humidification at 87% RH.
The other spraying booth (Booth #3, cf. ) housed a High Velocity Oxy-Fuel (HVOF) coating spraying system, characterized by high spraying velocities (425–1500 m/s) and lower temperatures (2.9 × 10³ °C), in which a WC-Cr3C2-Ni powder blend (mean grain diameter of 34 µm) was used as feedstock. During HVOF spraying, feedstock particles with high kinetic energies are sprayed onto the metal surface of the workpiece. In this case the feedstock material is not entirely melted as the temperatures are relatively lower, and it is driven with supersonic speeds toward the workpiece (Pawlowski Citation2008). Microscaled particles are in a solid-liquid two-phase droplet state when impacting on their target, and thus are flattened during deposition (Li et al. Citation2004). Consequently, particles emitted from the HVOF system are expected to have irregular shapes (cf. ). An additional emission route of submicron particles could be fugitive streams containing particles that would not be deposited on the substrate as they would simply disperse inside the booth (Li and Christofides Citation2006).
2.1. Monitoring locations and instrumentation
Particle concentrations, size distributions and hygroscopicities were monitored inside two spraying booths (#1 and #3), where workers used respiratory protective equipment. The temperature of the air sampled throughout the campaign was in the range of 20–25 °C. The following particle monitoring instrumentation was deployed:
A custom-made HTDMA system (cf. Figure S3 in the SI) was used to measure the hygroscopicity of the sampled particles. The instrument consisted of two custom-made Differential Mobility Analyzers (DMAs; Knutson and Whitby Citation1975) and a Condensation Particle Counter (CPC; TSI 3010 CPC; Agarwal and Sem Citation1980). The first DMA (DMA-1) of the system was used for selecting nearly monodisperse dried particles, which were then exposed to elevated RH conditions before their size distribution was measured by the second DMA (DMA-2) and the CPC (cf. more details in SI). A silica gel diffusion drier was employed upstream DMA-1 of the HTDMA in order to secure that all selected particles are in dry conditions, maintaining the RH below 30%. The system was operated with sheath and aerosol flow rates of 3.0 and 0.3 L/min, respectively, and for both of them the RH was controlled to 87% in order to avoid RH non-uniformities through the systems that can lead to experimental artifacts (cf. SI; Biskos et al. Citation2006b; Bezantakos et al. Citation2016). The sampling time of the instrument was 180 s, and the voltage of DMA-1 was changed every 6 min (i.e., every two sampling periods) in order to sequentially select particles having dry electrical mobility diameters of either 30 or 90 nm. These sizes were selected as they reside to the most commonly observed size range of particles emitted during thermal plasma spraying processes (i.e., Mode26-90; cf. Salmatonidis et al. Citation2019), while differing by a factor of 3 (i.e., in terms of size), thus enhancing the probability of observing any potential size-related differences. The instrument was deployed in the worker area, sampling directly from spraying booths #1 and #3, except from a short period of ca. 2 h before the end of the campaign during which it sampled from the central area outside booth #3.
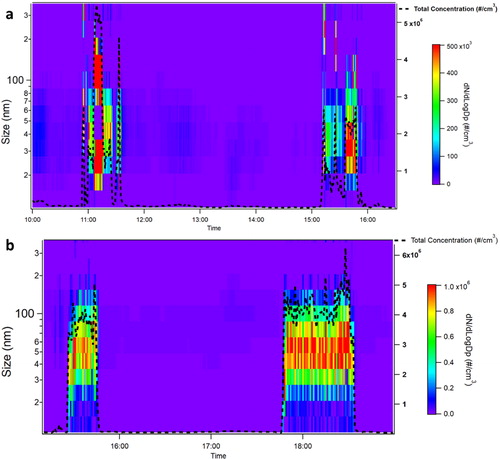
Figure 3. Evolution of the particle number size distributions: (a) inside booth #1 (APS) and (b) inside booth #3 (HVOF). Total particle number concentrations (dashed black curve) and the corresponding size distributions (NanoScan-SMPS) are shown for both processes.
A NanoScan Scanning Mobility Particle Sizer (NanoScan-SMPS; TSI Model 3910), was used to measure the particle size distribution (10–420 nm) in 13 channels with a 1-min time resolution. Similarly to the HTDMA, the NanoScan-SMPS was in the worker area but was sampling inside the spraying booths through 3-m long conductive tubing inlets. The NanoScan-SMPS raw data were converted to number-based mobility particle size distributions using the Multi-Instrument Manager software (MIM; TSI). In addition, particle number concentrations (dN) reported by the instrument at each size channel (dp) were corrected, accounting for the diffusion losses in the sampling lines (Hinds 1999).
A particle sampling system comprising a cassette (SKC, inlet diameter 1/8 inch) housing transmission electron microscope (TEM) grids attached on filter support pads (25 mm in diameter), was used to collect particles for offline characterization. The system employed an SKC Leland pump that was operated at a flow of 5 L/min. The grids (Agar Scientific Quantifoil 200 Mesh Au) were analyzed offline for morphological and physicochemical particle characterization using a TEM (Jeol, JEM 1220, Tokyo, Japan) coupled with an Energy-Dispersive X-ray (EDX; Oxford Instruments) spectrometer, following a similar procedure with that described by Voliotis et al. (Citation2014). Samples were collected inside all the spraying booths, while TEM images were processed by version 1.52f of the “ImageJ”. In order to determine the size of particles from the TEM images, we had to assume that their shape was spherical. The diameter of a particle was defined as the larger distance of two antidiametric points on the surface of the particle connected by a straight line. The TEM was used to characterize the morphology and size of the emitted particles and not for deriving concentration factors.
2.2. Assessment of particles hygroscopicity, mixing state, and dynamic shape factor
The hygroscopic behavior of aerosol particles, sampled by the HTDMA and exposed to high RH conditions, can be expressed by their hygroscopic factor:
(1)
(1)
where dm(RH) and dm,dry are the geometric mean electrical mobility diameters of the sampled particles at the elevated RH (87%), measured by DMA-2 and the CPC, and at the dry state, determined as the electrical mobility diameter selected by DMA-1, respectively (cf. SI for more details). Dried, internally mixed particles sampled by the HTDMA and exposed to the elevated RH conditions in the humidifier of the system grow (or apparently may shrink) to the same sizes as a result of water uptake, exhibiting a unimodal size distribution when measured by DMA-2 and the CPC. On the other hand, externally mixed particles sampled by the system, may grow (or apparently shrink) to different sizes exhibiting either a wider unimodal or a bimodal size distribution in the measurements. To distinguish between internally and externally mixed aerosol particles sampled by the HTDMA we employed the “TDMAfit” algorithm (Bezantakos et al. Citation2013; McMurry and Stolzenburg Citation1989). and show example HTDMA measurements and derived g(87%) values.
The factor g is greater than unity when the particles grow upon exposure to the elevated RH conditions or less than unity when they exhibit apparent shrinking. Irregularly shaped and hydrophobic particles exposed to elevated RH (87%) in the HTDMA will most likely appear to shrink, having g(RH) < 1 (cf. ). The reason for this behavior is that in the calculation of g(RH), the two electrical mobility diameters (i.e., dm(RH) and dm,dry) correspond to spherical particles (cf. Equations S1–S3 in the SI). However, the drag force acting upon a migrating irregularly shaped particle during classification in the DMA is higher than that of a spherical particle having the same volume, making them to be classified under stronger electric fields within the classifier compared to their compacted/restructured counterparts. Potential uncertainties in the measured growth factors due to differences in the charging efficiency between spherical and irregular-shaped particles are negligible in these sizes ranges (Marick Citation2008), and thus have been neglected in our analysis.
The dynamic shape factor of the particles sampled by the HTDMA can be derived by comparing the mobility diameter of the irregularly shaped particles selected by DMA-1 to that of the restructured particles (i.e., measured by DMA-2), assuming that their electrical mobility diameter is equal to their volume equivalent diameter (i.e., assuming that they are spheres; dm(RH) = dve), as follows:
(2)
(2)
Here Cc(dm(RH)) and Cc(dm,dry) denote the Cunningham slip correction factors that should be calculated using Equation (S3) in the SI, corresponding respectively to the electrical mobility diameter of the particles after humidification (i.e., dm(RH); measured by DMA-2 of the HTDMA) and at dry conditions (i.e., dm,dry; selected by DMA-1 of the HTDMA).
3. Results and discussion
3.1. Particle number concentration and mean diameters
show time series of particle number concentrations and size distributions measured inside booths #1 (APS) and #3 (HVOF), respectively. The observed patterns reflect the particle emissions during the morning shift, a break for lunch (no activity), and finally the afternoon shift. Particle number concentrations showed a high temporal variability and reached concentrations higher than 106 cm−3 as measured by the NanoScan-SMPS. These high concentrations may cause an underestimation of the particle number concentration as a result of ion depletion by the sampled particles in the corona charger of the NanoScan-SMPS. However, the effects on the sizing performance of the instrument are negligible, as indicated by the very similar particle sizes measured with the NanoScan-SMPS when sampling outside the spraying booths, where the number concentration was at least an order of magnitude lower (i.e., 105 cm−3; Salmatonidis et al. Citation2019).
In all cases, emissions from the spraying processes yielded particle number concentrations that were significantly higher compared to those in the background air, which were in the order of 104 cm−3. The variability in particle concentrations and sizes is the result of numerous factors such as fluctuations in the process (different spraying conditions, variations of the feedstock, etc.), opening/closing of doors (effecting air exchange inside the booths and consequently the physical mechanisms leading to particle growth), and worker movement inside the booth (also impacting air flows), among others.
The size distribution patterns were moderately irregular in booth #1 (cf. ), with three peaks (one between 30 and 40 nm, one between 25 and 100 nm, and one from 100 to 200 nm) and total concentrations up to 5 × 106 cm−3 being observed during the first spraying operation (, min 20–70). During the second repetition, the total particle concentration was lower (ca. 2.5 × 106 cm−3), while the mean particle diameter ranged between 40 and 100 nm. In booth #3, total particle number concentrations reached ca. 5 × 106 cm−3 in each repetition, with their mean diameters being in the range of 40–80 nm (cf. ). The emission patterns, especially in booth #3, were comparable across the different repetitions of the spraying process. Variation of the emissions patterns observed during spraying in booth #1 were attributed to the sequence of the activities followed in this process (Salmatonidis et al. Citation2019), where different feedstock materials were used to create different layers of coatings on the same workpiece. Process parameters and feedstock used during spraying in booth #3 were undifferentiated over the repetitions, resulting in more uniform emission patterns.
3.2. Modal analysis of particle emissions
The recorded particle size distribution measurements were split in three modes: Mode10–25nm (particles with diameters from 10 to 25 nm), Mode26–90nm (particles with diameters from 26 to 90 nm) and Mode91–660nm (particles from 91 to 660 nm), following the approach applied elsewhere (Salmatonidis et al. Citation2019). The algorithm for modal analysis uses a non-linear least square fitting, based on the interior-reflective Newton method (Coleman and Li Citation1996, Citation1994). The three fitted lognormal curves and their parameters were calculated following the same assumptions and conditions suggested by Hussein et al. (Citation2005). The NanoScan-SMPS measurements were expressed as dN/dLogdp distributions before applying the modal analysis.
shows the modal analysis results for particles emitted inside booth #1. During the morning session (), Mode26–90nm was slightly more dominant compared to Mode91–660nm, and together they comprised the majority of the emitted particles (94%). Mode26–90nm was dominant, accounting for 65% of the total particle number concentration, during the afternoon session (), while Mode91–660nm accounted for only 32% of the total particle number concentration. Their combined contribution still included the vast majority of the particles (97%), similarly to the morning session. The differences in the particle distributions recorded in the morning and in the afternoon sessions can be attributed to the different feedstock materials that were used in each case. During the afternoon brake (i.e., no activities taking place in the workplace; cf. ) Mode26–90nm dominated the particle size distribution but with significantly reduced number concentrations, compared to the plasma activity periods. In booth #3 (HVOF), the modal contributions are similar for the two different repetitions of the process (). Mode26–90nm was dominant accounting for 77 to 89% of the total particle number concentration, while the contribution of Mode91–660nm ranged from 16 to 8%. The contribution of Mode10–25nm (which includes particles formed by nucleation) was the lowest for all of the cases in terms of particle number emissions.
Figure 4. Modal analysis results for particles emitted inside booth #1 (a–c) and inside booth #3 (d, e). The time intervals (a, c and d, e) represent different repetitions of each thermal spraying process, for comparison one afternoon break interval (i.e., no activity period) is also marked (b). The numbers in the pie plots depict the average number concentration of each mode (in #/cm3), while the percentages (i.e., in parenthesis) provide the average fraction of the number concentration of each mode in respect to the total number concentration of particles.
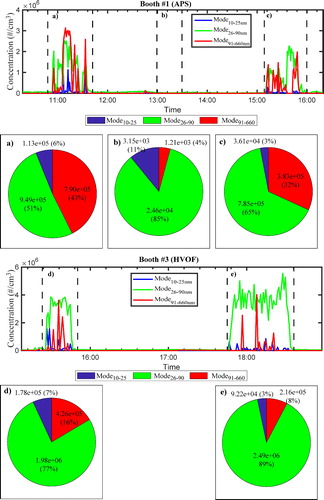
Mode26–90nm was dominant in both processes (APS and HVOF) for particles inside the spraying booths. Similar results were obtained in a previous work for particles transported from the booths to the worker area (Salmatonidis et al. Citation2019). These similarities are especially relevant from an exposure perspective, and show that the workers outside the booths wearing no personal protective equipment (PPE) were exposed to particles of similar sizes and chemical compositions as those operating inside the booths (where PPE was used).
3.3. Particle hygroscopicity and mixing state
and show aggregated results of the measured hygroscopic factors of particles having dry electrical mobility diameters of 30 and 90 nm, respectively, during thermal spraying as the HTDMA was sampling from within booth #1, #3, as well as outside booth #3. Particles were classified as hydrophobic/less hygroscopic (HP) having g(87%) ≤ 1.15, or as more hygroscopic (HS) with g(87%) > 1.15. It should be noted that the threshold value of 1.15 is used here, following studies reporting hygroscopicity measurements from field observations (Swietlicki et al. Citation2008). The median values of the relative number fractions of HP or HS particles are in addition depicted in and , indicating the dominant mode (i.e., HP or HS). Time series of all hygroscopicity measurements are provided in SI (cf. ). The hygroscopic factors g(87%) of the 90-nm particles during non-activity hours (i.e., background aerosols; cf. ) are clustered between 1.07 and 1.13 for the HP mode and at approximately 1.23 for the HS mode, being representative of urban background measurements (Swietlicki et al. Citation2008). During these periods, the sampled aerosol is externally mixed with HP particles being much more dominant. This is indicative of an area affected by both nearby and distant aerosol sources. The combination of the low concentrations of 30-nm particles during non-working hours (), together with the relatively increased particle losses inside the HTDMA, is responsible for the absence of the respective results during the non-activity periods (). In contrast, during working hours, the signal of the HTDMA becomes strong when sampling 30-nm aerosols (cf. and ), indicating a higher fraction of locally produced nano-scaled aerosol particles.
Figure 5. Aggregated hygroscopic factor measurements (a) and median values of the relative number fraction of each hygroscopic mode (b) of particles having electrical mobility diameters of 30 nm sampled with the HTDMA when the processes in booth #1 (APS) and booth #3 (HVOF) were active. Results are also shown when booth #3 was active but the HTDMA sampled from the storage area outside booth #3 (SA). Particles exhibiting hygroscopic factors below 1.15 (hydrophobic/less hygroscopic; HP) are denoted with a different color (i.e., blue) than the more hygroscopic ones (i.e., hygroscopic factor > 1.15; HS). The dotted circles denote the median values of each hygroscopic mode, whereas the range and the 25th and 75th percentiles are depicted with narrow and wide solid lines, respectively.
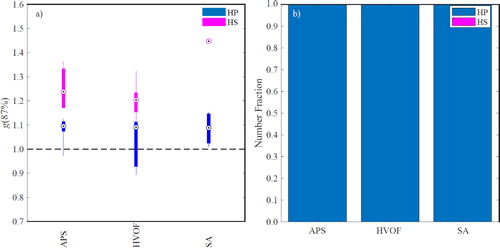
Figure 6. Aggregated hygroscopic factor measurements (a) and median values of the relative number fraction of each hygroscopic mode (b) of particles having electrical mobility diameters of 90-nm that were sampled by the HTDMA when the processes in booth #1 (APS) and booth #3 (HVOF) were active. Results are also shown when booth #3 was active but the HTDMA sampled from the storage area outside booth #3 (SA). Particles exhibiting hygroscopic factors below 1.15 (hydrophobic/less hygroscopic; HP) are denoted with a different color (i.e., blue) than the more hygroscopic ones (i.e., hygroscopic factor >1.15; HS). The dotted circles denote the median values of each hygroscopic mode, whereas the range and 25th and 75th percentiles are depicted with narrow and wide solid lines, respectively.
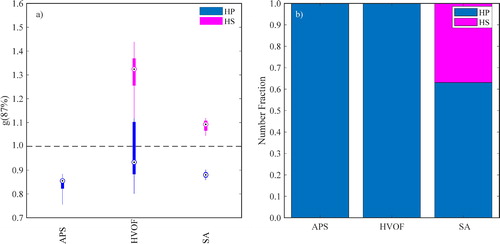
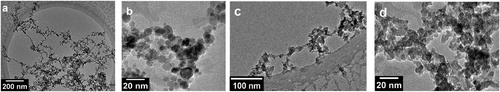
Figure 7. TEM images of the particles emitted during APS in booth #1 (a, b), and during HVOF in booth #3 (c, d).
During non-activity periods (unshaded areas in and ), an externally mixed aerosol for ca. 45% of the cases for the 30-nm particles and ca. 76% for the 90-nm particles was observed. The lower occurrence of the externally mixed samples with 30-nm dry particles can be attributed to the fact that those are produced locally (i.e., in the workshop). As expected, freshly emitted particles, exhibited almost common hygroscopicities. During periods of spraying activities both the 30- and 90-nm particles exhibited a behavior indicating internally mixed particles, with the HP mode being dominant, as the median number fractions indicate (cf. bar plots in and ). These cases should not be interpreted as a total absence of background aerosols but as a result of the significantly high process-generated nanoparticle emissions. These were up to 3 orders of magnitude higher when compared to the background and dominated the sample (cf. ).
The most striking observation during the spraying activity periods was that the hygroscopic factor of the sampled aerosol particles was in many cases lower than unity, indicating that the particles undergo shape transformation within the HTDMA upon humidification, similarly to the observations of Tritscher et al. (Citation2011) and Weingartner, Baltensperger, and Burtscher (Citation1995) for irregularly shaped aerosols. This observation is much more pronounced for the 90-nm dry particles sampled by the HTDMA (i.e., median g(87%) values of HP mode < 1.0; cf. ), suggesting that their shape departs much more from that of a compact sphere compared to the 30-nm particles. Towards the end of the measurements, when the HTDMA was sampling outside booth #3 (i.e., central area) and the spraying system in that booth was operational (cf. and ), the sampled aerosol was externally mixed, due to the dilution of process emitted particles (i.e., reducing their number concentrations), allowing the detection of background particles, as well. This was more pronounced for the 90-nm particles, which in all samples exhibited two hygroscopic modes, with the first having g(87%) values < 1.0 (i.e., indicative of particles originating from the HVOF process), comprising ca. 60% of the total population. Aggregated results of the dynamic shape factors estimated for the particles emitted by both booths during thermal spraying are provided in .
Table 1. Results showing the average and standard deviation (where applicable) of the estimated dynamic shape factor χ of the irregularly shaped particles (i.e., g(87%) < 1.0).
The hygroscopicity measurements showed that UFPs having dry electrical mobility diameters of 30 nm that are produced by the APS, exhibited on average some water uptake when exposed to 87% RH (i.e., less hygroscopic; cf. ). Upon inhalation, these particles will grow, due to the high RH in the human respiratory system (i.e., ca. 99% RH) by ca. 28%, reaching sizes of approx. 38.5 nm (cf. SI for the calculation). On the other hand, their 90-nm counterparts were characterized as hydrophobic, clearly exhibited irregular shapes and restructuring upon humidification (i.e., exhibiting hygroscopic factors with median values less than unity; cf. ). Assuming that the 90-nm UFPs underwent a complete restructuring upon humidification, they will exhibit volume equivalent diameters of approx. 70 nm (i.e., having dynamic shape factors of 1.38; cf. ). The 30-nm particles sampled from the HVOF exhibited in most of the cases some water uptake (i.e., less hygroscopic), while some of them exhibited hygroscopic growth factor values that were less than unity. On the other hand their 90-nm counterparts had hygroscopic factors less than unity in the majority of cases, suggesting that those were hydrophobic particles undergoing a restructuring upon humidification. Considering that the irregularly shaped particles were completely restructured when humidified at 87% RH (i.e., operating RH of the HTDMA), we can assume that their volume equivalent diameters upon inhalation will be on average ca. 26 and 74 nm, for the 30- and 90-nm dry particles, respectively. It is expected that the deposition behavior of these UFPs inside the human respiratory tract will differ from those estimated if their hygroscopic behavior is not taken into account (i.e., by using only size distribution measurements, neglecting their hygroscopic restructuring). Although a detailed analysis of the deposition efficiencies of these particles in the human respiratory system is beyond the scope of this article, the additional information on particle restructuring (i.e., size/shape change) upon humidification, which will also take place upon inhalation, can be therefore used for calculating their aerodynamic diameters more accurately (Hinds 1999).
Based on our results, the HTDMA can be used for distinguishing in-situ, thermal spraying process-generated UFPs, as their hygroscopic properties differ from those of background particles (i.e., significantly lower g(87%) values and shape change upon humidification). The ability of the HTDMA to distinguish the specific process-generated UFPs is not compromised by the existence of background aerosols as demonstrated by the measurements conducted outside booth #3 (HVOF), where both aerosol populations are identified (i.e., process-emitted and background UFPs; cf. ). In addition, based on the ability of the HTDMA to provide quantitative information on the particle number concentration fraction residing in each population (i.e., background vs. process-generated UFPs), it can be used to complement particle distribution measurements for calculating the number concentration of particles in each category. The above mentioned capabilities of the HTDMA allow the in situ and near-real-time identification of fugitive, process-generated UFPs. However, a limiting factor of existing HTDMA systems is their bulk size; despite that the HTDMA used in this work was mobile, a few days of sampling were needed for covering the whole area of the manufacturing workshop, under all conditions. It should be noted here that in contrast to other aerosol instrumentation used in exposure studies, the HTDMA is so far limited in conducted long-term, unattended atmospheric observations in static locations (i.e., urban and/or remote atmospheric stations), thus no need of reducing its dimensions and increasing its portability exist. Future works should address the need of a highly portable HTDMA, for use in exposure studies, in order to address the above mentioned limitation.
3.4. TEM analysis
TEM images of particles collected inside booth #1 are shown in . Chain fractal-like particles with different sizes and numbers of primary particles were observed across the TEM grid. As a result, only the size of the primary particles forming the fractal-like particles can be obtained. Spherical or spheroid shape of primary particles, ranging from 5 to 20 nm, can be observed in the TEM images of fractal-like particles produced in booth #1 (), and their composition was found to be similar to that of the feedstock material (cf. Figure S8a).
TEM images of particles sampled inside booth #3 during spraying are shown in . Irregularly shaped primary particles appear to be strongly bonded, indicating that they have undergone mild sintering, and therefore it becomes challenging to distinguish them even in the higher TEM magnification (). This could also be an indication that these irregularly shaped particles have formed by agglomeration through high energy collisions due to hypersonic impactions. The chemical composition of the particles emitted was similar to that of the micron-sized feedstock used (Figure S8b); confirming that thermal spraying was their source.
4. Conclusions
High concentrations of process-generated ultrafine particles (UFPs), which were often higher than 106 cm−3, were monitored in an industrial workplace setting during thermal spraying inside the process operation booths of the studied facility. Emission patterns were irregular in the case of the Atmospheric Plasma Spraying (APS) and more uniform during High Velocity Oxy-Fuel (HVOF). Modal analysis of the emissions showed that the majority of the emitted UFPs were in the size range of 20 to 100 nm, regardless of the process and the operating conditions. Particles were emitted inside the spraying booths where workers were equipped with respiratory protective equipment, but they also impacted the area where workers were not equipped with respiratory protective equipment.
Measurements of the hygroscopicity and mixing state of the sampled aerosol were also carried out to provide complementary information on the UFPs in the breathing air of the facility, as well as a means to distinguish between process-generated and background aerosols. Particles originating from thermal spraying that had a size of 30 nm exhibited hygroscopicities which did not differ significantly from those of other aerosol particles sampled when thermal spraying was not operational. However, taking into account that 30-nm particles were observed by the HTDMA only during working hours, their presence has to be attributed to processes taking place inside the workshop. The shape of these particles was closer to that of a sphere, while based on their measured hygroscopicities they are expected to grow in size by ca. 28% upon inhalation (i.e., at 99% RH). On the other hand, 90-nm process-generated particles were hydrophobic at 87% RH and underwent a more significant shrinkage upon humidification (i.e., exhibiting hygroscopic growth factors that were less than unity). This allowed to clearly distinguish them from other particles of the same dry size that were present in the workplace. In addition, it is expected that the deposition efficiencies of the 90-nm irregularly shaped particles in the human respiratory system, will be different than that estimated when not accounting for their restructuring (i.e., based only in electrical mobility measurements of their size and assuming spherical particles), as their size and shape will change upon inhalation (i.e., ca. 99% RH). The additional information provided by the HTDMA can complement existing methods used for an accurate assessment of the health effects associated to process-generated UFPs. Changes in their size and shape upon inhalation can impact on other properties, such as their lung deposition surface area, while changing their deposition patterns inside the human respiratory system. This information underlines the importance of including hygroscopicity measurements on exposure studies, and motivates the need of increasing the portability of HTDMAs to facilitate their employment in workplaces.
TEM/EDX analysis showed that fractal-like particles were dominant in samples collected from both processes at dry conditions, exhibiting different shapes and sizes, thereby, validating the HTDMA observations. This analysis also confirmed that process-generated aerosols had the same composition as the feedstock material, verifying that thermal spraying (APS, HVOF) was the dominant UFP source in the breathing air at the facility.
Supplemental Material
Download ()Acknowledgments
The authors kindly acknowledge TM COMAS (http://www.tmcomas.com) for their committed cooperation.
Additional information
Funding
References
- Agarwal, J. K., and G. J. Sem. 1980. Continuous flow, single-particle-counting condensation nucleus counter. J. Aerosol Sci. 11 (4):343–57. doi:10.1016/0021-8502(80)90042-7.
- Anselm, A., T. Heibel, J. Gebhart, G. Ferron, and P. Inhalation. 1990. “In vivo” studies of growth factors of sodium chloride particles in the human respiratory tract. J. Aerosol Sci. 21:427–30.
- Asbach, C., C. Alexander, S. Clavaguera, D. Dahmann, H. Dozol, B. Faure, M. Fierz, L. Fontana, I. Iavicoli, H. Kaminski, et al. 2017. Review of measurement techniques and methods for assessing personal exposure to airborne nanomaterials in workplaces. Sci. Total Environ. 603-604:793–806. doi:10.1016/j.scitotenv.2017.03.049.
- Asbach, C., S. Clavaguera, and A. M. Todea. 2016. Measurement methods for nanoparticles in indoor and outdoor air. In Indoor and outdoor nanoparticles: Determinants of release and exposure scenarios, ed. M. Viana, 19–49. Cham: Springer International Publishing. doi:10.1007/698_2015_423.
- Bezantakos, S., K. Barmpounis, M. Giamarelou, E. Bossioli, M. Tombrou, N. Mihalopoulos, K. Eleftheriadis, J. Kalogiros, J. D. Allan, A. Bacak, et al. 2013. Chemical composition and hygroscopic properties of aerosol particles over the Aegean Sea. Atmos. Chem. Phys. 13 (22):11595–608. doi:10.5194/acp-13-11595-2013.
- Bezantakos, S., L. Huang, K. Barmpounis, S. T. Martin, and G. Biskos. 2016. Relative humidity non-uniformities in hygroscopic tandem differential mobility analyzer measurements. J. Aerosol Sci. 101:1–9. doi:10.1016/j.jaerosci.2016.07.004.
- Biskos, G., D. Paulsen, L. M. Russell, P. R. Buseck, and S. T. Martin. 2006b. Prompt deliquescence and efflorecence of aerosol nanoparticles. Atmos. Chem. Phys. 6 (12):4633–42. doi:10.5194/acp-6-4633-2006.
- Biskos, G., L. M. Russell, P. R. Buseck, and S. T. Martin. 2006a. Nanosize effect on the hygroscopic growth factor of aerosol particles. Geophys. Res. Lett. 33 (7):2–5. doi:10.1029/2005GL025199.
- Ching, J., and M. Kajino. 2018. Aerosol mixing state matters for particles deposition in human respiratory system. Sci. Rep. 8 (1):8864. doi:10.1038/s41598-018-27156-z.
- Coleman, T. F., and Y. Li. 1994. On the convergence of interior-reflective Newton methods for nonlinear minimization subject to bounds. Math. Program. 67 (1-3):189–224. doi:10.1007/BF01582221.
- Coleman, T. F., and Y. Li. 1996. An interior trust region approach for nonlinear minimization subject to bounds. SIAM J. Optim. 6 (2):418–45. doi:10.1137/0806023.
- Dahmann, D. 2016. Exposure assessment: Methods. In Indoor and outdoor nanoparticles: Determinants of release and exposure scenarios, ed. M. Viana, 51–72. Cham: Springer International Publishing. doi:10.1007/698_2015_436.
- Fauchais, P., A. Vardelle, and B. Dussoubs. 2001. Quo Vadis thermal spraying? J. Therm. Spray Technol. 10 (1):44–66. doi:10.1361/105996301770349510.
- Ferron, G. A., W. G. Kreyling, and B. Haider. 1988. Inhalation of salt aerosol particles - II. Growth and deposition in the human respiratory tract. J. Aerosol Sci., 19:611–31.
- Fonseca, A. S., A. Maragkidou, M. Viana, X. Querol, K. Hämeri, I. de Francisco, C. Estepa, C. Borrell, V. Lennikov, and G. F. de la Fuente. 2016. Process-generated nanoparticles from ceramic tile sintering: Emissions, exposure and environmental release. Sci. Total Environ. 565:922–32. doi:10.1016/j.scitotenv.2016.01.106.
- Fonseca, A. S., M. Viana, X. Querol, N. Moreno, I. de Francisco, C. Estepa, and G. F. de la Fuente. 2015. Ultrafine and nanoparticle formation and emission mechanisms during laser processing of ceramic materials. J. Aerosol Sci. 88:48–57. doi:10.1016/j.jaerosci.2015.05.013.
- Gakidou, E., A. Afshin, A. A. Abajobir, K. H. Abate, C. Abbafati, K. M. Abbas, F. Abd-Allah, A. M. Abdulle, S. F. Abera, V. Aboyans, et al. 2017. Global, regional, and national comparative risk assessment of 84 behavioural, environmental and occupational, and metabolic risks or clusters of risks, 1990–2016: A systematic analysis for the Global Burden of Disease Study 2016. Lancet 390 (10100):1345–422. doi:10.1016/S0140-6736(17)32366-8.
- Ganguly, P., A. Breen, and S. C. Pillai. 2018. Toxicity of nanomaterials: Exposure, pathways, assessment, and recent advances. ACS Biomater. Sci. Eng. 4 (7):2237–75. doi:10.1021/acsbiomaterials.8b00068.
- Hinds, W. C. 1999. Aerosol Technology: Properties, Behavior, and Measurement of Airborne Particles. 2nd ed., John Willey & Sons, Inc., New York, USA.
- Hussein, T., M. Maso, T. Petäjä, I. Koponen, P. Paatero, P. Aalto, K. Hämeri, and M. Kulmala. 2005. Evaluation of an automatic algorithm for fitting the particle number size distributions. Boreal Environ. Res 10:337–55.
- Kalantzi, O., and G. Biskos. 2014. Methods for assessing basic particle properties and cytotoxicity of engineered nanaparticles. Toxics 2 (1):79–91. doi:10.3390/toxics2010079.
- Knutson, E. O., and K. T. Whitby. 1975. Aerosol classification by electric mobility: apparatus, theory, and applications. J. Aerosol Sci. 6 (6):443–51. doi:10.1016/0021-8502(75)90060-9.
- Krämer, L., U. Pöschl, and R. Niessner. 2000. Microstructural rearrangement of sodium chloride condensation aerosol particles on interaction with water vapor. J. Aerosol Sci. 31 (6):673–85. doi:10.1016/S0021-8502(99)00551-0.
- Kuhlbusch, T. A. J., C. Asbach, H. Fissan, D. Göhler, and M. Stintz. 2011. Nanoparticle exposure at nanotechnology workplaces: A review. Part. Fibre Toxicol. 8:22–18. doi:10.1186/1743-8977-8-22.
- Kuhlbusch, T. A. J., A. C. John, and U. Quass. 2009. Sources and source contributions to fine particles. Biomarkers 14 (sup1):23–8. doi:10.1080/13547500902965377.
- Landrigan, P. J. 2017. Air pollution and health. Lancet Public Heal 2 (1):e4–e5. doi:10.1016/S2468-2667(16)30023-8.
- Li, C.-J., Y.-Y. Wang, G.-J. Yang, A. Ohmori, and K. A. Khor. 2004. Effect of solid carbide particle size on deposition behaviour, microstructure and wear performance of HVOF cermet coatings. Mater. Sci. Technol. 20 (9):1087–96. doi:10.1179/026708304225019722.
- Li, M., and P. D. Christofides. 2006. Computational study of particle in-flight behavior in the HVOF thermal spray process. Chem. Eng. Sci. 61 (19):6540–52. doi:10.1016/j.ces.2006.05.050.
- Limbach, L. K., P. Wick, P. Manser, R. N. Grass, A. Bruinink, and W. J. Stark. 2007. Exposure of engineered nanoparticles to human lung epithelial cells: Influence of chemical composition and catalytic activity on oxidative stress. Environ. Sci. Technol. 41 (11):4158–63. doi:10.1021/es062629t.
- Löndahl, J., A. Massling, J. Pagels, E. Swietlicki, E. Vaclavik, and S. Loft. 2007. Size-resolved respiratory-tract deposition of fine and ultrafine hydrophobic and hygroscopic aerosol particles during rest and exercise. Inhal. Toxicol. 19 (2):109–16. doi:10.1080/08958370601051677.
- Marick, M. M. 2008. Bipolar diffusion charging of soot aggregates. Aerosol Sci. Technol. 42:247–54.
- Mauer, G., R. Vaßen, and D. Stöver. 2011. Plasma and particle temperature measurements in thermal spray: Approaches and applications. J. Therm. Spray Tech. 20 (3):391–406. doi:10.1007/s11666-010-9603-z.
- McMurry, P. H., and M. R. Stolzenburg. 1989. On the sensitivity of particle size to relative humidity for Los Angeles aerosols. Atmos. Environ. 23 (2):497–507. doi:10.1016/0004-6981(89)90593-3.
- Oberdörster, G. 2001. Pulmonary effects of inhaled ultrafine particles. Int. Arch. Occup. Environ. Health 74:1–8. doi:10.1007/s004200000185.
- OECD. 2015. Harmonized tiered approach to measure and assess the potential exposure to airborne emissions of engineered nano-objects and their agglomerates and aggregates at workplaces. Ser. Saf. Manuf. Nanomater. 55:JT03378848.
- Ono-Ogasawara, M., F. Serita, and M. Takaya. 2009. Distinguishing nanomaterial particles from background airborne particulate matter for quantitative exposure assessment. J. Nanopart. Res. 11 (7):1651–9. doi:10.1007/s11051-009-9703-1.
- Pawlowski, L. 2008. The science and engineering of thermal spray coatings. 2nd ed., John Wiley & Sons Ltd., The Atrium, Southern Gate, Chichester, West Sussex, England. doi:10.1002/9780470754085.
- Peters, T. M., S. Elzey, R. Johnson, H. Park, V. H. Grassian, T. Maher, and P. O'Shaughnessy. 2008. Airborne monitoring to distinguish engineered nanomaterials from incidental particles for environmental health and safety. J. Occup. Environ. Hyg. 6 (2):73–81. doi:10.1080/15459620802590058.
- Pietroiusti, A., H. Stockmann-Juvala, F. Lucaroni, and K. Savolainen. 2018. Nanomaterial exposure, toxicity, and impact on human health. Wiley Interdiscip. Rev. Nanomed. Nanobiotechnol., 10:e1513., 1–21. doi:10.1002/wnan.1513.
- Planche, M. P., R. Bolot, and C. Coddet. 2003. In-flight characteristics of plasma sprayed alumina particles: Measurements, modeling, and comparison. J. Therm. Spray Technol. 12 (1):101–11. doi:10.1361/105996303770348555.
- Rader, D. J., and P. H. McMurry. 1986. Application of the tandem differential mobility analyzer to studies of droplet growth or evaporation. J. Aerosol Sci. 17 (5):771–87. doi:10.1016/0021-8502(86)90031-5.
- Salmatonidis, A., C. Ribalta, V. Sanfélix, S. Bezantakos, G. Biskos, A. Vulpoi, S. Simion, E. Monfort, and M. Viana. 2019. Workplace exposure to nanoparticles during thermal spraying of ceramic coatings. Ann. Work Expo. Health. 63 (1):91–106. doi:10.1093/annweh/wxy094.
- Salmatonidis, A., M. Viana, N. Pérez, A. Alastuey, G. F. de la Fuente, L. A. Angurel, V. Sanfélix, and E. Monfort. 2018. Nanoparticle formation and emission during laser ablation of ceramic tiles. J. Aerosol Sci. 126:152–68. doi:10.1016/j.jaerosci.2018.09.006.
- Schill, A. L., and L. C. Chosewood. 2013. The NIOSH total worker health program: An overview. J. Occup. Environ. Med. 55:10–3. doi:10.1097/JOM.0000000000000037.
- Song, Y., X. Li, and X. Du. 2009. Exposure to nanoparticles is related to pleural effusion, pulmonary fibrosis and granuloma. Eur. Respir. J. 34 (3):559–67. doi:10.1183/09031936.00178308.
- Swietlicki, E., H. C. Hansson, K. Hämeri, B. Svenningsson, A. Massling, G. Mcfiggans, P. H. Mcmurry, T. Petäjä, P. Tunved, M. Gysel, et al. 2008. Hygroscopic properties of submicrometer atmospheric aerosol particles measured with H-TDMA instruments in various environments - A review. Tellus Ser. B Chem. Phys. Meteorol. 60 (3):432–69. doi:10.1111/j.1600-0889.2008.00350.x.
- Tritscher, T., Z. Jurányi, M. Martin, R. Chirico, M. Gysel, M. F. Heringa, P. F. DeCarlo, B. Sierau, A. S. H. Prévôt, E. Weingartner, et al. 2011. Changes of hygroscopicity and morphology during ageing of diesel soot. Environ. Res. Lett. 6 (3):034026. doi:10.1088/1748-9326/6/3/034026.
- van Broekhuizen, P. 2017. Applicability of provisional NRVs to PGNPs and FCNPs. Bureau KLB, Den Haag, The Netherlands. doi:10.13140/RG.2.2.18241.25445.
- Viitanen, A. K., S. Uuksulainen, A. J. Koivisto, K. Hämeri, and T. Kauppinen. 2017. Workplace Measurements of Ultrafine Particles-A Literature Review. Ann. Work Expo. Heal., 61:749–58.
- Voliotis, A., S. Bezantakos, M. Giamarelou, M. Valenti, P. Kumar, and G. Biskos. 2014. Nanoparticle emissions from traditional pottery manufacturing. Environ. Sci. Process. Impacts. 16 (6):1489–94. doi:10.1039/c3em00709j.
- Weingartner, E., U. Baltensperger, and H. Burtscher. 1995. Growth and structural change of combustion aerosols at high relative humidity. Environ. Sci. Technol. 29 (12):2982–6. doi:10.1021/es00012a014.
- World Health Organization. 2016. Ambient air pollution: A global assessment of exposure and burden of disease. World Health Organization, Geneva, Switzerland, 1–131. doi:9789241511353.
- Zhang, M., L. Jian, P. Bin, M. Xing, J. Lou, L. Cong, and H. Zou. 2013. Workplace exposure to nanoparticles from gas metal arc welding process. J. Nanoparticle Res. 15:1–14. doi:10.1007/s11051-013-2016-4.