
 ?Mathematical formulae have been encoded as MathML and are displayed in this HTML version using MathJax in order to improve their display. Uncheck the box to turn MathJax off. This feature requires Javascript. Click on a formula to zoom.
Abstract
Gasoline particulate filters (GPF) are being utilized in certain markets on gasoline direct injection (GDI) vehicles to reduce tailpipe particulate emissions as required by particle number regulations. GPF filtration efficiency is dependent on soot build-up within the filter. Since soot oxidizes within the GPF during normal vehicle operation, an understanding of soot reactivity is important for optimizing aftertreatment architecture and engine calibration. Past work has indicated that gasoline soot reactivity may depend on levels of metallic ash species. In this work, carbonaceous particulate matter from a GDI engine are evaluated from engine operation at a consistent speed and load but with different levels of fuel injection pressures and timings to vary the relative ash to soot ratio. Soot reactivity is found to vary significantly with the ratio of ash to soot present. Interestingly, the more reactive soots possess a unique oxidation profile by which a conventional Arrhenius type expression cannot be used to quantify reactivity. To understand the mechanisms driving such distinct oxidation differences, soot samples are analyzed after being partially oxidized. Particulate characteristics are evaluated by x-ray photoelectron spectroscopy (XPS), Raman spectroscopy, high-resolution transmission electron microscopy (HR-TEM), and scanning transmission electron microscopy with energy dispersive spectroscopy (STEM + EDS). A mechanism is proposed that may explain further why ash affects gasoline soot reactivity to the extent seen in this and other work.
Copyright © 2020 American Association for Aerosol Research
EDITOR:
1. Introduction
The use of gasoline direct injection systems (GDI) has been widely adopted by various automotive manufacturers for good reason. This technology enhances fuel efficiency and performance due to charge cooling and more precise fuel control when compared to its port fuel injection (PFI) counterpart (Eichlseder et al. Citation2000). However, the reduced time for fuel and air to mix and the impingement of fuel on piston tops and cylinder bore walls may cause an increase in particulate emissions. Concern over health effects from PM 2.5 and nanoparticles have led to particle number standards in Europe, China, and India. Gasoline particulate filters (GPF) are currently being used on all pure GDI vehicles (those that use only direct injection (DI) and not DI and PFI) in Europe to meet Euro 6d standards. Vehicles sold in China and India are expected to use GPFs on pure GDI vehicles to meet China 6a starting in 2020 and Bharat Stage 6 starting in 2023.
An understanding of gasoline soot reactivity is essential for effective implementation and protection of the GPF. Prior to the development of an ash layer along the walls of the GPF from lubrication additives and engine and catalyst wear materials, the state of soot build-up on the filter is essential for understanding variations in particulate filtration efficiency. A new filter, without a soot layer, may have a particle number filtration as low as 50%. However, as the soot layer builds, even to just a small amount, filtration efficiency is dramatically improved (Liu et al. Citation2018). This characteristic of low filtration efficiency when clean may require new engine controls to maintain a soot layer within the GPF, and these controls would require an understanding of soot reactivity and mechanisms influencing reactivity variation.
Active regeneration, by which the engine controller manipulates engine parameters to achieve soot oxidation in the GPF, possibly through changes in spark timing, valve timing, and fuel control, presents another reason that soot reactivity must be understood. GPFs are more porous and have thinner walls when compared to their diesel counter-parts, resulting in lower heat capacities and lower levels of allowable soot build-up before filter damage may occur during a regeneration (Johnson Citation2014). Under some conditions, gasoline filters may fill with soot to this allowable limit. The understanding of what that allowable limit may be and what the control strategy for regeneration should be to ensure protection of the filter from thermal damage is dependent on an understanding of soot reactivity magnitude and variation.
Past research with diesel soot has highlighted a variety of factors that may influence soot reactivity. The influence of nanoparticle structure on soot oxidation behavior has been studied by various groups and the findings indicate the oxidation behavior may be strongly influenced by the soot nanostructure (Vander Wal and Tomasek Citation2003). The more amorphous the soot is, the more likely for reactive carbon layer edge sites to undergo H-atom abstraction followed by molecular (acetylene) addition (Frenklach and Wang Citation1991), or to react with O2 or OH (Palmer and Cullis Citation1965). Likewise, long graphene layers found in graphitic soot often result in fewer of these potential reaction sites (Donnet Citation1982). Surface functional groups may also play some role in enhancing diesel soot oxidation. Past research suggests that bound oxygen in the form of carboxyl, lactone, and carbonyl groups may enhance soot reactivity as the energy required to oxidize some carbon to CO or CO2 is reduced (Keifer et al. Citation1981). According to other findings, functional groups may enhance the oxidation process through electron exchange (Boehm Citation1994). Ash content has also been found to play a role in enhancing diesel soot oxidation. Additives containing calcium, zinc, and sodium have been found to act as a catalyst for soot oxidation when in close contact, being directly involved with combustion (Seong and Boehman Citation2011; Neeft, Makkee, and Moulijn Citation1996a, Citation1996b).
Though much of the existing literature has focused on diesel applications, some recent research has focused on gasoline soot characteristics and reactivity (Barone et al. Citation2012; He, Ratcliff, and Zigler Citation2012; Szybist et al. Citation2011). Researchers have identified gasoline engines to produce far lower amounts of soot particles (Harris and Maricq Citation2001; Mathis, Mohr, and Forss Citation2005) and they have more immature and amorphous nanostructures relative to diesel soot particles, likely due to forming in low temperature regions (Farron et al. Citation2011; Seong, Lee, and Choi Citation2013).
Gasoline soot particles interestingly appear to be on average more reactive than diesel soot particles, likely due to their amorphous nature and higher ash-soot ratio (Choi and Seong Citation2016). A dominant factor in determining gasoline soot reactivity is the level of catalytic metallic ash species, such as those containing Ca and Zn (Choi and Seong Citation2015).
Though previous work has given valuable insight into understanding gasoline soot reactivity, a deeper level of understanding is missing. This work sets out to understand the oxidation process of gasoline derived soot and the interactions of ash and soot during the oxidation process in an attempt to understand in detail the way in which ash dominantly effects soot reactivity.
2. Experimental set-up
2.1. Engine set-up and operating conditions
For this work, a model year 2010 2.0 L GDI GM Ecotec LNF four-cylinder turbocharged engine was used. The direct injection system is side mounted and the fuel spray is wall guided. The oil used was Mobil 1 High Mileage Full Synthetic 5 W-30. The fuel used was a 93 AKI octane E10 pump fuel. Specifications for the fuel are given in the online supplemental information. Properties of interest in relation to soot production are the aromatic content (12.1% v/v) and the temperature at which 90% of the fuel is vaporized, T90 (164 °C).
The engine was operated at 1600 RPM and 8 bar Brake Mean Effective Pressure (BMEP). To maintain similar levels of oil consumption, speed and load were not changed, as oil consumption is speed and load dependent. Fuel injection pressure and injection timings were varied as these parameters have been shown in previous work to have the greatest impact on engine-out soot emissions from a GDI engine, with a given fuel (Su et al. Citation2014). Settings for injection timing and pressure are highlighted in .
Table 1. Fuel injection and pressure set points.
In many studies spark timing is advanced or retarded to provide optimal combustion phasing, which maximizes work extracted from the fuel. The optimal spark timing depends on the rate at which combustion occurs, and this combustion rate is impacted by fuel and air mixing conditions. In this work, however, spark timing was held constant. This was done to allow mixing dynamics of the fuel and air to dominate as fuel injection conditions were different for each test point.
It should be noted that this work focuses on soot formed under steady state and fully warm operating conditions. In fact, the majority of soot formation for normal vehicle operation occurs during the cold start phase through fuel rich regions formed by fuel impingement on cold engine surfaces or poor fuel vaporization due to cooler in-cylinder charge temperatures. Though the fundamental understandings regarding mechanisms driving soot reactivity variation should prove useful, it must be remembered that soot formed under cold start conditions may have unique properties as compared to the soot studied in this work.
2.2. Particulate matter (PM) characterization
In this work, collection of particulates was conducted through a variety of ways. For imaging of particles through electron microscopy, a 200 mesh lacy copper grid was introduced to the exhaust stream and particles were collected primarily through thermophoresis. The sampling apparatus placed the copper grid into the centerline of the exhaust for roughly 12 s. Soot powder for Raman, X-Ray Photoelectron Spectroscopy (XPS), and electron microscopy work was collected through loading of a Teflon filter using a side stream of exhaust, after the engine had reached stable conditions. The soot powder was then scraped from the Teflon filter into an airtight glass vial for storage until analysis could be conducted.
2.2.1. Thermogravimetric analyzer (TGA)
A thermogravimetric analyzer (TGA) model SDT Q600 was used to investigate soot reactivity and partially oxidize soot for further characterization. Prior to oxidation, the semi-volatile fraction was removed through a thermal treatment using N2 at 500 °C. Soot reactivity was explored by isothermal oxidation using ultra-zero grade air at 500 °C. Partially oxidized samples were used to investigate the soot oxidation process. Soot samples were partially oxidized by halting the flow of the oxidizing ultra-zero grade air to the soot sample prior to complete oxidation. Testing variability was estimated through the standard deviation of repeated isothermal oxidation events for select samples.
Reactivity analysis by TGA was performed on combustion derived soot and Printex-U, a representative carbon powder with consistent properties. Printex-U is a reference soot used to compare soot reactivity between research works as variations in experimental conditions can limit direct quantitative comparisons.
2.2.2. Smoke meter
An AVL Smoke Meter was used to measure engine-out carbonaceous soot. The Christian correlation (Christian et al. Citation1993) was used to convert smoke number to carbonaceous soot concentration. This correlation was shown in previous research to work well even at low engine-out soot emissions levels comparable to those of gasoline engines (Northrop et al. Citation2011). Testing variability was quantified by taking the standard deviation of at least three samples at the same operating condition on the same day.
2.2.3 X-Ray photoelectron spectroscopy (XPS)
An Axis Ultra XPS from Kratos with a monochromatic Al source was used to evaluate soot chemical bonding. Samples were placed on indium foil, that was then placed onto a double-sided conductive carbon tape. This carbon tape was then placed onto a copper bar.
For analysis of elemental composition, a survey scan was performed for each sample using a pass energy of 160 eV and a binding energy range from 0 eV to 1200 eV with 2 sweeps. For analysis of chemical states regarding the C 1 s and O 1 s peaks, a binding energy range from 280 eV to 300 eV was chosen for the C 1 s peak and a binding energy range from 528 eV to 540 eV was chosen for the O 1 s peak. Measurement accuracy is often estimated at 10% for atomic concentrations for this type of instrument. Given the lack of repeated data sets, testing variation is estimated at 10% for this work.
2.2.4. Raman spectroscopy
A Renishaw in Via Microscope with a RenCam CCD detector was used to collect first order Raman spectra. This involved a static scan for Raman shift from 1086 cm−1 to 1888 cm−1, centered at 1500 cm−1. An argon laser producing light at a wavelength of 532 nm was chosen.
The peaks found in this work are described in order of lowest to highest Raman shift: the D4 peak (Lorentzian) at 1200 cm−1 correlating to amorphous carbon or organic molecules, the D1 peak (Lorentzian) at 1350 cm−1 correlating to disordered graphitic lattice, the D3 peak (Gaussian) at 1500 cm−1 correlating to stretched carbon to carbon bonding, and the G peak (Lorentzian) at 1590 cm−1 correlating to graphitic like structure. The standard deviation of five measurements was taken for each sample to assess testing variation.
2.2.5. Transmission electron microscope (TEM)
Imaging with a JEOL 3011 ultra-high resolution transmission electron microscope (TEM) with a lanthanum hexaboride thermoelectric emission gun was used for qualitative evaluation of soot nanostructure. The JEOL 3011 has an objective focal length of 2.5 mm, accelerating voltage of 300 kV, point to point resolution of 0.17 nm, and lattice resolution of 0.14 nm.
2.2.6. Scanning transmission electron microscope with energy dispersive spectroscopy (STEM + EDS)
A JEOL 2100 probe-corrected analytical microscope equipped with a zirconated tungsten thermal field emission tip was used to detect the presence of lubricant and engine wear metals within soot samples. The accelerating voltage was set to 200 kV, the collection angle was set to 40 mrad, and the beam conversion angle was set to 20 mrad. The image resolution is 0.19 nm point to point. Analysis was performed on the soot particles taken from the bulk soot sample.
3. Results and analysis
Particle size distribution and carbonaceous soot concentrations from this work are presented in a previous publication (Easter et al. Citation2019). Engine out soot concentrations and particle size distributions were significantly affected by changes to injection timings and pressures. Soot concentration and particulate number were lowest at the baseline condition. Both soot concentration and particulate number were found to moderately increase for the late injection and low injection pressure operating condition with respect to the baseline condition. It was noticed that the soot concentration was slightly higher for the low injection pressure with respect to the late injection condition, though the particle concentration was lower. There was a slight increase in larger particles for the low injection pressure condition with respect to the late injection condition. Significant differences were seen for the early start of injection with a 16.5x increase in soot concentration and a significant increase in the concentration of large particles and the peak particle size.
3.1. Soot reactivity
As mentioned in the introduction, soot reactivity is a key factor influencing GPF filtration efficiency and effective control of soot regeneration. Soot reactivity was explored in this work through iso-thermal conditions using a TGA and ultra-zero grade air. Results of normalized soot oxidation against time for each soot type is reported in a previous article (Easter et al. Citation2019). The T10-T90, or time it takes for the normalized soot mass value to go from 90% (0.9) remaining in the crucible to 10% (0.1) remaining in the crucible, was calculated for each operating condition and is given in . These values are used in future correlations of soot reactivity. Error bars represent one standard deviation of repeated isothermal oxidation events.
Figure 1. T10-90 times for soot from the various engine operating conditions.
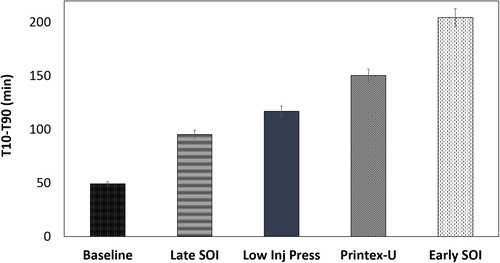
The large variations in reactivity between the four fuel injection conditions are easily noted. The T10-T90 time at 500 °C for soot from the early start of injection condition is over four times higher with respect to the baseline condition. That is a significant spread in soot oxidative reactivity with considerable implications for soot oxidation within a GPF.
As mentioned previously, Printex-U is a model soot used for its consistent properties to compare soot reactivity measurements across research works with unique experimental set-ups. It is interesting that the reactivity of the Printex-U model soot is within the spread of oxidation rates observed for gasoline soot. Choi and Seong also identified this trend. In their work, the nanostructure and semi-volatile fraction of the Printex-U was found to be similar to the gasoline derived soot. Printex-U contains no ash and should theoretically have a lower reactivity than any of the soot derived from operation of a GDI engine. Choi and Seong propose the low reactivity of the least reactive gasoline soot may be due to a unique soot structure of matrix bound organics that is not well understood (Choi and Seong Citation2015).
3.1.1. Soot reaction rate parameters
To effectively quantify soot reactivity for use with numerical models, an Arrhenius equation is commonly used for fitting kinetic parameters. Previous researchers have found this sort of expression to work well for characterizing soot oxidation reaction kinetics (Stanmore, Brilhac, and Gilot Citation2001; Choi and Seong Citation2015). The Arrhenius-type equation as used in the previously mentioned works is provided in EquationEquation (1)(1)
(1) .
(1)
(1)
In this equation: A is a pre-exponential factor, Ea is the activation energy (kJ mole−1), R is the universal gas constant (kJ mol−1 K−1), t is time in s, T is the temperature in Kelvin, and n is the reaction order. The natural logarithm is taken of EquationEquation (1)(1)
(1) for easy determination of key kinetic parameters and is given in EquationEquation (2)
(2)
(2) . The variable α is the degree of conversion, as determined by the ratio of soot mass that has been oxidized to the initial soot mass within the crucible at the start of the oxidation event.
(2)
(2)
The plot of ln (dα/dt) vs. ln (1-α) for the engine soot samples and Printex-U is given in for the 500 °C isothermal test results.
Figure 2. Comparison of TGA data from iso-thermal oxidation at 500 °C.
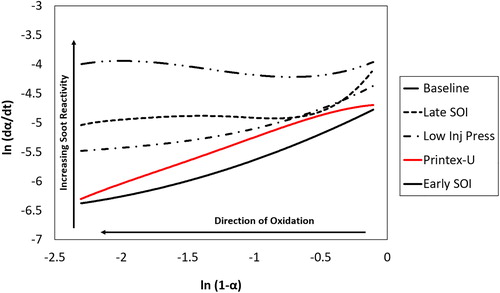
If reactivity were just a function of temperature and degree of conversion, each soot should have a straight line of constant slope. Though the Printex-U and early start of injection condition could support a linear regression, the other three conditions produce non-linear results. Therefore, their soot oxidation processes cannot be described with a conventional Arrhenius equation. This is counter to what has been observed by other, mostly diesel focused, works evaluating soot reactivity. Interestingly, this nonlinear behavior has been observed previously from key works focused on gasoline derived soot (Choi and Seong Citation2015). Though the influence of ash content on soot reactivity was given as the primary driver, detailed investigations into underlying mechanisms were not conducted.
3.2. Ash
Elements such as calcium, zinc, and sodium found in lubrication derived ash have been identified as key contributors to enhancing gasoline soot reactivity (Choi and Seong Citation2015; Choi and Seong Citation2016). ICP-MS analysis was completed by the Shell Oil Company to determine if these elements were present in the engine lubrication oil used for this work. The results confirmed that the engine oil used for this work, Mobil 1 5 W-30 Full Synthetic High Mileage, contained moderately high amounts of zinc and calcium. Therefore, the ash formed in this work should have a catalytic effect on soot oxidation. ICP-MS results are shared in the online supplemental information.
3.2.1. Carbonaceous soot concentrations
Given the impact ash content has on soot oxidative reactivity, there should be a correlation between engine out soot concentration and soot reactivity within this work. Oil consumption is expected to be relatively constant as engine speed and load were held constant. Therefore, any increase in soot emissions should result in a more diluted level of ash within the soot powder. Given this, one may assume the higher the engine out soot level, the lower the reactivity of the soot, given the assumed reduction in relative ash.
A plot of soot reactivity expressed as T10-T90 versus engine out soot concentration is given in . Error bars represent one standard deviation. To further aid in this discussion, an approximated ash fraction is given at each data point. This fraction assumes the amount of ash is unknown but held constant, given as “x”, and is divided by the engine-out soot concentration. As expected, reactivity decreases as engine-out soot levels rise or approximated ash fraction declines.
Figure 3. Soot oxidation time, T10-T90, plotted against engine-out soot levels and approximated ash fraction.
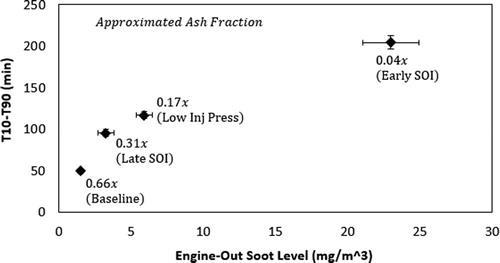
Previous researchers analyzing the reactivity of gasoline soot have shown that ash fraction can correlate well with engine-out soot values for hot steady-state operation, so this assumption has experimental support (Choi and Seong Citation2015).
3.2.2. STEM-EDS
XPS analysis through a survey scan was performed on the four samples taken from the different engine operating conditions. However, no elements relevant to the ash were detected, even for samples that had been oxidized to a 75% mass loss. XPS is a surface technique, with a sample depth from 3 nm to 10 nm. It is also a low-resolution technique, with a detection limit typically near 1%. Therefore, it is plausible it may not be capable of detecting low levels of ash or ash embedded within soot particles.
To further explore the presence of ash within the soot samples, STEM-EDS was performed on soot from the baseline and early start of injection operating conditions. These two conditions were chosen because they possess the greatest difference in reactivity and therefore should prove to have the most visible trend if the theory regarding the relationship between engine out soot values and ash content is true. STEM-EDS has several advantages over XPS, and if ash is present, this technique should be able to detect it. This technique can collect information on elements present from the entire depth of the sample and has a detection limit near 0.1%.
For the baseline operating condition, multiple areas were viewed while examining hundreds of particles and only one instance of ash was detected. This low rate of ash detection matches other works by which ash concentration in gasoline soot at similar conditions varied from 0.1% to 0.6% (Choi and Seong Citation2015). shows the results from this ash rich portion of the soot along with the collected EDS Spectra.
Figure 4. STEM + EDS results baseline: (a) dark field image, (b) EDS spectra.
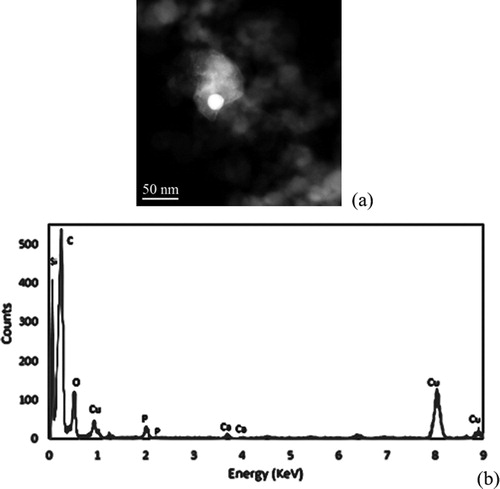
Contributions from the additives within the lubrication oil are clear. Within the bright ash filled region of the soot sample shown, various additives, such as calcium, magnesium, and zinc, were spread uniformly throughout. This statement can be further reviewed through elemental mapping given in the online supplemental information.
When analyzing the early start of injection condition, no ash was detected within the soot sample. These findings with STEM + EDS do not rule out the presence of ash in soot produced from the early injection timing condition. As oil was likely burned at an equal rate for this condition, it would seem unlikely that no ash is present in any of the bulk samples. It is likely, however, that this level of ash is extremely low. This is further evidenced by the low assumed ash fraction of 0.04x. It is also interesting to note that much of this soot was likely formed on the piston top, not in a region such as the cylinder walls where interaction with the lubricant film would be likely.
3.3. Confirming reactivity dependence on ash content
Beside ash content, past works on diesel soot have identified particulate morphology and chemical composition to affect soot reactivity. Additional experiments were performed in this work on gasoline soot to identify if these factors were contributing to soot reactivity in any significant way. These additional tests were necessary in confirming that ash content was in fact playing the dominant role in affecting soot reactivity variation.
3.3.1. Nanostructure
Soot nanostructure was semi-quantitatively analyzed through Raman spectroscopy and comparisons between ordered and disordered peak heights and areas.
Within Raman spectroscopy various D peaks may be correlated with some aspect of nanostructure disorder whereas the G peak may be correlated with the graphitic portion of the sample. The ratio of areas for the D1 and G peak and the ratio of peak intensities for the D1 and G peak are commonly used to compare the nanostructure of carbon samples. Values for AD1/AG (ratio of areas for the two peaks) and ID1/IG (ratio of intensity for the two peaks) are given in . A higher ratio of either suggests a more disordered, or less graphitic, nanostructure.
Figure 5. AD1/AG and ID1/IG ratio for the four operating conditions.
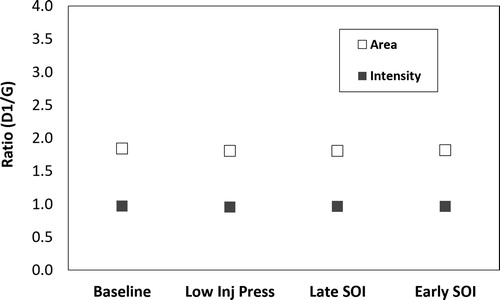
The four conditions are very similar in their nanostructure as suggested by the close values of the D1/G ratio. It is also noted that the area of the D1 peak, disordered nanostructure, is close to double that of the G peak, graphitic nanostructure, though intensity peaks are nearly 1:1. This suggests the soot is highly disordered in nature. Sample variability was small; the error bars are smaller than the symbols used in the plot.
Previous researchers have also found soot from gasoline direct injection engines to be disordered in nature (Miyashita et al. Citation2015; Liati et al. Citation2016). This is likely a product of higher rates of organics bound to the soot matrix (An et al. Citation2016) that prevent the growth of graphene segments, lower temperatures during formation (<1250 °C), and a lack of high temperature exposure after soot formation to support rearrangement of graphene segments to a more ordered structure (Zhu et al. Citation2005).
3.3.2. Chemical composition
Surface functional groups were evaluated using XPS as these characteristics have been correlated with soot reactivity in other research works evaluating soot from combustion ignition engines (Song et al. Citation2006; Sun Citation2017). Values for the respective bonding groups as a percentage of the carbon content and a percentage of the oxygen content are given from this work in . Error bars represent 10% sample variation.
Figure 6. Atomic percentage of various bonding states for both oxygen and carbon.
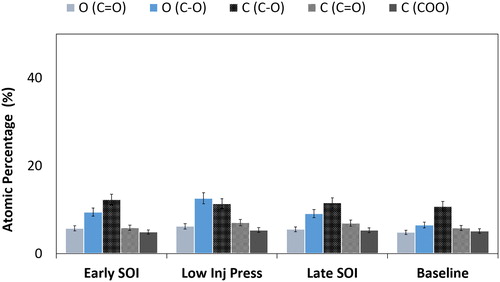
Functional groups found within literature for combustion derived carbonaceous matter were found to be ordered in the following way: C = O<C-O < C-C (Cain et al. Citation2010) and this trend was observed with the gasoline derived soot in this work. Interestingly, these referenced functional groups were found to be quite similar amongst the four samples. Oxidation often proceeds through the formation of various oxygen functional groups including alcohols, aldehydes and carboxylic acids, and the presence of these groups often corresponds to different degrees of oxidation of the carbon. Given that these are all immature highly disordered soot particles that likely experienced a relatively low formation temperature, it is expected their absolute concentrations of various oxygen functional groups would be so similar.
3.4. Oxidation process
Given the compelling evidence that the variation in soot oxidative reactivity and unique oxidation process is being driven by ash content, morphological changes during the soot oxidation process were explored to better understand the key mechanisms responsible. The TGA was utilized to partially oxidize soot from the early start of injection and baseline operating conditions. These conditions produced the least and most reactive particulates, respectively. Soot generated from both operating conditions were oxidized to 40% mass loss and 75% mass loss.
3.4.1. Nanostructure and particle interactions
Nanostructure is of interest when reviewing the soot oxidation process. Rearrangement of the soot nanostructure during oxidation and the oxidation pathway taken within the particle have an impact on soot oxidation rates. Some researchers have observed soot particles that are oxidized from the outside in (shrinking core), (Ishiguro et al. Citation1991) while others have observed soot particles that are oxidized from the inside out (hollowing out) (Song et al. Citation2006). Additionally, the evolution in nanostructure during oxidation is also inconsistent among soot type. In some works, the nanostructure became more ordered during the soot oxidation process as the more disordered and more reactive carbon oxidized preferentially, while the longer graphene segments actually exhibited growth and loss of curvature (Strzelec et al. Citation2017; Song et al. Citation2006; Ishiguro et al. Citation1991; Gaddam et al. Citation2016). For other soot particles, such as soot produced from neat Fischer-Tropsch diesel fuel, the nanostructure became slightly more disordered during oxidation (Song et al. Citation2006).
For this work, the nanostructure of the gasoline soot particles formed from both the baseline and the early start of injection operating conditions appear to remain disordered during oxidation. Additionally, soot particles from neither operating condition showed signs of internal oxidation. TEM images are shown for the 0%, 40% and 75% oxidation states in . These images were taken at varying magnifications, as provided in the figure title.
Figure 7. TEM images of the soot oxidation process: (a) baseline 0% – 300k, (b) early SOI 0% – 200k, (c) baseline 40% – 160k, (d) early SOI 40% – 160k, (e) baseline 75% – 160k, (f) early SOI 75% – 160k.
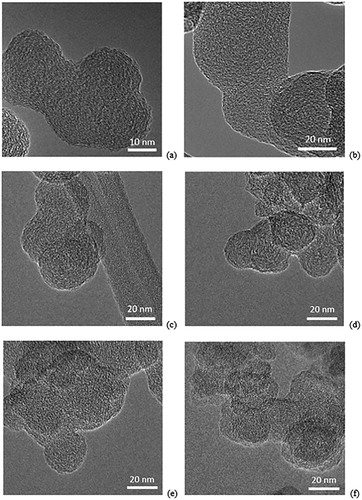
Though some graphene segments of notable length were present on the outer edges of the soot particles at the 0% oxidation state, the partially oxidized soot samples show a highly disordered nature without the presence of any noticeable graphene segments. The soot particles appear to remain disordered throughout the oxidation process. Perhaps there is little re-arrangement within the soot layers and the soot is being oxidized from the outer, possibly more graphitic layer, into the inner more disordered layers of the gasoline soot particles. It is also evident that the particles are merging into each other, migrating and combining with each other to form non-spherical large particles with high particle overlap. This suggests that upon removal of the outer region, cohesive forces and the disordered nature of the soot may result in melding between particles.
3.4.2. Ash interactions
The presence of ash was evaluated for the baseline and early start of injection soot at a 75% oxidation level using STEM + EDS. Various areas of the TEM grid with particles present were analyzed by reviewing dark field images for the presence of metal elements. An EDS spectrum was obtained for any area of interest. When reviewing the 75% oxidized baseline soot, it was easy to spot areas containing ash. An example of a dark field image and an EDS spectra for soot from the baseline operating condition containing ash are given in .
Figure 8. STEM + EDS results, baseline – 75% oxidized: (a) dark field image, (b) EDS spectra.
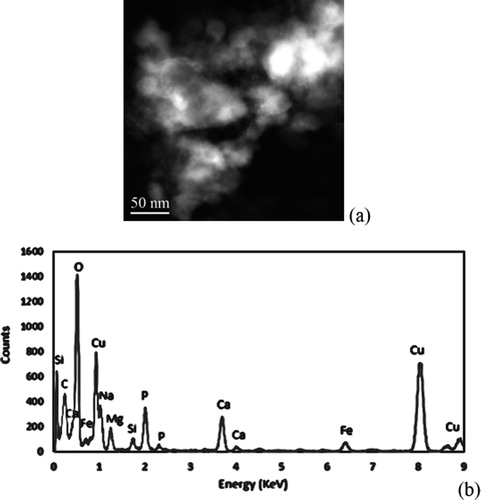
The regions of soot particles rich in ash appear to migrate near each other during the soot oxidation process. This aligns with work by other researchers showing ash particle growth in diesel particulate filters during soot oxidation events. As the loose soot particles form more dense structures during oxidation driven by high soot-soot interaction forces, the ash particles within the soot begin to combine and adhere to each other by their own ash-ash particle interaction forces (Sappok et al. Citation2013). These interactions make sense as ash particles have a higher attractive force for other ash particles as compared to soot particles and likewise for soot particles preferring other soot particles over ash particles (Kamp et al. Citation2014). It should also be noted that there is still high soot to ash contact and the ash regions are still separated by soot particles, thus suggesting the ash is still playing a role in enhancing soot oxidation. From the EDS spectra, sodium, calcium, phosphorus, silicon, copper, magnesium, and iron are detected. Sodium, calcium, phosphorus, and magnesium are from the oil additive package. The iron is likely from engine wear that made its way to the lubricating oil. The copper may be from bearing materials or a background component from the TEM grid. Silicon was present in all samples and may be an artifact of seal materials, dirt that made its way to the intake of the engine, or an artifact of the silicon detector used in the EDS.
Elemental mapping of the sample area is given in detail in the online supplemental information. The oil additives appear to be distributed nearly evenly through-out much of the region analyzed. The ash remains distributed in and in contact with the soot during late stages of oxidation.
Evaluations of dark field images for the early start of injection condition were made for over a hundred particles and no ash was detected.
4. Ash influence on the oxidation process
The confirmation of the presence of ash, imaging of ash-soot interactions, analysis of particle nanostructure shifts during the oxidation process, and soot oxidation characteristics given through TGA observations have provided insight into some of the mechanisms by which ash may be contributing to enhanced soot reactivity. A soot oxidation mechanism that is consistent with the experimental observations of this study is proposed in the following paragraphs and illustrated through . This proposed mechanism builds upon past research works.
Figure 9. Phases of soot oxidation.
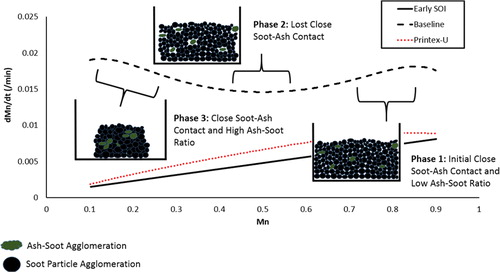
Soot produced from the early start of injection operating condition, with an assumed ash fraction of 0.04x, represents disordered gasoline soot devoid of enough ash to observe a unique soot oxidation process. Soot produced from the baseline condition, with an assumed ash fraction of 0.66x, represents disordered gasoline soot with enough ash present to exhibit unique oxidation characteristics. Printex-U, a carbon powder with consistent characteristics, represents a reference carbon known to be free of ash. In , the rate of normalized soot mass loss “dMn/dt” is plotted against the instantaneous normalized soot mass “Mn” throughout the soot oxidation process.
Both the soot from the early start of injection operating condition and the Printex-U carbon powder, similar in their assumed low ash content, exhibit a linear rate of mass loss through-out the soot oxidation process. May it be noted again, though the early start of injection condition likely contains ash, it likely contains far less than the amount found in the baseline case. The assumed ash ratio is 16.5 times higher for the soot from the baseline operating condition in comparison to the soot from the less reactive early start of injection operating condition.
Uniquely, the baseline soot exhibits an enhanced rate of mass loss at both the initial and final stages of soot oxidation. For soot relatively high in ash content, such as that from the baseline condition, it is proposed that at early stages of oxidation there is a high degree of close ash-soot contact enhancing soot reactivity. As oxidation proceeds, this close contact is reduced as the soot nearest the ash oxidizes first. In research work by Miyamoto et al. reviewing the impact of fuel doped with calcium and other metals on diesel soot oxidation, a clear two-stage oxidation was observed. The rate of the second stage was much slower than the first and consistent despite changes in the amount or type of metal added to the fuel (Miyamoto, Hou, and Ogawa Citation1988). It was determined that the first stage was a rapid oxidation process derived from close soot-ash contact while the second slower stage was a result of the loss in soot-ash contact as the soot near the calcium particles was oxidized. This same dynamic may be occurring for these gasoline soot particles.
The third stage was not observed in the work by Miyamoto et al. In this work it is proposed that after the close contact is lost and oxidation continues, soot particles like those from the baseline condition, with their relatively high levels of ash and disordered nanostructure, begin to gravitate toward each other. Within these particles, compelled through strong interparticle attraction forces, close contact with the ash and soot is re-formed as the particles meld into each other during the outside in oxidation process. The oxidation rate increases continuously as ash-soot contact remains close and ash-soot ratios elevate by the continuous oxidation of the soot.
Regarding the lack of a third stage of soot oxidation within the work by Miyamoto et al, perhaps the oxidation of the more structured diesel soot particles and differences in ash-soot interactions driven by the ash introduction method of a doped fuel prevented the final stage from occurring. Additionally, the ash to soot ratios in the work by Miyamoto et al. were lower given the high soot concentrations of a diesel engine in relation to those observed in this work. This low ash to soot ratio may prevent the third stage of oxidation from being observed.
5. Conclusions
Carbonaceous PM samples generated from the same engine speed and load operating conditions but with variations in fuel injection timing and pressure were evaluated. Soot reactivity varied significantly, with the most reactive soot oxidizing four times more rapidly at 500 °C in air than the least reactive soot. Additionally, the more reactive soot possessed a unique oxidation rate that prevented quantifying reaction rate parameters through an Arrhenius type expression. All engine-out carbonaceous PM samples were determined to have similar nanostructure and chemical composition but were believed to be unique in their ratio of ash to soot. Soot reactivity results correlated strongly with the assumed ash to soot ratio, and the presence of ash was confirmed through STEM + EDS analysis.
The soot oxidation process was explored for insight into the mechanisms by which ash content strongly influences soot oxidative reactivity. It was determined that the gasoline derived soots in this work oxidize through an outside in process. Additionally, the particles remain disordered and meld into each other during oxidation. During the oxidation process, it appears ash embedded soot regions migrate toward one other. The ash is in substantial contact with the soot and ash elements are evenly distributed within the particulates.
Given the observed trends in soot reactivity and the oxidation process, this work hypothesizes a new model explaining the strong influence of ash on reactivity for gasoline soot. This model is applicable for soot from a standard gasoline direct injection engine and covers variations in ash-soot ratios. When a low ash to soot ratio is present, oxidation is uniformly enhanced as only a small portion of the soot is in close contact with the ash. As ash concentration increases, there enters a point when a three phase oxidation process is observed. The unique third stage of oxidation may be a product of particles migration and melding during the oxidation process, as this may contribute to close soot to ash contact that enhances reactivity. Reactivity may be continually increasing until the end of the oxidation process as the relative ratio of ash to soot shifts higher through the loss of soot by oxidation.
As gasoline particulate filters gain a presence in the automotive sector, it is important that the variations in reactivity of the soot collected on the GPF are understood. This works leads to understandings that oil consumption and soot production rates provide key factors in determining soot reactivity as influenced by a relative ash to soot ratio. This understanding can aide in the development of engine controls that balance effectively thermal protection during active regeneration events and soot layer build-up for high filtration.
Supplemental Material
Download MS Word (6.4 MB)Acknowledgments
The authors would like to thank Dr. Chenxi Sun for her guidance in using the instruments and collection of soot samples. They also wish to thank the Michigan Center for Material Characterization, specifically Dr. Kai Sun, Dr. Bobby Kerns, and Dr. Haiping Sun, for their help with TEM imaging. This material is derived from work completed at the Walter E. Lay Automotive Laboratory at the University of Michigan.
Additional information
Funding
References
- An, Y., S. Teng, Y. Pei, J. Qin, X. Li, and H. Zhao. 2016. An experimental study of polycyclic aromatic hydrocarbons and soot emissions from a GDI engine fueled with commercial gasoline. Fuel 164:160–71. doi:10.1016/j.fuel.2015.10.007.
- Barone, T., J. Storey, A. Youngquist, and J. Szybist. 2012. An analysis of direct-injection spark ignition (DISI) soot morphology. Atmos. Environ. 49:268–74. doi:doi.org/10.1016/j.atmosenv.2011.11.047. doi:10.1016/j.atmosenv.2011.11.047.
- Boehm, H. P. 1994. Some aspects of the surface chemistry of carbon blacks and other carbons. Carbon 32 (5):759–69. doi:10.1016/0008-6223(94)90031-0.
- Cain, J., P. Gassman, H. Wang, and A. Laskin. 2010. Micro-FTIR study of soot chemical composition - Evidence of aliphatic hydrocarbons on nascent soot surfaces. Phys. Chem. Chem. Phys. 12 (20):5206–18. doi:10.1039/b924344e.
- Choi, S., and H. Seong. 2015. Oxidation characteristics of gasoline direct injection (GD) engine soot: Catalytic effects of ash and modified kinetic correlation. Combust. Flame 162 (6):2371–89. doi:10.1016/j.combustflame.2015.02.004.
- Choi, S., and H. Seong. 2016. Lube oil-independent ash chemistry on soot oxidation reactivity in a gasoline direct injection engine. Combust. Flame 174:68–76. doi:10.1016/j.combustflame.2016.09.019.
- Christian, V. R., F. Knopf, A. Jaschek, and W. Schindler. 1993. Eine neue Messmethodik der Bosch-Zahl mit erhohter Empfindlichkeit. Motortech Z 54:16–22.
- Donnet, J. B. 1982. Structure and reactivity of carbons: From carbon black to carbon composites. Carbon 20 (4):267–82. doi:10.1016/0008-6223(82)90002-1.
- Easter, J., S. Bohac, J. Hoard, A. Fiano, and K. Premchand. 2019. Evaluation of low mileage GPF filtration and regeneration as influenced by soot morphology, reactivity, and GPF loading. SAE 2019-01-0975. Detroit: SAE International. doi:10.4271/2019-01-0975.
- Eichlseder, H., E. Baumann, P. Mueller, and S. Rubbert. 2000. Gasoline direct injection - A promising engine concept for future demands. SAE 2000-01-0248. Detroit: SAE International. doi:10.4271/2000-01-0248.
- Farron, C., N. Mathias, D. Foster, M. Andrie, R. Krieger, P. Najt, K. Narayanaswamy, A. Solomon, and A. Zelenyuk. 2011. Particulate characteristics for varying engine operation in a gasoline spark ignited, direct injection engine. SAE 2011-01-1220. Detroit: SAE International. doi:10.4271/2011-01-1220.
- Frenklach, M., and H. Wang. 1991. Detailed modeling of soot particle nucleation and growth. Symp. (Int.) Combust. 23 (1):1559–66. doi:10.1016/S0082-0784(06)80426-1.
- Gaddam, C., R. Vander Wal, S. Chen, A. Yezerets, and K. Kamasamudram. 2016. Reconciliation of carbon oxidation rates and activation energies based on changing nanostructure. Carbon 98:545–56. doi:10.1016/j.carbon.2015.11.035.
- Harris, S., and M. Maricq. 2001. Signature size distributions for diesel and gasoline engine exhaust particulate matter. J. Aerosol Sci. 32 (6):749–64. doi:10.1016/S0021-8502(00)00111-7.
- He, X., A. Ratcliff, and B. Zigler. 2012. Effects of gasoline direct injection engine operating parameters on particle number emissions. Energy Fuels 26 (4):2014–27. doi:10.1021/ef201917p.
- Ishiguro, T., N. Suzuki, Y. Fujitani, and H. Morimoto. 1991. Microstructural changes of diesel soot during oxidation. Combust. Flame 85 (1-2):1–6. doi:10.1016/0010-2180(91)90173-9.
- Johnson, T. V. 2014. Review of emerging trends on gasoline emissions control. Paper presented at the 3rd International Conference Advanced Emission Control Concepts for Gasoline Engines, Dusseldorf, May 2014.
- Kamp, C. J., A. Sappok, Y. Wang, W. Bryk, A. Rubin, and V. Wong. 2014. Direct measurements of soot/ash affinity in the diesel particulate filter by atomic force microscopy and implications for ash accumulation and DPF degredation. SAE Int. J. Fuels Lubr. 7 (1):307–16. doi:10.4271/2014-01-1486.
- Keifer, J. R., M. Novicky, M. S. Akhter, A. R. Chughtai, and D. M. Smith. 1981. The nature and reactivity of the elemental carbon (soot) surface as revealed by the Fourier transformed infrared (FTIR) spectroscopy. Int. Soc. Opt. Photon. 289:184–8.
- Liati, A., S. Schreiber, P. Dimopoulos, Y. Arroyo, R. Dasilva, and A. Spiteri. 2016. Electron microscope characterization of soot particulate matter emitted by modern direct injection gasoline engines. Combust. Flame 166:307–15. doi:10.1016/j.combustflame.2016.01.031.
- Liu, X., T. Chanko, C. Lambert, and M. Maricq. 2018. Gasoline particulate filter efficiency and backpressure at very low mileage. SAE 2018-01-1259. Detroit: SAE International. doi:10.4271/2018-01-1259.
- Mathis, U., M. Mohr, and A. Forss. 2005. Comprehensive particle characterization of modern gasoline and diesel passenger cars at low ambient temperatures. Atmos. Environ. 39 (1):107–17. doi:10.1016/j.atmosenv.2004.09.029.
- Miyamoto, N., Z. Hou, and H. Ogawa. 1988. Catalytic effects of metallic fuel additives on oxidation characteristics of trapped diesel soot. SAE 1988-09-01. Detroit: SAE International. doi:10.4271/881224.
- Miyashita, K., Y. Fukuda, Y. Shiozaki, K. Kondo, T. Aizawa, D. Yoshikawa, D. Tanaka, and A. Teraji. 2015. TEM analysis of soot particles sampled from gasoline direction injection engine exhaust at different fuel injection timings. SAE 2015-01-1872. Detroit: SAE International. doi:10.4271/2015-01-1872.
- Neeft, J., M. Makkee, and J. Moulijn. 1996a. Catalysts for the oxidation of soot from diesel exhaust gases. I. An exploratory study. Chem. Eng. 2 (64):295–302.
- Neeft, J., M. Makkee, and J. Moulijn. 1996b. Metal oxides as catalysts for the oxidation of soot. Chem. Eng. J. Biochem. Eng. J. 64 (2):295–302. doi:10.1016/S0923-0467(96)03138-7.
- Northrop, W., S. Bohac, J. Chin, and D. Assanis. 2011. Comparison of filter smoke number and elemental carbon mass from partially premixed low temperature combustion in a direct-injection diesel engine. J. Eng. Gas Turbines Power 133 (10):102804-(1–6). doi:10.1115/1.4002918.
- Palmer, H., and C. Cullis. 1965. Chemistry and physics of carbon. Dekker (Marcel Dekker) 1:205.
- Sappok, A., I. Govani, C. Kamp, Y. Wang, and V. Wong. 2013. In-situ optical analysis of ash formation and transport in diesel particulate filters during active and passive DPF regeneration processes. SAE 2013-01-0519. Detroit: SAE International. doi:10.4271/2013-01-0519.
- Seong, H., and A. Boehman. 2011. Impact of intake oxygen enrichment on oxidative reactivity and properties of diesel soot. Energy Fuels 25 (2):602–16. doi:10.1021.
- Seong, H., K. Lee, and S. Choi. 2013. Effects of engine operating parameters on morphology of particulates from a gasoline direct injection (GDI) engine. SAE 2013-01-2574. Detroit: SAE International. doi:10.4271/2013-01-2574.
- Song, J., M. Alam, A. Boehman, and U. Kim. 2006. Examination of the oxidation behaviour of biodiesel soot. Combust. Flame 146 (4):589–604. doi:10.1016/j.combustflame.2006.06.010.
- Stanmore, B., J. Brilhac, and P. Gilot. 2001. The oxidation of soot: A review of experiments, mechanisms and models. Carbon 39 (15):2247–68. doi:10.1016/S0008-6223(01)00109-9.
- Strzelec, A., R. Vander Wal, S. Lewis, T. Toops, and C. Daw. 2017. Nanostructure and burning mode of light-dity diesel particulate with conventional diesel, biodiesel and intermediate blends. Int. J. Engine Res. 18 (5-6):520–31. doi:10.1177/1468087416674414.
- Su, J., W. Lin, J. Sterniak, M. Xu, and S. Bohac. 2014. Particulate matter emission comparison of spark ignition direct injection (SIDI) and port fuel injection (PFI) operation of a boosted gasoline engine. J. Eng. Gas Turbines Power 136 (9)0:91513. doi:10.1115/1.4027274.
- Sun, C. 2017. Nanostructure and reactivity of soot produced from partially premixed charge compression ignition (PCCI) combustion and post injection. PhD Thesis, University of Michigan.
- Szybist, J., A. Youngquist, T. Barone, J. Storey, W. Moore, M. Foster, and K. Confer. 2011. Ethanol blends and engine operating strategy effects on light-duty spark-ignition engine particle emissions. Energy Fuels 25 (11):4977–85. doi:dx.doi.org/10.1021/ef201127y. doi:10.1021/ef201127y.
- Vander Wal, R., and A. Tomasek. 2003. Soot oxidation dependence upon initial nanostructure. Combust. Flame 134 (1-2):1–9. doi:10.1016/S0010-2180(03)00084-1.
- Zhu, J., K. Lee, A. Yozgatligil, and M. Choi. 2005. Effects of engine operating conditions on morphology, microstructure and fractal geometry of light-duty diesel engine particulates. Proc. Combust. Inst. 30 (2):2781–9. doi:10.1016/j.proci.2004.08.232.