
 ?Mathematical formulae have been encoded as MathML and are displayed in this HTML version using MathJax in order to improve their display. Uncheck the box to turn MathJax off. This feature requires Javascript. Click on a formula to zoom.
Abstract
Fine mode particulate matter (PM) is known to be a major risk for human health as it can cause respiratory and cardiovascular diseases. Whether produced from anthropogenic or natural processes, fine mode PM is often electrically charged with positive, negative and/or bipolar charges. These preexisting charges can, in some cases, significantly affect measurements from sensors which involve a charging stage prior to measurement by, e.g., electrometry. In this work, we demonstrate quantitatively the impact of preexisting charges () on three different unipolar diffusion charging (DC) configurations using both simulations and experiments. The DC configurations include traditional steady state (SS) DC and pulsed modes of DC, where in all configurations a positive corona charger is used. We show that the impact of preexisting charges on SS and modulated precipitation (MP) DC is comparable. Positively pre-charged particles cause a larger deviation for SS and MP DC, in contrast to modulated diffusion charging (MDC), where negatively pre-charged particles have a greater impact. In addition, we show that the ion concentration in the charging region can be increased to significantly reduce the resulting error caused by the pre-charges for both SS DC and MP DC, in contrast to MDC. These results show that the influence of unipolarly pre-charged particles is very differently pronounced for the different modes of DC. The impact strongly depends on the polarity of the pre-charges, characteristics of the charger and the DC configuration itself. These insights are particularly interesting for the design and the application of DC based sensors.
EDITOR:
1. Introduction
Air pollutants, like particulate matter (PM) or nitrogen dioxide, are well known to be a major risk for human health and our environment. Specifically, fine mode PM can cause respiratory or cardiovascular diseases and is a leading contributor to premature death (WHO Citation2013). Combustion processes are known to be a major source of fine mode PM and automotive car exhaust is thought to be one of the main contributors. In Europe, until 2011, particle number concentration (PN) was not quantified during the different stages of car inspections. The introduction of real driving emissions (RDE) tests during the type approval process of light-duty vehicles in Europe in 2017 led to an increased interest in diffusion charging based PN instruments for automotive car exhaust (Giechaskiel et al. Citation2019). Currently, several European countries are implementing national regulations for the measurement of PN, during periodic technical inspections (PTI) (Bainschab, Schriefl, and Bergmann Citation2020; Giechaskiel et al. Citation2018).
1.1. Particle number measurement
Several methods exist for the measurement of PN, which include optical or electrical detection. Condensation particle counters (CPC) are widely used in laboratories as reference equipment for PN. In CPCs, a saturated vapor is condensed on particles to grow them in size large enough to be counted by an optical detector (Chen Citation2011). The electrical measurement of PN is mainly done in two steps. First, particles are charged with a charging mechanism such as diffusion charging. Second, the resulting charge on the particles is measured. Different instruments exist which are based on these measurement steps (Fierz et al. Citation2008, Citation2014; Keskinen, Pietarinen, and Lehtimäki Citation1992; Schriefl et al. Citation2020). Diffusion chargers employ either a bipolar (Nishida et al. Citation2020) or a unipolar (Fierz et al. Citation2008) ion atmosphere to charge particles often by corona discharge. Generally, after one or more conditioning stages, the resulting current caused by the charged particles is measured by a Faraday cup electrometer (FCE). The whole instrument can be calibrated to measure PN for particular diffusion charging (DC) configurations (Schriefl et al. Citation2020).
1.2. Pre-charged particles
It is commonly assumed that the charge distribution of particles is overall neutral (Maricq Citation2006). Consequently, diffusion charging based instruments are usually calibrated with neutralized particles (Fierz et al. Citation2011). Although aged particles tend toward an overall neutral charge distribution, freshly produced particles can be bipolarly or unipolarly charged with a range of possible charge distributions. Charging can happen through several anthropogenic or natural processes, like static electrification or thermal ionization. Of particular concern are the anthropogenic sources of exhaust aftertreatment systems used in combustion based vehicles (Schwelberger et al. Citation2019).
Several studies investigated the impact of preexisting charges on unipolar diffusion charging. Biskos, Reavell, and Collings (Citation2005) showed that preexisting charge on particles does not have an impact on the final charge distribution as long as the amount of charges is lower than the mean charge, which is defined by the operating condition of the corona charger. Qi et al. (Citation2009) used a positive corona charger and examined that initially negatively charged particles carry almost the same number of positive charges as initially uncharged particles after the charger. Particles which were previously positively charged carry more charges after the charging process, whereby smaller particles cause larger deviations in response. Maricq (Citation2013) evaluated three low-cost aerosol instruments for monitoring PM emissions, where two of them were based on diffusion charging. The study evaluated the impact of pre-charged particles on the two diffusion charging based sensors and, for both sensors, some significant effects were demonstrated for different polarities and particle sizes. Fierz et al. (Citation2014) stated that their pulsed mode DC device is more affected by preexisting charges compared to a common steady state (SS) DC instrument. They indicated for their pulsed mode device that particles which are initially negatively or positively charged introduce a sensor response which overestimates and underestimates measurements, respectively. Recently, Mamakos et al. (Citation2019) studied the influence of selective catalytic reduction (SCR) on EURO VI heavy duty (HD) engines and vehicles. They observed that the particles become increasingly positively charged when the temperature of the SCR system exceeds 300 °C. Schwelberger et al. (Citation2019) assessed the introduction of an electrofilter and a tandem positive-negative corona charger into an existing DC instrument. In their experimental study on HD engines equipped with SCR, they found that the DC device without modification measured on average a 65% higher concentration compared to the reference equipment and the modified DC instrument due to positively charged particles.
1.3. Aim of this work
The aforementioned studies investigated the effects of pre-charged particles on the charging process itself or on individual instruments. Further research is needed to assess the impacts of pre-charged particles on SS and pulsed mode DC principles, to deepen insight into the differences. In our work, we investigate the impact of positively, negatively, and bipolarly pre-charged particles for three different unipolar DC configurations. These investigations are accomplished with both detailed simulations and experiments for SS DC, modulated diffusion charging (MDC) and modulated precipitation (MP) DC. The remaining article is structured as follows: first, in Section 2, we give a short introduction to the different DC configurations, followed by Section 3, where the numerical model and experimental methods are described. In Section 4, we describe and discuss the outcome of simulation and experimental investigations for the three DC settings. Finally, in Section 5, a conclusion is given. In addition, in the Supplementary Information (SI) file, we describe in detail the application of tandem DMA setups and the resulting charge distribution. For clarification, in this article, the abbreviation DC stands for the whole measurement principle including the current measurement stage and not the charging process or the charging stage itself.
2. Measurement principles and metrics
2.1. Introduction to diffusion charging
In diffusion charging, particles are exposed to an ion atmosphere in which ions attach to particles and the resulting charge distribution depends on the particle diameter and shape (Shin et al. Citation2010). The charging process can be unipolar or bipolar. Bipolar diffusion charging brings the particles to a steady-state charge distribution via collisions with both, positively and negatively charged ions, whereas in unipolar diffusion charging the particles are exposed to ions of one polarity. After charging, the charge on the particles can be measured, commonly by a FCE. The resulting current can be related to characteristics of particles. Diffusion charging based sensors can be realized with different methodologies and a variable number of stages. This enables the measurement of PN, among other particle related quantities (Fierz et al. Citation2014; Schriefl et al. Citation2020). The charging process can be static or modulated in diffusion charging based sensors. In between the corona charging and the detection stages, an electrostatic precipitation (EP) stage can deposit particles depending on their electrical mobility. Another possibility is to use two FCE at two different measurement points in the instrument in order to additionally obtain size information of the particles (Schriefl, Bergmann, and Fierz Citation2019). It is assumed that the particle losses are negligible between the different stages of the instrument. In our work, we examined three different unipolar DC configurations which are illustrated in and are described in the following.
Figure 1. Illustration of the three examined DC configurations. In all configurations, the resulting charge is measured with a Faraday cup electrometer (FCE). (a) Steady state (SS): corona is operated at constant voltage, (b) modulated diffusion charging (MDC): corona voltage is modulated, and (c) modulated precipitation (MP): corona is operated at constant voltage. In addition, an electrostatic precipitator is used to deposit particles depending on their electrical mobility (Schriefl, Bergmann, and Fierz Citation2019).
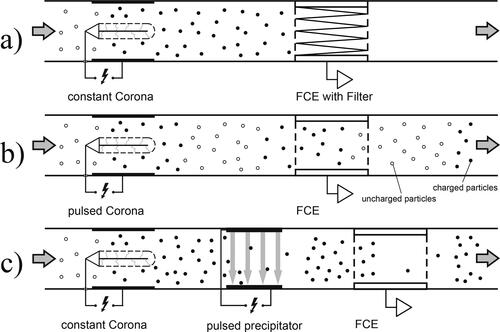
2.2. Steady state DC
In SS DC, particles are charged, commonly by corona discharge. An electrical current is measured downstream of the corona by capturing the particles, and thus their charge, with a FCE (cf. ) (Fierz et al. Citation2008; Fierz, Scherrer, and Burtscher Citation2002). The current, is given by
(1)
(1)
where N is the particle number concentration,
comprises the particle mean charge and Q is the flow rate through the instrument.
can be related to particle number concentration, N, multiplied with a power law function of the particle diameter, dx, as given by
(2)
(2)
The power law exponent, x, is close to 1 for particles with a diameter in the range of 20–200 nm (Nishida et al. Citation2019).
2.3. Modulated DC
In MDC, the net charge transferred to the particles is measured, by periodically modulating the ion source and measuring an induced current produced by the charged particles. In this case, the particles are charged by a corona discharge, whereby the corona voltage is modulated by simply switching the voltage periodically on and off. As a consequence, the particles are either exposed to unipolar ions (corona voltage on) or not (corona voltage off). Downstream, alternating clouds of charged and uncharged particles penetrate a Faraday cage electrometer. This leads to an induced AC current signal caused by particles entering and leaving the Faraday cage (Fierz et al. Citation2014). The amplitude of the AC current signal, is defined by
(3)
(3)
can be related to particle number concentration, N, multiplied with the particle diameter, dx, as stated by
(4)
(4)
where the exponent, x, is close to 1 as stated above in SS DC (Section 2.2) due to the same charging conditions.
can be related to lung deposited surface area (LDSA; Fierz et al. Citation2014).
2.4. Modulated precipitation DC
Similar to the two previously described configurations, in MP DC, particles are charged by a corona discharge, whereby the corona charger is operated in steady-state mode. Following the corona, particles are deposited depending on their charge level and the particle diameter. This is done by applying a modulated, electrostatic field on the particles in an electrostatic precipitator (EP). Therefore, the particles are either deposited depending on their electrical mobility (precipitation voltage on) or they pass through this stage (precipitation voltage off) (Burtscher and Schmidt-Ott Citation2006). The modulation of the particles’ charge state allows for the subsequent induced current measurement, as described in the MDC configuration (cf. ). The amplitude of the AC current signal, is given by
(5)
(5)
whereby the transmission through the EP assuming laminar flow conditions is given by (Hinds Citation1999)
(6)
(6)
Here, is the distance between the parallel precipitation plates, Z is the electrical mobility of the particles,
is the precipitation voltage and
is the time particles remain in the precipitation section.
With this configuration, the measured current, can directly be related to particle number concentration, N, as given by
(7)
(7)
This equation is only valid in the size regime relevant for automotive exhaust measurement. The size regime depends on the design and operating parameters of the diffusion charger (e.g., dimensions, charging efficiency, flow rate and precipitation voltage).
This depiction of the measurement principles provides a coarse overview for understanding the following simulations and experiments. A more detailed description and an extensive comparison of pulsed-mode DC can be found in Schriefl, Bergmann, and Fierz (Citation2019).
2.5. Counting efficiency
The experiments and simulations are conducted by varying particle diameter, d. Furthermore, experiments and simulations are conducted for different numbers of preexisting charges, q, on the particles. The response of the diffusion charger configurations, must be related to a reference device for comparability. Commonly in PN measurements, the response is characterized by its counting efficiency,
(Schriefl et al. Citation2020). In this article, we refer the responses of the different DC configurations to a reference CPC, which measures in parallel to the diffusion charger the PN,
This reference CPC is calibrated to have almost 100% counting efficiency (CE) for the size range of interest. Hence, the CE is defined by
(8)
(8)
2.6. Particle mean charge
As previously mentioned, simulations and experiments are evaluated in terms of CE in this work. To make them comparable, the particle mean charge,
(9)
(9)
can be calculated by measuring the current, I, caused by the particles, charged with a number of elementary charges, e. It further depends on the flow through the DC device, Q, as well as the measured particle number, N. The particle mean charge depends on the
product, where,
denotes the number of ions in the charging region and, t specifies the time which the particles remain in the charging region (Büscher, Schmidt-Ott, and Wiedensohler Citation1994). In general, the particle mean charge increases with ion concentration and the residence time of the particles in the charging region. It further depends on the particle size, whereby the particle mean charge increases with particle diameter.
3. Methods
3.1. Numerical model
The simulations in this work employ a steady-state flow profile which is computed using the computational fluid dynamics (CFD) package of OpenFOAM v.5. Thereafter, using the flow profile, diffusion charging and transport (convective, diffusive, electrical) characteristics are solved for particles and ions using the numerical model developed by Nishida, Boies, and Hochgreb (Citation2017). This model comprises the computation of the sensor response depending on ion concentration, particle concentration, particle size distribution and precipitation voltage. The meshing is realized with a simple grading approach with decreasing cell size into the direction of the walls. Each of the five parts of the geometric model is made out of 192,000 (60 × 80 × 40) cells. The total length of the geometry is 100 mm with a cross section (width and height) of 4 × 16 mm2.
represents the schematic geometry of the simulations, which is divided into five parts. These are inlet, charging region, intermediate section, precipitation section and outlet. Particles are released at the inlet with a prescribed number of charges and size distribution. The particles are considered to be entrained in a uniformly distributed flow. Thereafter, particles are exposed to an ion atmosphere. In the simulation, it is assumed that the ions are generated by a corona charger that is separated from the charging region by a grounded metal grid (i.e., indirect corona charger, see Dhaniyala et al. (Citation2011); Fierz et al. (Citation2008)), which lets ions pass through. In this configuration, the ions are forced by an electric field into the charging region, where they transfer charge to the particles. The electric field is generated from an opposite negative diffusion charging voltage, where excess ions are trapped. With this approach a steady-state ion concentration is achieved. Additional advantages of this approach are that there is pure diffusion charging (and no field charging) and that the losses are minimized due to avoidance of strong electrical fields. Following the charging stage, the particles are passed through an electrostatic precipitation region. Here, the particles either pass through (precipitation voltage off), or are transported and deposited depending on their electrical mobility (precipitation voltage on). This part is only used for the MP configuration. For SS and MDC, the precipitation voltage is set to 0. In a final step, the charges carried by the particles at the outlet of the precipitator are translated into an electrical current, Io.
Figure 2. Schematic representation of the OpenFOAM v.5 simulation geometries representing the different stages of the modeled diffusion charger. (Illustration from Schriefl [Citation2019].)
![Figure 2. Schematic representation of the OpenFOAM v.5 simulation geometries representing the different stages of the modeled diffusion charger. (Illustration from Schriefl [Citation2019].)](/cms/asset/673458c1-3524-47f6-9b28-328a9ad5b4a5/uast_a_1873910_f0002_c.jpg)
All three DC configurations (SS, MDC, and MP) are modeled. The current for the SS mode is directly given by Io. For the MDC mode, the final current, is computed by subtracting the current
(corona voltage off) from the current
(corona voltage on),
(10)
(10)
For the MP configuration, the resulting current, is computed by
(11)
(11)
and
give the currents when the ESP is turned off and turned on, respectively. As described, the response of the MDC and MP configurations are modeled by the difference of the SS signal and not through an induced current signal (see Schriefl, Bergmann, and Fierz (Citation2019)). Consequently, the effective waveform is not taken into account and some deviations are expected. A more detailed description of the numerical simulation can be found in Nishida et al. (Citation2019); Schriefl (Citation2019).
3.2. Experimental setup
In , the schematic of the experimental setup is depicted. The setup is structured into four main sections. First, the particles are generated. Then, a tandem DMA setup is used to select particles of a specified size and number of charges, therefore a specific mobility. After the selection, the monodisperse particles are sampled in parallel by the candidate charger and a reference CPC.
Figure 3. Schematic of the experimental setup for the measurements of the impact of pre-charged particles on different unipolar diffusion charging configurations.
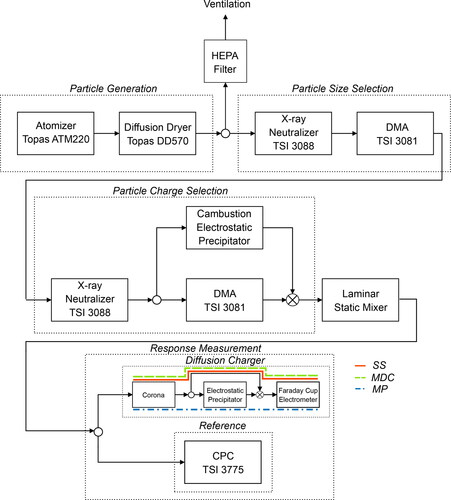
In the following, the four main sections are described in more detail. In the SI file, the tandem DMA setup and the behavior of the different charge fractions are explained in detail.
3.2.1. Particle generation
For the experiment, NaCl particles are used as the test aerosol. The NaCl particles are produced by generating droplets with an atomizer (ATM220, Topas GmbH) and subsequently drying with a diffusion dryer (DDU570, Topas GmbH). Two salt solutions, 100 ppm NaCl for 30, 50, and 75 nm particles and 500 ppm NaCl for 100, 150, and 200 nm particles are employed to generate the required particle size distributions.
3.2.2. Particle size selection
Downstream of particle generation, the polydisperse particles are neutralized with an X-ray neutralizer (Advanced Aerosol Neutralizer 3088, TSI Incorporated) followed by a DMA (Differential Mobility Analyzer 3081, TSI Incorporated) which is used to classify particles according to their electrical mobility. With this first DMA, monodisperse particles of a specific electrical mobility are extracted from the polydisperse size distribution. The selected particles are primarily singly charged particles of the chosen mobility diameter; however, some particles with larger diameter carrying multiple charges are also selected since they may have the same or a similar electrical mobility.
3.2.3. Particle charge selection
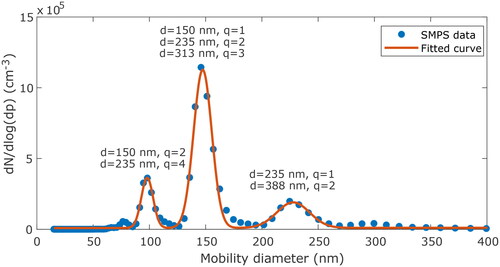
Downstream of the first DMA, the particles of monodisperse electrical mobility are again neutralized to re-distribute the charges. This process enables pre-charged particles with a specific number of charges to be selected using a second DMA (Differential Mobility Analyzer 3081, TSI Incorporated) by choosing the corresponding mobility diameter. Uncharged particles are selected by depositing the charged fraction with an electrostatic precipitator (Electrostatic Precipitator, Cambustion) so that only uncharged particles remain. For illustration, in a particle distribution is shown where the first DMA is set to 150 nm and the second DMA is operated in scanning mode. With this distribution, the second DMA can either select singly charged 150 nm particles (by setting a mobility diameter of 150 nm) or doubly charged 150 nm particles (by setting a mobility diameter of 99 nm). For the selection of the negatively pre-charged particles, an external high voltage (HV) generator (Stanford Research System, Inc., Model PS350/5000V-25W) was used to generate a positive driving voltage for the DMA. The negative voltage, for the selection of positively pre-charged particles, was directly used from the TSI equipment.
Figure 4. Charge distribution scanned with the tandem DMA setup. First DMA is set to a mobility diameter of 150 nm. Second DMA is operated in scanning mode.
3.2.4. Response measurement
After the selection of particles with a specific mobility diameter and number of charges, the monodisperse particles are passed through a custom built laminar static mixer. This is necessary to ensure adequate mixing prior to sampling with measurement equipment used in parallel (Walker et al. Citation2018). Downstream of the mixer, the aerosol sample is split into a particle stream sampled by the candidate diffusion charger and the reference CPC (Condensation Particle Counter 3775, TSI Incorporated) in parallel. The different DC configurations are realized with a custom made pulsed mode diffusion charger (PMDC) and an additional electrometer (IONER Aerosol Electrometer EL-5030, RAMEM) for the SS measurements. We note the electrometer required a warm-up period of more than 1 h to reach the stable operating temperature conditions required to gather reproducible data. If measurements are performed during the warm up phase, the output current of the electrometer drifts considerably. The custom made PMDC (Schriefl, Bergmann, and Fierz Citation2019; Schriefl et al. Citation2020) is built in a modular way, such that the different configurations can be chosen by either skipping one module (EP) or by changing the operating conditions (corona charger). Both, the corona charger and the EP, can be operated in pulsed or steady-state modes.
4. Results and discussion
Simulations and experiments are conducted for particles with diameters between 30 and 200 nm and particles carrying preexisting charges prior to the charging stage. In the simulation, also neutralized particle charge distributions according to Wiedensohler (Citation1988) are considered at the inlet of the charger. This is of importance as steady-state bipolar charge distributions are frequently encountered and DC based instruments are usually calibrated with neutralized particles (Fierz et al. Citation2011).
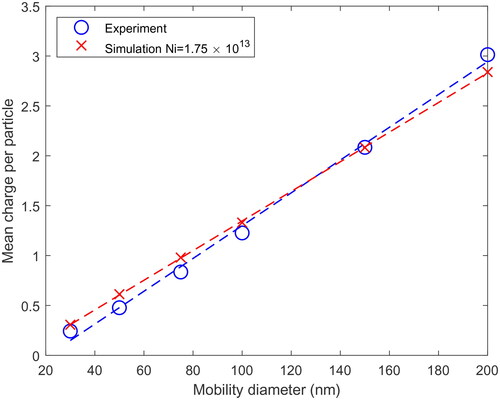
4.1. Particle mean charge
In order to make simulations and experiments comparable, the particle mean charge of the simulation is fitted to the experiment. The ion concentration of the simulation was adjusted to match the mean charge behavior to the corresponding curve of the DC instrument used in the experiment. depicts the particle mean charge for both simulation and experiment measured with the SS configuration. The ion concentration, of the simulation is set to 1.75 × 10¹³ m−3 which results into an
product of 1.35 × 10¹² m−3s.
Figure 5. Mean charge curve of both simulation model and the used corona charger in the experiment. The mean charge per particle shows the mean charge acquired for the respective particle diameter. The dashed lines are linear fits through the acquired mean charges of simulation and experiment.
4.2. Counting efficiency
The counting efficiencies (CEs) determined by simulation and experiment of the three DC configurations are shown in . The CE results of the simulation and the experiment are each normalized by the uncharged (q = 0) results at 75 nm, i.e., simulation results are normalized by the (q = 0) curve of the simulation and experimental results are normalized by the (q = 0) curve of the experiment.
Figure 6. Counting efficiency (CE) of the three examined diffusion charging topologies. In addition to the specific number of charges, in the simulation also neutralized particle distributions (q = N) at the inlet are taken into account.
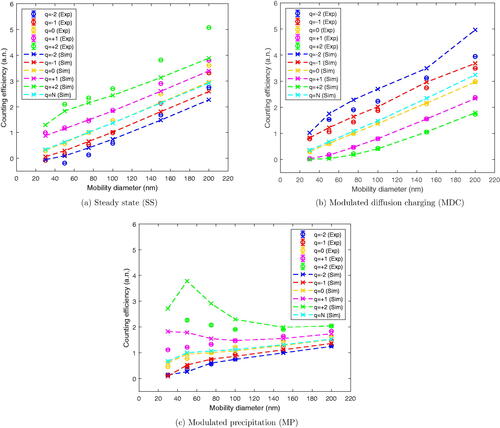
In SS mode (), the CE linearly increases with increasing particle diameter (cf. EquationEquation (2)(2)
(2) ). This linear trend is expected, due to the continuous charging process. Particles that initially carry a number of positive charges bring along a higher CE. This is a consequence of the applied positive corona voltage and therefore, positive ion atmosphere where the mean charge, and therefore the measured electrical current, becomes increasingly positive. Conversely, if the particles are pre-charged with negative charges, the normalized CE is underestimated compared to the uncharged curve. For the SS mode, the experiment and simulation show good agreement with some quantifiable differences where the experiment shows a different gradient of the curves. The differences are more pronounced due to the normalization which emphasizes the slopes of the curves. A non-linear behavior can be observed for smaller, highly charged particles. This can be attributed to the ion trap which mainly attracts smaller, highly charged particles due to their higher electrical mobility.
For the MDC configuration (), the opposite behavior is observed in comparison to the SS mode. Positively pre-charged particles lead to the normalized CE being underestimated compared to initially uncharged particles. The net charge transfer from the positive ions generated by the corona to the positively pre-charged particles is lower compared with initially uncharged particles. The curves representing initially negatively charged particles result in an overestimated CE. The net charge transfer from the positive ions generated by the corona to the negatively pre-charged particles is higher compared with initially uncharged particles. This outcome is in agreement with the statement of Fierz et al. (Citation2014). They indicated for their pulsed mode device an overestimation for negatively pre-charged particles and an underestimation of positively pre-charged particles. Comparing simulation and experiment for the MDC configuration, the results are in good agreement with some quantifiable differences for negatively pre-charged particles.
The impact of preexisting charges on MP DC () leads to a similar behavior as in SS DC. Positively pre-charged particles cause the normalized CE to be overestimated compared with sampling uncharged particles. For MP DC, the effect can be attributed to the MP process, where the induced current increases. First, the modulated EP is turned off (no electrostatic field), more charges progress into the FCE. Second, the EP is turned on, particles with increasing amount of charges (and the same diameter) are increasingly deposited in the precipitator section and therefore, fewer charges pass through. The CE of particles carrying initially negative charges are underestimated, when normalized. As expected, the CE curves of the MP mode are less size dependent than for the SS and MDC modes (cf. Equtation (7)). Compared to the SS DC, a bigger impact on smaller particle sizes (<100 nm) can be seen in MP DC because up to a certain size all particles are deposited in the precipitation region when the EP is turned on. Experiments and simulation results show very good agreement for uncharged particles and particles carrying negative pre-charges. Some differences between experiment and simulation results are seen for particles carrying a positive charge prior to the corona charger.
In all three cases (i.e., SS, MDC, and MP DC), the impact of pre-charged particles with a steady-state, bipolar charge distribution was considered using simulations. Only small differences compared to initially uncharged particles are reported. A steady-state, bipolar charge distribution carries a mean charge which is overall nearly neutral (depending on the ratio of mobilities of the ions used) and the magnitudes of charge levels (e.g., root-mean-squared charge over all charge states) are generally lower than found in unipolar diffusion charging for a given particle diameter. The mean charge per particle of the bipolar charge distribution used (Wiedensohler Citation1988) decreases from approximately −0.03 to −0.23 charges per particle for particles from 30 to 200 nm mobility diameter. Therefore, results are not significantly different from the uncharged case and results are predictably limited to a relatively small effect in the size range of interest. The biggest impact is found for MDC where an increasing influence for larger particles is shown. This is attributed to the negative current which can be measured at the outlet when the corona charger is turned off due to the negative net charge of the bipolar charge distribution. When the corona charger is turned on, a similar charge level can be measured at the outlet compared to uncharged particles. Thus, a higher net charge is transferred to the particles compared to uncharged particles at the inlet.
In general, the mean charge on an aerosol arising from unipolar diffusion charging increases with particle diameter. For a fixed level of preexisting charge (e.g., +1 charge per particle regardless of size), the impact of preexisting charges on the sensor response decreases with increasing particle diameter. At larger particle sizes, the high charge levels achieved in the charger more readily overcome constant, low levels of preexisting charge. However, in practical applications, the preexisting charge levels are higher at larger particle sizes, an aspect which must be considered. A more generalized analysis considering the effects of preexisting charge for arbitrary particle diameters is considered below.
4.3. Relative error caused by pre-charged particles
In addition to the CE, the relative error as a function of preexisting charges relative to the uncharged case is assessed. This figure of merit is of interest since instruments are generally calibrated with neutralized or uncharged particles, but measure, among others, unipolarly charged particles. Therefore, the relative error shows the deviations for the different configurations in case of pre-charged particles compared to uncharged particles and thus directly quantifies the impact on measured signals from DC devices. In , the relative errors of simulation and experiment are plotted with one other. The relative errors are plotted in a generalized, non-dimensional manner as a function of for all measured CEs, where
represents the mean charge at the outlet of the charger when there are no preexisting charges (see ) and
represents the mean number of preexisting charges at the inlet of the charger. This non-dimensional relation holds for arbitrary particle diameter. A
value of greater than 1 shows that the pre-charge is greater than the acquired mean charge of the charger. Therefore, the effects on the relative error of measurements are significant, agreeing with Biskos, Reavell, and Collings (Citation2005). In addition to the relative error data, polynomial fits indicate the trends in relative error for both the simulation and experiment. In the SI, the relative errors are illustrated as a function of the mobility diameter.
Figure 7. Relative error as a function of where
represents the mean charge at the outlet of the charger when there are no preexisting charges and
represents the mean number of preexisting charges at the inlet of the charger. Polynomial fits indicate relative error trends for simulation and experiment.
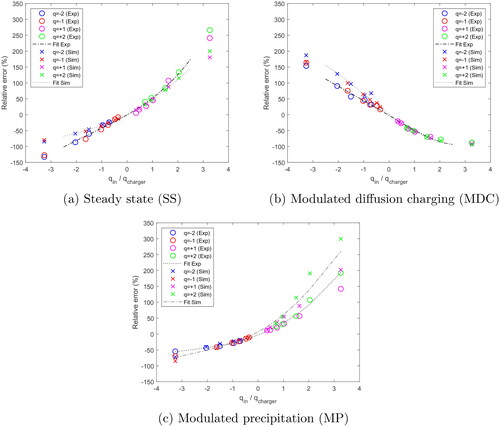
In SS operation, positively pre-charged particles cause a higher deviation compared to particles initially carrying negative charges, which can be seen in . This is an expected behavior and can be attributed to the positive corona voltage used in the PMDC charger. In the charger, negatively pre-charged particles more readily acquire charges compared to positively pre-charged particles. A similar behavior was already reported by Qi et al. (Citation2009). The relative error for simulation and experimental results agree well for all conditions reported, however, deviations between simulations and experiments increase with increasing ratio.
The opposite behavior can be observed for the MDC configuration shown in . Negatively pre-charged particles have a greater impact on the CE, due to the increased induced current and thus increased amount of ions acquired during charging. Particles carrying positive charges prior to the charging stage cause a smaller deviation and reduce CE due to the smaller amount of acquired charges. The simulation and experiments agree well for the initially, positively pre-charged particles. For the particles carrying primarily negative charges, the simulation overestimates the relative error compared to the experimental data.
For the MP mode of operation, positively pre-charged particles have a greater influence on the sensor response (cf. ). This is due to the increased induced current caused by increased precipitation of particles. A smaller amount of charges (and particles) penetrate through the Faraday cage during the phase when the precipitation is turned on and an increased amount of charges penetrate through the Faraday cage during the off cycle of the EP, due to the additional positive pre-charges. For the same reason, particles carrying negative charges cause a smaller induced current compared to the non pre-charged or positively pre-charged case. The results agree well between simulations and experiments for particles carrying primarily negative charges. Similar to MDC for negatively pre-charged particles, a deviation between simulation and experimental results is observed for positively pre-charged particles. In general, preexisting charges significantly affect measurement results for all steady-state and pulsed-mode DC methods. Positive, preexisting charges have a greater impact on the SS and MP configurations than on MDC. Conversely, negative preexisting charges more significantly impact the MDC mode. Neglecting the polarity, our results show that the influence of preexisting charges is in the same order of magnitude for all DC configurations considered. This is contrary to previously published studies, which mention a higher impact on pulsed mode diffusion chargers (Fierz et al. Citation2014). Deviations between simulations and experiments for MDC and MP may be attributed to the different details of the flow geometry. For MP and MDC, an induced current measurement is applied, where the signal is smeared by the flow profile. For SS, particles are collected in the aerosol electrometer downstream, which is similar to the simulation, where the current through the outlet boundary is quantified. The simulation does not consider transient induced current signals, whose waveform and amplitude is mainly determined by the geometry of the flow channel of the Faraday cup, which is not considered within our model. The deviations from the experiments are smaller for positively pre-charged particles in the MDC mode (and negatively charged particles in the MP mode) because the total signal is smaller.
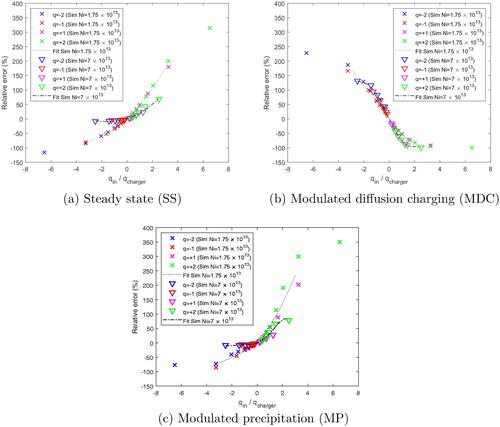
4.4. Impact of different ion concentrations
As already previously described (cf. Section 4.1), the particle mean charge of the simulation is fitted to the experimental results. This was done by adapting the ion concentration within the simulation in the corona charging region. The ion concentration of the corona charger is a critically important operating condition of the diffusion charger. By increasing the ion concentration, the mean charge curve of the corona charger gets steeper and particles reach higher charge states for the same residence time (since product increases). In , simulations were performed to show the relative error as a function of
for two different ion concentrations,
and
The ion concentration of
reflects a mean charge curve which has a double the slope of the
case of . The increase of ion concentration enables the charger to more readily overcome the effect of preexisting charge and therefore reduce the relative error. The impact of the ion concentration is more pronounced for SS and MP DC. With increasing ion concentration, the relative error of pre-charged particles substantially decreases in a similar fashion. For MDC, the impact is much less pronounced, especially for particles carrying initially positive charges. Here, the impact on the ion concentration is negligible. In the SI, the relative errors of the two simulations are plotted as a function of the particle diameter.
Figure 8. Simulation results for relative error as a function of Simulations are conducted with two different ion concentrations (
). Polynomial fits indicate the relative error trends for the different ion concentrations.
5. Conclusion
In this work, different DC configurations are evaluated and compared for their response to pre-charged particles. Simulations conducted with OpenFOAM v.5 and experiments with a custom made diffusion charger served as a basis for the study. The evaluated DC configurations include SS and pulsed modes of DC, with the impact for all three configurations being of the same order of magnitude, contrary to previous assumptions. The impact can mainly be distinguished by the polarity of the pre-charges. In case of a positive corona charger, SS DC and MP DC are more affected by positive pre-charges in contrast to MDC which is more impaired by negative pre-charges. Deviations on the CE ranged from 314 to −133% for SS, 228 to −99% for MDC, and 350 to −85% for MP in the conditions considered. We report, in contrast to previous studies, that also particles with a preexisting charge smaller than the operating condition of the charger ( 1) can cause a significant impact on the DC device. The impact strongly depends on the DC configuration and the
product of the charger. Considering the impacts on the applications of diffusion charging based sensors, such as for PTI, the MDC configuration stands out measuring positively charged particles, which can be generated in SCR systems as shown by Mamakos et al. (Citation2019) and Schwelberger et al. (Citation2019). However, for all configurations alike, the properties of the sensor principle for the respective application must be taken into account. The sensor response of MP DC can be directly related to PN, whereas the quantified current of MDC is dependent on the particle size and thus can be referred to LDSA. We additionally showed that the ion concentration of the corona strongly impacts SS DC and MP DC, whereby higher ion concentrations reduce the error caused by pre-charges significantly. On the contrary, the influence of the ion concentration on the MDC configuration is much smaller. By adjusting the ion concentration (or the residence time of the particles in the charging region), the resulting error caused by pre-charged particles can be minimized.
Supplemental Material
Download PDF (404.3 KB)Additional information
Funding
References
- Bainschab, M., M. A. Schriefl, and A. Bergmann. 2020. Particle number measurements within periodic technical inspections: A first quantitative assessment of the influence of size distributions and the fleet emission reduction. Atmos. Environ. X 8:100095.
- Biskos, G., K. Reavell, and N. Collings. 2005. Unipolar diffusion charging of aerosol particles in the transition regime. J. Aerosol Sci. 36 (2):247–65. doi:https://doi.org/10.1016/j.jaerosci.2004.09.002.
- Burtscher, H., and A. Schmidt-Ott. 2006. Verfahren und Vorrichtung zur Messung von Anzahlkonzentration und mittlerem Durchmesser von Aerosolpartikeln. Patent EP1681551A1, filed December 19, December 2005, issued July 19, 2006.
- Büscher, P., A. Schmidt-Ott, and A. Wiedensohler. 1994. Performance of a unipolar “square wave” diffusion charger with variable nt-product. J. Aerosol Sci. 25 (4):651–63. doi:https://doi.org/10.1016/0021-8502(94)90006-X.
- Chen, Y.-S. 2011. Condensation particle counters. In Aerosol measurement: Principles, techniques, and applications, ed. P. Kulkarni, P. Baron, and K. Willeke, chapter 17, 381–91. Hoboken, NJ: John Wiley & Sons, Inc.
- Dhaniyala, S., M. Fierz, J. Keskinen, and M. Marjamäki. 2011. Instruments based on electrical detection of aerosols. In Aerosol measurement: Principles, techniques, and applications, ed. P. Kulkarni, P. Baron, and K. Willeke, chapter 18, 393–416. Hoboken, NJ: John Wiley & Sons, Inc.
- Fierz, M., H. Burtscher, P. Steigmeier, and M. Kasper. 2008. Field measurement of particle size and number concentration with the diffusion size classifier (disc). SP-2150. SAE Technical Paper Series.
- Fierz, M., C. Houle, P. Steigmeier, and H. Burtscher. 2011. Design, calibration, and field performance of a miniature diffusion size classifier. Aerosol Sci. Technol. 45 (1):1–10. doi:https://doi.org/10.1080/02786826.2010.516283.
- Fierz, M., D. Meier, P. Steigmeier, and H. Burtscher. 2014. Aerosol measurement by induced currents aerosol measurement by induced currents. Aerosol Sci. Technol. 48 (4):350–7. doi:https://doi.org/10.1080/02786826.2013.875981.
- Fierz, M., L. Scherrer, and H. Burtscher. 2002. Real-time measurement of aerosol size distributions with an electrical diffusion battery. 33 (7):1049–60.
- Giechaskiel, B., P. Bonnel, A. Perujo, and P. Dilara. 2019. Solid particle number (SPN) portable emissions measurement systems (PEMS) in the European Legislation: A review. IJERPH. 16 (23):4819. doi:https://doi.org/10.3390/ijerph16234819.
- Giechaskiel, B., T. Lahde, R. Suarez-Bertoa, M. Clairotte, T. Grigoratos, A. Zardini, A. Perujo, and G. Martini. 2018. Particle number measurements in the European legislation and future JRC activities. Combust Engines 174 (3):3–16.
- Hinds, W. C. 1999. Aerosol technology: Properties, behavior, and measurement of airborne particles. 2nd ed. Hoboken, NJ: John Wiley & Sons, Inc.
- Keskinen, J., K. Pietarinen, and M. Lehtimäki. 1992. Electrical low pressure impactor. J. Aerosol Sci. 23 (4):353–60. doi:https://doi.org/10.1016/0021-8502(92)90004-F.
- Mamakos, A., M. Schwelberger, M. Fierz, and B. Giechaskiel. 2019. Effect of selective catalytic reduction on exhaust nonvolatile particle emissions of euro vi heavy-duty compression ignition vehicles. Aerosol Sci. Technol. 53 (8):898–910. doi:https://doi.org/10.1080/02786826.2019.1610153.
- Maricq, M. M. 2006. On the electrical charge of motor vehicle exhaust particles. J. Aerosol Sci. 37 (7):858–74. doi:https://doi.org/10.1016/j.jaerosci.2005.08.003.
- Maricq, M. M. 2013. Monitoring motor vehicle PM emissions: An evaluation of three portable low-cost aerosol instruments. Aerosol Sci. Technol. 47 (5):564–73. doi:https://doi.org/10.1080/02786826.2013.773394.
- Nishida, R. T., A. M. Boies, and S. Hochgreb. 2017. Modelling of direct ultraviolet photoionization and charge recombination of aerosol nanoparticles in continuous flow. J. Appl. Phys. 121 (2):023104. doi:https://doi.org/10.1063/1.4972335.
- Nishida, R. T., T. J. Johnson, J. S. Hassim, B. M. Graves, A. M. Boies, and S. Hochgreb. 2020. A simple method for measuring fine-to-ultrafine aerosols using bipolar charge equilibrium. ACS Sens. 5 (2):447–53. doi:https://doi.org/10.1021/acssensors.9b02143.
- Nishida, R. T., N. M. Yamasaki, M. A. Schriefl, A. M. Boies, and S. Hochgreb. 2019. Modelling the effect of aerosol polydispersity on unipolar charging and measurement in low-cost sensors. J. Aerosol Sci. 130:10–21. doi:https://doi.org/10.1016/j.jaerosci.2019.01.003.
- Qi, C., C. Asbach, W. G. Shin, H. Fissan, and D. Y. H. Pui. 2009. The effect of particle pre-existing charge on unipolar charging and its implication on electrical aerosol measurements. Aerosol Sci. Technol. 43 (3):232–40. doi:https://doi.org/10.1080/02786820802587912.
- Schriefl, M. A. 2019. Particle number sensing based on electrical charging techniques. PhD thesis, Graz University of Technology.
- Schriefl, M. A., A. Bergmann, and M. Fierz. 2019. Design principles for sensing particle number concentration and mean particle size with unipolar diffusion charging. IEEE Sens.J. 19 (4):1392–9. doi:https://doi.org/10.1109/JSEN.2018.2880278.
- Schriefl, M. A., R. T. Nishida, M. Knoll, A. M. Boies, and A. Bergmann. 2020. Characterization of particle number counters based on pulsed-mode diffusion charging. Aerosol Sci. Technol. 54 (7):772–89. doi:https://doi.org/10.1080/02786826.2020.1724257.
- Schwelberger, M., A. Mamakos, M. Fierz, and B. Giechaskiel. 2019. Experimental assessment of an electrofilter and a tandem positive-negative corona charger for the measurement of charged nanoparticles formed in selective catalytic reduction systems. Appl. Sci. 9 (6):1051–17. doi:https://doi.org/10.3390/app9061051.
- Shin, W. G., J. Wang, M. Mertler, B. Sachweh, H. Fissan, and D. Y. H. Pui. 2010. The effect of particle morphology on unipolar diffusion charging of nanoparticle agglomerates in the transition regime. J. Aerosol Sci. 41 (11):975–86. doi:https://doi.org/10.1016/j.jaerosci.2010.07.004.
- Walker, D., T. Johnson, R. Nishida, J. Symonds, K. Reavell, M. Bainschab, and A. Bergmann. 2018. Uniformity of particle concentration after mixing aerosol flows. Paper presented at the 10th International Aerosol Conference (IAC), St Louis, September 2–7.
- WHO. 2013. Health effects of particulate matter. policy implications for countries in Eastern Europe, Caucasus and Central Asia. Copenhagen, Denmark: WHO Regional Office for Europe.
- Wiedensohler, A. 1988. An approximation of the bipolar charge distribution for particles in the submicron size range. J. Aerosol Sci. 19 (3):387–9. doi:https://doi.org/10.1016/0021-8502(88)90278-9.