
 ?Mathematical formulae have been encoded as MathML and are displayed in this HTML version using MathJax in order to improve their display. Uncheck the box to turn MathJax off. This feature requires Javascript. Click on a formula to zoom.
Abstract
In the foreseen decommissioning plans of damaged Fukushima Daiichi reactors, submicron aerosol particles will be generated when retrieving fuel debris from reactor buildings by cutting it into small pieces. A multi-nozzle spray system will be used to scavenge these aerosol particles inside the primary containment vessel. To improve the aerosol removal efficiency of the multi-nozzle spray system, it is now necessary to study the aerosol removal performance by different single spray nozzles with different spray properties (spray angle, droplet velocity, etc.). To improve the aerosol scavenging efficiency, a new method with water mist was proposed to aggregate with aerosol particles and form large-sized coagulated aerosol-mist particle clusters, which can subsequently be removed by spray with higher efficiency. In this study, the effect of spray properties on aerosol removal efficiency with preexisting water mist was investigated using three different spray nozzles. The experimental results showed that a larger droplet velocity led to stronger vortex circulation and faster gaseous entrainment from outer spray area into spray region, resulting in a smaller circulation period of gas entrainment by spray and higher aerosol removal efficiency. The numerical simulations of aerosol removal by different spray nozzles without mist were also conducted to provide more insights into the aerosol removal process. By comparing the experiment and simulation results, it is found that the accumulated spray water in the lower plenum of the vessel and the water film formed on the vessel sidewalls also contributed to aerosol removal, especially for the particles with large Stokes numbers.
Copyright © 2021 American Association for Aerosol Research
EDITOR:
1. Introduction
During the Fukushima Daiichi accident in the year of 2011, the reactor fuel and internal structures melted, re-solidified, and formed the debris in the bottom of the reactor pressure vessel and pressure containment vessel in Fukushima Daiichi nuclear reactor units 1-3 (Nuclear Damage Compensation and Decommissioning Facilitation Corporation Citation2016). In the foreseen decommissioning and debris retrieval plans of the damaged Fukushima Daiichi reactors, the debris will be cut into small pieces using cutting techniques (e.g., mechanical cutting, laser cutting, etc.) and then removed from the reactor buildings (Inter-Ministerial Council for Contaminated Water and Decommissioning Issues Citation2015). The research group in IRSN (Institut de radioprotection et de sûreté nucléaire, France) has fabricated Fukushima Daiichi in- and ex-vessel fuel debris simulants and used them to conduct preliminary laser cutting tests (Journeau et al. Citation2018; Porcheron et al. Citation2018). The tests yielded aerosol particles with mass median diameters D50 of 0.27 µm and 0.16 µm for the in- and ex-vessel cutting, respectively. The particles deposited on the internal structure surface may also resuspend as a result of vibration or shock during the cutting operations. These radioactive aerosol particles must be removed inside the reactor buildings. Otherwise, they may pose a radiological hazard for the workers and the environment.
Different safety systems can be used for the aerosol removal in a light-water nuclear power plant, including containment spray system (Porcheron et al. Citation2010; Powers and Burson Citation1993), suppression pool (Diao et al. Citation2020; Li et al. Citation2019), and venting system (Zhang et al. Citation2019; Zhou et al. Citation2020). Among these systems, the spray system is most effective and applicable in a damaged reactor environment for controlling the aerosol suspension in a closed space and for cooling the high-temperature debris due to the decay heat. Submicron aerosol particles can be removed by spray droplets with different collection mechanisms, including mechanical effects (inertial impaction, interception, and Brownian diffusion) and phoretic effects (diffusiophoresis and thermophoresis) (Ardon-Dryer, Huang, and Cziczo Citation2015; Murata et al. Citation1997). Generally, inertial impaction and interception are significant when aerosol diameters are larger than 1 µm; Brownian diffusion works effectively for removing aerosols with diameters smaller than 0.1 µm. In the Greenfield gap with aerosol diameters between 0.1 and 1 μm (Greenfield Citation1957), neither collection mechanisms work effectively, and the single droplet collection efficiency has a minimum value. Unfortunately, most concerned aerosol particles in the real Fukushima Daiichi decommissioning have diameters just within the Greenfield gap. For these Greenfield-gap aerosol particles, a single spray nozzle is not sufficient for washing the entire gas space of the primary containment vessel; instead, a multi-nozzle spray system will be employed (Gelain et al. 2020). It is now necessary to study the aerosol removal performance by different single spray nozzles to optimize the future multi-nozzle spray system design.
Previous researchers have conducted many experiments about aerosol removal by a single spray nozzle. The aerosol washout experiments were conducted inside a cylindrical vessel with a height of 9.2 m, diameter of 3.2 m, and total volume of 60 m3 in the THAI experimental facility (Gupta et al. Citation2017; Kaltenbach and Laurien Citation2018). A full-cone spray nozzle with a nozzle outlet diameter of 8 mm was used to generate spray droplets at a mass flow rate of 1 kg/s. The generated spray droplets had a Sauter-diameter of d32 = 830 μm and a spray angle of 30°. The soluble Cesium Iodine (CsI) particles with a mean diameter of 1.76 μm were used as aerosol particle simulants, and the vessel was pressurized up to 1.5 bar. In the test, the steam content was 25% in volume. However, the vessel wall’s heating was regulated at the temperature of 90 °C to achieve a superheated atmosphere before aerosol feed and to ensure complete evaporation of aerosol particles. Porcheron et al. (Citation2010) performed aerosol removal tests inside a cylindrical vessel with a height of 4.8 m, internal diameter of 1.5 m, and total volume of 7 m3 in the TOSQAN facility. The vessel was initially pressurized with steam to simulate the primary circuit breach. A full-cone spray nozzle TG-3.5 from Spraying System Company was used to generate spray droplets at the spray injection flow rate of 1.8 L/min. The generated spray droplets had a spray angle of 57°, a velocity of 12 m/s at 20 mm from the nozzle exit, and arithmetic mean diameter of 146 μm. The SiC particles with arithmetic mean diameter D10 = 1.11 μm were used to simulate the released fission products. Sun et al. (Citation2020) also carried out aerosol removal experiments in the TOSQAN facility. In their tests, a full-cone spray nozzle (model: HHSJ12007, from SprayJet Company) with a wide spray angle of 120° was used to generated spray droplets for three different spray injection flow rates (60, 90, and 110 g/s). With such a wide spray angle, the spray coverage ratio of the vessel’s gas space was high, and a part of the spray droplets would impact the vessel sidewalls from a very high level of the vessel. The insoluble and non-hygroscopic SiC particles with a count median diameter of 0.5 μm were adopted as aerosol particle simulants. They pointed out that the gas flow inside the vessel fluctuated, and the flow behavior was different from a stable circulation flow induced by the nozzle with a narrow spray angle.
The traditional spray system is not so effective in removing Greenfield-gap aerosol particles. To further improve the aerosol removal efficiency by a single spray nozzle for aerosol particles with diameters between 0.2 and 1 μm, our research group proposed a new method with employing water mist to coalesce with aerosol particles prior to spray injection and conducted the aerosol removal tests in both the UTARTS facility and TOSQAN facility (Liang, Zhou et al. Citation2020; Liang et al. Citation2021). It is hypothesized that water mist coagulated with aerosol particles to form large-sized coagulated aerosol-mist particle clusters under different coagulation mechanisms, including Brownian coagulation, laminar shear-induced coagulation, turbulent shear-induced coagulation, turbulent inertial coagulation, gravitational coagulation, and electrostatic effects (Dépée et al. Citation2019; Friedlander Citation2000; Pruppacher and Klett Citation1997; Wang, Wexler, and Zhou Citation1998; Yang and Hogan Citation2017). The enlarged aerosol-mist particle clusters with diameters close to or even larger than 1 μm can subsequently be removed by spray droplets at a higher efficiency due to the enhanced inertial impaction. In addition, previous researchers observed that particles with poor surface wettability may bounce off the droplet surface after physical contact (Sumiyoshitani et al. Citation1984; Wang, Song, and Yao Citation2015; Zuo et al. Citation2016). In our method using water mist, mist particles were supposed to coagulate with aerosol particles, and a liquid film should be formed on the particle surface. Consequently, the particle surface wettability can be improved and the probability of particles bouncing off the droplet surface decreased.
Though different spray nozzles were employed in many experiments as mentioned above, the experimental conditions and particle properties were quite different from each other, making it difficult to compare the aerosol removal performance by different spray nozzles. Besides, previous researchers did not consider the aerosol capture by accumulated spray water in the lower plenum of a vessel and the water film formed by spray droplets impacting vessel sidewalls. Even Liang, Zhou et al. (Citation2020), Liang, Erkan et al. (Citation2020), and Liang et al. (Citation2021) conducted aerosol removal tests using same aerosol simulants but different spray nozzles under similar thermal-hydraulic conditions in the UTARTS facility, there was no in-depth discussion about the effect of spray properties on aerosol scavenging performance with water mist. To fulfill these gaps, this study aims to investigate the effect of spray properties on aerosol scavenging performance without/with water mist in the UTARTS facility. Three different spray nozzles were used to generate spray droplets with different size distributions, velocity magnitudes, and spray angles. The numerical simulations of aerosol removal by different spray nozzles without mist were also conducted using our developed aerosol removal model with OpenFOAM (Open-source Field Operation And Manipulation) (Liang, Erkan et al. Citation2020). The simulation results were expected to provide more insights into the aerosol removal process by different spray nozzles.
The remainder of the article is organized as below. The experimental setup UTARTS facility, experimental cases and conditions, experimental procedures, and the spray droplet characteristics are presented in Section 2. Experimental results about aerosol size evolution during spraying, global spray efficiency, and aerosol removal rate by different spay nozzles are compared in Section 3. The numerical simulation results using three different spray nozzles, including spray droplets, aerosol mass fraction, gas velocity field, particle Stokes number, aerosol removal by water film, and gaseous entrainment by spray, are discussed in Section 4. The conclusions and future research prospects are finally presented in Section 5.
2. Experimental setup and method
2.1. UTARTS facility
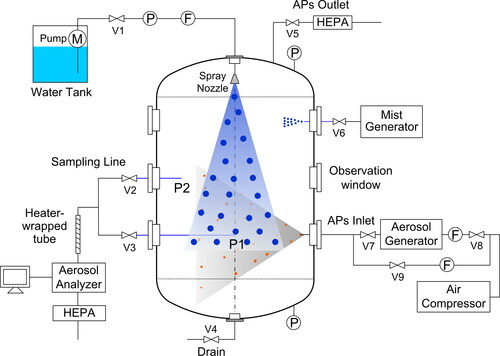
The UTARTS facility presented in consists of a cylindrical vessel (3.92 m3 volume, 2.5 m high, 1.5 m internal diameter) and various sub-systems. Thirteen observation windows were designed on the vessel sidewalls to observe experiment phenomena and conduct optical measurements. The aerosol generator was designed as a cylindrical chamber with a Laskin nozzle and a fan at the bottom. Dry ZrO2 powder was first placed at the bottom of the aerosol generator and then was blew up via the high-pressure airflow injection through the Laskin nozzle and the turbulence caused by the fan rotation. The generated aerosol particles were then injected inside the vessel. Submicron water mist was generated using an ultrasonic mist generator (model: MZ-JH30 from Japan Yamazen Company) and then dispersed inside the vessel. A spray injection pipe was inserted from the top of the vessel and a spray nozzle can be installed 300 mm from the top of the vessel. The aerosol sampling flow can be pulled from two measurement points separately at a fixed flow rate of 5 L/min. One measurement point (P1) was on the half diameter of the vessel and 1400 mm below the nozzle outlet, and the other one (P2) was 200 mm far from the vessel sidewalls and 850 mm below the nozzle outlet. The aerosol sampling line can be switched by controlling the valves V2 and V3 to measure the aerosol concentration at different locations. A 1.2-meter-long heater-wrapped pipe installed before the aerosol analyzer, together with a heatable cuvette inside the aerosol analyzer, can be heated up to 150 °C to eliminate mist from sampling flow. The sampling flow was finally transferred to the aerosol analyzer Welas2000 to measure the aerosol concentration and size distribution during spraying. Welas2000 is a famous optical particle counter based on scattered-light analysis on a single particle. Its light source is focused on a small measuring volume and gets scattered by a single aerosol particle. The level of the scattered-light pulse is a measure for the concentration (Li, Ji, and Mei Citation2010; Rosati et al. Citation2015). Welas2000 can measure particle number concentration from < 1 P/cm3 to 106 P/cm3 and number size distribution as a function of the optical diameter in the range of 0.2–10 μm with an absolute measurement error of ± 0.01 μm and relative error of 5% (Mölter and Keßler Citation2004).
Figure 1. UTARTS facility (University of Tokyo Aerosol Removal Tests facility with Sprays).
2.2. Experimental cases
To study the effect of spray properties on aerosol removal performance, totally ten experimental cases were conducted as described in . All cases were conducted at room temperature and atmospheric pressure. The water used to generate spray droplets and mist particles were also at room temperature. Insoluble ZrO2 powder with a mass mean diameter of 0.15 μm was put inside the aerosol generator to generate aerosol particles in all cases. Cases 1–9 were conducted to compare the aerosol removal performance by three spray nozzles (i.e., nozzle 1, nozzle 2, and nozzle 3) at the spray injection flow rate of 2 L/min, 3 L/min, and 2 L/min, respectively with three different mist concentration levels (i.e., without mist, with low and high concentration mist). Each experimental case was repeated for three times to check the experiment repeatability. In addition, case 10 was also conducted, using nozzle 2 but at the spray injection flow rate of 2 L/min, to explain why the flow rate of nozzle 2 in cases 4–6 was chosen as 3 L/min. More discussions can be found in Sections 3.3 and 3.4.
Table 1. Experimental cases and conditions.
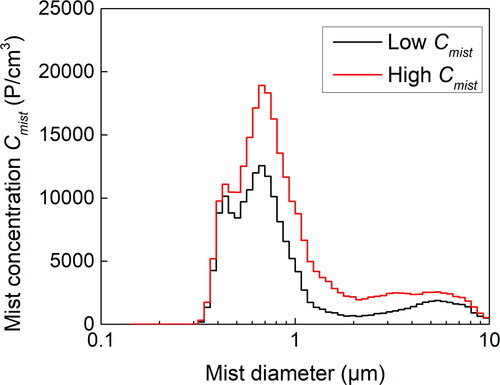
The mist concentration level and size distribution for low and high concentration mist are shown in . Mist concentration was measured using the same sampling pipe at the same measurement point (P1) as that of aerosol concentration measurement. However, mist concentration was measured separately from aerosol removal tests. It means separate tests were conducted and only mist particles were dispersed inside the vessel. Heaters of heater-wrapped tube and aerosol sensor were not used during mist concentration measurement. Mist concentration level was controlled to be same by injecting mist for the same time duration in both the separate tests and aerosol removal tests. The two mist size distributions had the peaks with the same corresponding diameter of 0.68 μm.
Figure 2. Mist size distribution at low and high concentration levels (Liang et al. Citation2021).
2.3. Experimental procedure
The general experimental procedure is explained below. First, aerosol particles were generated and injected inside the vessel until the particle concentration reached a target value. Then it was idled for 10 min so that aerosol particles can disperse uniformly inside the vessel. For the experimental cases using water mist, the mist was then generated and dispersed inside the vessel until the mist concentration reached the low or high concentration levels. The experiment was idled for another 10 min so that mist and aerosol particles can mix sufficiently and form large-sized coagulated aerosol-mist particles. After that, spray injection was activated continuously for 60 min to remove aerosol particles and water mist. During spraying, aerosol concentration at different measurement points inside the vessel was measured using the aerosol analyzer. After each experimental case, the accumulated spray water in the lower plenum of the vessel was discharged, the remaining aerosol-containing gas was exhausted outside with a HEPA (High-Efficiency Particulate Air) filter, and the manhole on the vessel sidewall was opened to clean the interior of the vessel.
2.4. Spray droplet characteristics
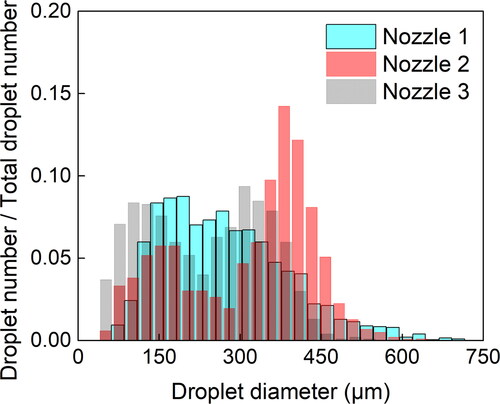
Three full-cone spray nozzles (i.e., nozzle 1, nozzle 2, and nozzle 3) were used to generate spray droplets. The models of the three nozzles are 1/8GG-SS3004 (nozzle 1), TG-3.5 (nozzle 2), and TG-2 (nozzle 3), respectively, which were all purchased from Spraying System Company. Nozzles 1 and 3 have the same orifice diameter of 1.2 mm, while nozzle 2 has a larger orifice diameter of 1.7 mm. All the three nozzles can be installed 300 mm below the top of the vessel.
The non-intrusive ILIDS (Interferometric Laser Imaging for Droplet Sizing) technique was used to measure the spray droplet size distributions of the three nozzles at the spray injection flow rate of 2, 3, and 2 L/min, respectively (Brunel and Shen Citation2013; Glover, Skippon, and Boyle Citation1995; Lemaitre et al. Citation2006). To estimate the measurement error of ILIDS method, both ILIDS and shadowgraph methods were used to measure the droplet size generated by a mono-size droplet generator. And the measurement error was estimated as 12.66% in our study. More details about the basic configuration of ILIDS and the interference images of spray droplets in the UTARTS facility can be found in the online supplementary information.
Typical droplet size measurement results of the three nozzles are presented in . The measurement area was placed far from the nozzle outlet (850 mm below the nozzle exit) to avoid the problem of droplet fringe overlapping caused by high droplet density. More than 2000 droplet diameters were measured for each nozzle to obtain its droplet size distribution. In , the light blue bar was the droplet size distribution for nozzle 1, red bar for nozzle 2, and gray bar for nozzle 3. Most of the spray droplets generated by nozzle 1 had diameters in the range of 121–340 μm, peaked at the droplet diameter of 194 μm. For nozzle 2, its droplet size distribution had two peaks, one peak had a diameter of 166 μm, and the other one of 381 μm. For nozzle 3, the spray droplets also had the bimodal size distribution, and the two peaks were at 103 and 308 μm, respectively.
Figure 3. Droplet size distribution of three nozzles.
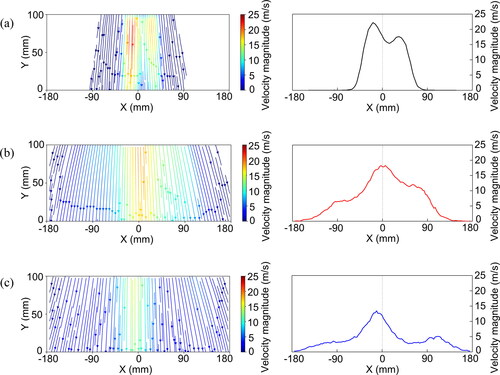
The 2 D-PIV (Particle Image Velocimetry) technique was used to measure the spray droplet velocity fields (Raffel et al. Citation2018). The uncertainty of our PIV measurement can be estimated as 0.031 m/s when measuring the droplet velocity of nozzle 3 at 2 L/min (Nishio Citation2008). An example of the time-averaged droplet velocity field, measured 207.5 mm below the nozzle 1 outlet and 250 mm below the nozzle 2 and nozzle 3 outlets, is shown in . For each nozzle, the figure on the left side depicts the droplet streamlines, and the figure on the right side depicts the corresponding velocity magnitude at 250 mm below the nozzle outlet. The maximum droplet velocity magnitude of three nozzles in the measurement area were 22.22, 18.81, and 15.05 m/s, and they have the relationship that
The corresponding spray angles of the three nozzles can be calculated as 27°, 60°, and 66°, respectively.
Figure 4. Spray droplet streamlines (left) and droplet velocity magnitude at 250 mm below the nozzle outlet (right) of three nozzles: (a) nozzle 1; (b) nozzle 2; (c) nozzle 3.
3. Experimental results using three spray nozzles
In this section, the experimental data measured at the sampling point P1 with three different nozzles are presented and compared to check the effect of spray properties on the aerosol removal performance. The experimental data measured at the sampling points P1 and P2, together with the simulation results at different sampling points, are compared and discussed in Section 4.3.
3.1. Temperature and humidity monitored during spraying
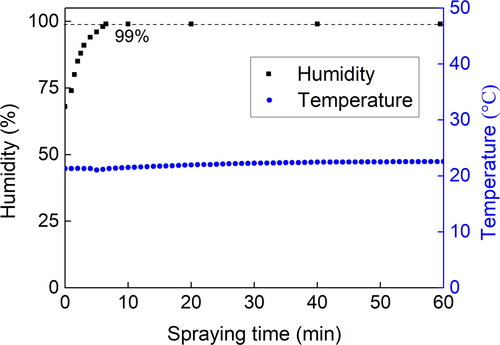
The temperature and humidity of particle-laden gas inside the vessel were monitored during tests. Take the case using nozzle 3 without mist as an example, the time evolution of temperature and humidity inside the vessel during spraying is shown in . The temperature difference during the whole spraying process was less than 1.53 °C. The temperature did not change significantly because the experiment was conducted at room temperature and atmospheric pressure, and the water used to generate spray droplets and mist was also at room temperature. With so small temperature difference, the contribution of thermophoresis to aerosol removal was negligible in this study. The humidity inside the vessel increased from the environmental humidity of 68% to 99% after the spray activation for 6.5 min. After that the humidity inside the vessel remained at 99%. As analyzed in Liang et al. (Citation2021), the contribution of diffusiophoresis to aerosol capture and aerosol-mist coagulation can also be neglected because the environmental humidity was high and the particle-laden gas reached saturation state quickly.
Figure 5. Temperature and humidity monitored during spraying in case 7.
3.2. Aerosol size evolution during spraying
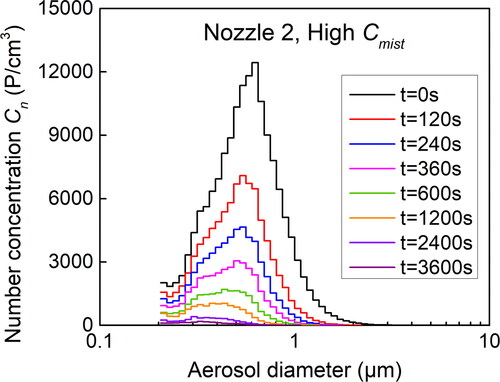
The aerosol size evolution during spraying was measured using the aerosol analyzer Welas2000. illustrates the time evolution of aerosol size distribution in the case using nozzle 2 at 3 L/min with high concentration mist. The black line refers to the aerosol size distribution at the spraying time t = 0 s, and it had a peak with the corresponding aerosol diameter of 0.63 μm. Since the initial mass mean diameter of ZrO2 particles was 0.15 μm, the 0.63-μm peak indicated that the aerosol particles coagulated when they were dispersed inside the vessel. After spray injection was activated, aerosol concentration at all diameters decreased quickly and the 0.63-μm peak also shifted left along with the spraying time. This is because large particles can be removed at a higher efficiency with strong inertial impaction, leaving only small aerosol particles (dP < 0.4 μm) with lower removal efficiency inside the vessel.
Figure 6. Time evolution of aerosol size distribution during spraying with high concentration mist using nozzle 2.
3.3. Global spray efficiency
shows the global spray efficiency E of three nozzles at different mist concentration levels. The global spray efficiency E is defined as the ratio of the difference in aerosol particle concentration Cn(t) (in P/cm3) between t = 0 s and t = 2400s to the concentration at t = 0 s, that is:
(1)
(1)
Figure 7. Global spray efficiency E of three nozzles at different mist concentration levels: (a) cases without mist; (b) cases with low Cmist; (c) cases with high Cmist.
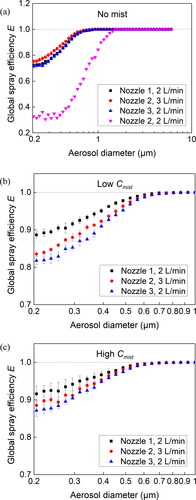
For the cases without water mist as shown in , the global spray efficiency of case 10 using nozzle 2 at 2 L/min is much lower than the global spray efficiency of cases using other nozzles at 2 L/min. However, when the flow rate of nozzle 2 increased to 3 L/min in case 4, the global spray efficiency increased and even was slightly higher than that in the cases using other nozzles at 2 L/min. In cases 4 and 10 using the same spray nozzle but at different spray injection flow rates, obviously a larger spray injection flow rate led to denser droplets and larger droplet velocity magnitudes. On the one hand, denser droplets can interact with aerosol particles at a higher probability due to more sufficient surface exchange between droplets and aerosol particles; on the other hand, larger droplet velocity magnitudes resulted in stronger gaseous mixing inside the vessel, which can homogenize aerosol distribution from the high concentration area to the low concentration area and enhance the aerosol capture by spray droplets.
While in the case with water mist, the global spray efficiency E increased along with the mist concentration levels for each spray nozzle. This is because the mist particles coagulated with aerosol particles and then the enlarged particle clusters were removed by spray droplets with enhanced inertial impaction and improved particle surface wettability. The global spray efficiency had the tendency that which was in the same tendency as the maximum spray droplet velocity of three spray nozzles, that is,
3.4. Aerosol removal rate
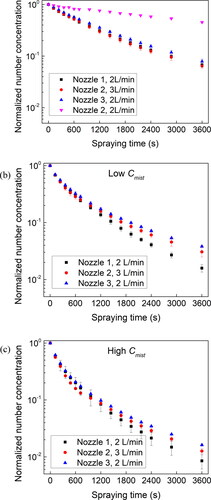
shows the time evolution of normalized total aerosol number concentration with aerosol diameters between 0.2 and 1 μm using three nozzles. As shown in , the aerosol removal amount in case 10 was smallest among the cases without mist. However, when the spray injection flow rate of nozzle 2 increased to 3 L/min in case 4, its aerosol removal amount was similar to that of the cases using other nozzles at 2 L/min. In the following discussions, the cases using nozzle 2 at 3 L/min, instead of 2 L/min, were chosen to ensure that the normalized aerosol number concentration using three nozzles in the cases without mist were close to each other. With the addition of mist at low and high concentration levels, the aerosol particles were removed fastest by nozzle 1, then nozzle 2, and finally nozzle 3, as shown in .
Figure 8. Time evolution of normalized total aerosol number concentration with 0.2 ≤ ≤ 1 μm using three nozzles at different mist concentration levels: (a) cases without mist; (b) cases with low Cmist; (c) cases with high Cmist.
The aerosol concentration inside the vessel at spraying time t can be expressed as (Porcheron et al. Citation2010):
(2)
(2)
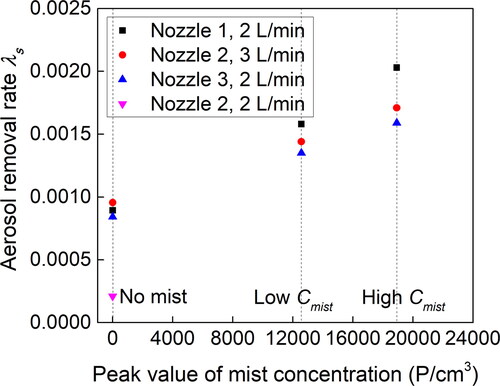
where Cn(0) is the aerosol concentration at t = 0 s (in P/cm3), and λs is the so-called aerosol removal rate by water spray (in s−1). Experimental data describing the aerosol number concentration during spraying time from 120 s to 1200s were selected and fitted to obtain the aerosol removal rate λs. shows the comparison of the aerosol removal rate of all ten cases at different mist concentration levels. Still, the λs value in case 10 was smallest than that of other cases. Also, it shows more clearly that the addition of water mist improved aerosol removal rates of all three nozzles, and the aerosol removal rates in cases with water mist have the tendency that
Figure 9. Aerosol removal rate of three nozzles at different mist concentration levels.
4. Simulation results using three spray nozzles
Experiments provided the quantitative data about aerosol removal performance but cannot clarify the aerosol removal process. In this section, the numerical simulations were conducted to provide more details about the aerosol removal process by different spray nozzles.
4.1. Numerical model and boundary conditions
A numerical model of aerosol scavenging by a single spray nozzle without mist was developed and implemented into OpenFOAM considering the collection mechanisms of inertial impaction, interception, and Brownian diffusion (Liang, Erkan et al. Citation2020). In this model, the dispersed spray droplets were described using the Lagrangian particle tracking method, the continuous phase of particle-laden gas was described using the Eulerian method, and a two-way coupling method was used to model the interaction between dispersed and continuous phases. Aerosol particles at different diameters were treated as different gas species in the continuous phase, and their movements were solved using passive scalar transport equations. The numerical model is explained in Appendix A. More details can be referred to Liang, Erkan et al. (Citation2020).
In this study, three simulation cases were conducted using the above aerosol removal model to simulate aerosol scavenging by three different nozzles without water mist in experimental cases 1, 4, and 7, respectively. The simulation boundary conditions are listed in . The spray injection flow rate, spray angle and droplet size distribution measured from experiments were used in the simulation cases. Spray droplets were assumed to disappear once they impact the vessel’s internal walls. Room temperature and atmospheric pressure were used in all three simulation cases. The aerosol mass fraction measured in experiments at the spraying time t = 0 s was used as initial conditions in different simulation cases. And the aerosol particles were assumed to disperse uniformly inside the vessel before spray activation.
Table 2. Boundary conditions for simulation cases using different spray nozzles.
4.2. Spray injection and flow regions
shows the spray droplets, velocity vectors of gas-phase, and aerosol mass fraction at the instantaneous spraying time t = 20 s in simulation case II. The spheres on the left side stand for the spray droplets, and their color refers to the droplet diameter; the arrays on the right side stand for the velocity vectors of gas-phase; the background of the slice depicts the instantaneous aerosol mass fraction of AP6 (aerosol particles with diameters of 0.6 μm). In numerical simulations, spray droplets disappeared once they hit the vessel’s internal walls. While in the experiments, spray water accumulated at the bottom of the vessel, and a layer of water film formed due to spray droplets impacting on the vessel sidewalls.
Figure 10. Spray droplets, velocity vectors of gas-phase, and aerosol mass fraction in simulation case II.
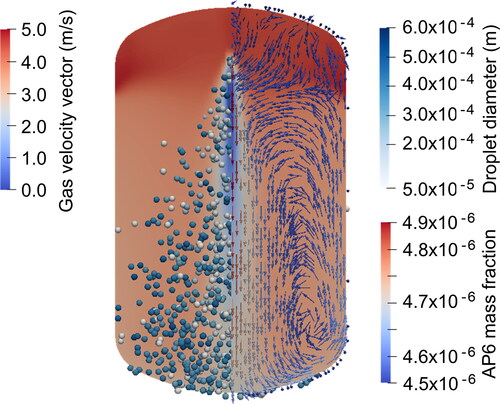
As pointed out in our previous study (Liang, Erkan et al. Citation2020), the flow area inside the vessel can be divided into three regions, spray region, circulation region, and entrainment region. The area that spray droplets swept through was the spray region, in which aerosol particles were mainly removed by interacting with spray droplets directly. The area with strong vortex circulation at two sides near the vessel’s bottom was the circulation region. And the area at the upper space of the vessel was the entrainment region.
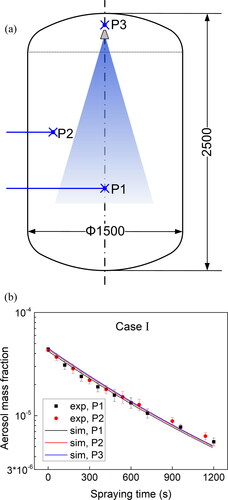
To compare the aerosol removal performance among three regions, the time evolution of aerosol mass fraction at three different sampling points were monitored in both experiments and numerical simulations as shown in . Take simulation case I for instance, as shown in , the sampling point 1 (P1) is on the half diameter of the vessel and 1400 mm below the nozzle outlet, and it is inside the spray region; sampling point 2 (P2) is 200 mm far from the vessel sidewalls and 850 mm below the nozzle outlet, and it is in the circulation region; sampling point 3 (P3) is on the half diameter of the vessel and 150 mm above the nozzle outlet, and it is inside the entrainment region. The time evolution of aerosol mass fraction was measured at P1 and P2 in the experiments and was monitored at all three measurement points in the numerical simulations. According to about the time evolution of aerosol mass fraction at three sampling points, aerosol particles were removed fastest inside the spray region (black symbol and line), then circulation region (red symbol and line), and finally entrainment region (blue line). However, the difference of aerosol removal amount among the three sampling points were not obvious because the aerosol particles can be transported from the outer spray area to the spray area quickly with the strong vortex circulation and gaseous entrainment inside the vessel.
Figure 11. Comparison of aerosol mass fraction evolution at different flow regions in case I: (a) three sampling points inside the vessel; (b) time evolution of aerosol mass fraction at three sampling points.
4.3. Time evolution of normalized aerosol mass at different diameters
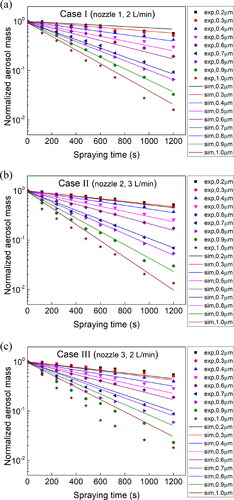
shows the time evolution of normalized aerosol mass at different aerosol diameters in three simulation cases and the corresponding experiments. The simulation results and experimental data were in good agreement for all three nozzles expect that some discrepancies happened for large particles. In case I using spray nozzle 1, the discrepancy occurred for particles with diameters of 1 μm; in case II, it occurred for particles with diameters of 0.9–1 μm; and in case III it happened for particles with diameters of 0.7–1 μm. Besides the three collection mechanisms considered in our aerosol removal model, the large particles with diameters close to 1 μm must also be removed by other factors in the experiments. This will be discussed in the following sections.
Figure 12. Time evolution of normalized aerosol mass at different diameters using three nozzles: (a) case I using nozzle 1 at 2 L/min; (b) case II using nozzle 2 at 3 L/min; (c) case III using nozzle 3 at 2 L/min.
4.4. Aerosol stokes number St
The particle Stokes number St is an important criterion toward understanding a particle’s behavior in the gas-particle two-phase flow. When St ≪ 1, a particle will closely follow the gas-phase flow acting like a tracer; when St ∼ 1, a particle will centrifuge out of the vortex cores and concentrate on the vortex peripheries; when St ≫ 1, a particle will remain unaffected by a fluid velocity change and continue its original trajectory, colliding with the object rather than flowing around it (Finlay Citation2001; Krstic Citation2006). The Stokes number St is defined as (Pak and Chang Citation2006; Ali et al. Citation2013):
(3)
(3)
where
is particle density,
is particle diameter,
is droplet velocity,
is gas velocity,
is the dynamic viscosity of air, and
is droplet diameter.
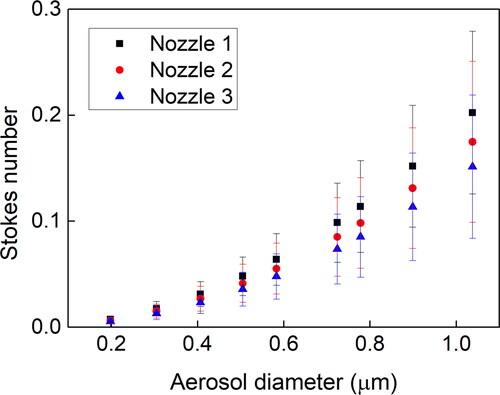
In the three simulation cases, the Stokes number St of polydisperse aerosol particles at spraying time t = 1200s was calculated as shown in . On the one hand, St values increased along with the particle diameters in all three cases; on the other hand, St values of three nozzles had the tendency that Stnozzle1,2L/min > Stnozzle2,3L/min > Stnozzle3,2L/min, the reason of which was that St value was proportional to the velocity difference between droplets and gas according to EquationEquation (3)(3)
(3) and the velocity difference of three nozzles had the relationship as
>
>
For aerosol particles with diameters of 1 μm, the average St was 0.2 in case I, 0.17 in case II, and 0.15 in case III. These particles with St close to 1 concentrated on the vortex peripheries and can easily be captured by the water film and surface of accumulated spray water.
Figure 13. Aerosol Stokes number St at the spraying time t = 1200 s using three nozzles for particles at different diameters.
4.5. Aerosol removal by accumulated spray water and water film
illustrates the accumulated spray water and water film using different spray nozzles. It can be imagined that spray water only accumulated in the lower plenum of the vessel in the experimental cases using nozzle 1 because of its narrow spray angle; while for experimental cases using nozzles 2 and 3, water film also formed on the vessel sidewalls. The water surface of both the accumulated spray water and water film can capture particles with strong inertia. As the water surface area of accumulated spray water increased in a similar way along with the spraying time in all three cases, only the water film area on vessel sidewalls was compared in the following discussions. The water film area on the vessel sidewalls can be calculated as 0 for cases using nozzle 1, 2.48 m2 for cases using nozzle 2, and 3.16 m2 for cases using nozzle 3.
Figure 14. Schematic of aerosol particles captured by accumulated spray water and water film: (a) case I using nozzle 1; (b) case II using nozzle 2; (c) case III using nozzle 3.
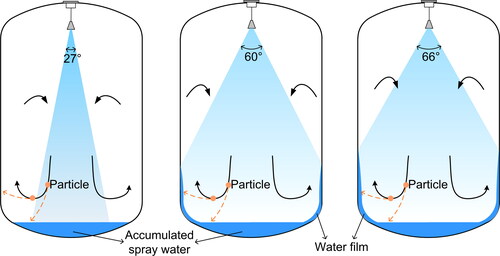
When particle-laden gas changed its flow direction at the bottom and corners, some particles with large St values would not follow the gas flow; instead, they may hit on the vessel’s bottom and vertical walls. In the experimental cases using nozzle 1, the particles that hit the surface of accumulated spray water can be captured; however, the particles that hit the vessel’s smooth sidewalls would rebound back to the gas phase and then still follow the gas circulation. While in the experimental cases using nozzles 2 and 3, the particles with large St would be captured by both the accumulated water and the water film. This can be used to explain why the discrepancies only happened for particles with diameters of 1 μm in case I, but happened for particles with diameters of 0.9–1 μm in case II and 0.7–1 μm in case III.
4.6. Circulation period of gaseous entrainment by spray
Since aerosol particles were mainly removed by interacting with spray droplets directly in the spray region, the period of particle-laden gas circulating through the spray region became important to the aerosol removal. Here, the circulation period of gaseous entrainment by spray is defined as the ratio of the spray spread volume (in m3) to the gaseous entrainment rate
(in m3/s), that is:
(4)
(4)
After one circulation period, all particle-laden gas in the spray region is supposed to be renewed. With a shorter circulation period, the updating speed of particle-laden gas in the spray region became faster, and more aerosol particles can flow into spray region and then interact with spray droplets during the unit time.
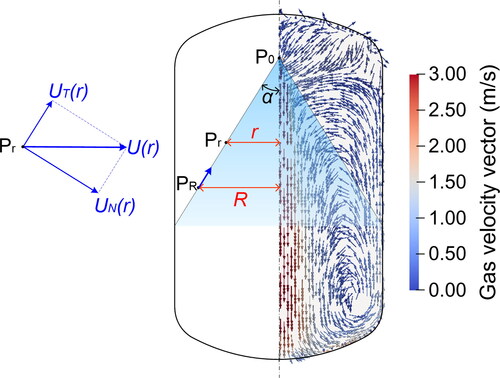
The gas entrainment flow rate can be calculated using the gas velocity information from numerical simulations. As shown in , three points (i.e.,
and
) on the boundary of the spray area were chosen for the following explanation. The distance between point
and the central axis of the vessel is
and the gas velocity at point
is
can be decomposed into a tangential velocity component
and a normal velocity component
When
points to the spray region, the particle-laden gas is entrained inside the spay region at
equals to 0 at the point
indicating that the gas phase is only entrained inside the spray region along the boundary of the spray area from
to
The function expression of
can be obtained by fitting the
value along the line
Finally, the gas entrainment flow rate
can be calculated using the following equation:
(5)
(5)
Figure 15. Calculation method of gaseous entrainment flow rate
The circulation period of three spray nozzles was calculated as shown in . With the smallest spray spread volume and highest droplet velocity magnitude of nozzle 1, the circulation period in case I was shortest among all the three simulation cases. Spray nozzle 2 had a spray spread volume slightly smaller than that of nozzle 3, and the droplet velocity magnitude of nozzle 2 was larger than that of nozzle 3, leading to a shorter circulation period using nozzle 2 than that using nozzle 3. The tendency of the circulation period of three nozzles had the relationship as
Table 3. Comparison of the circulation period of gaseous entrainment by different spray nozzles.
The tendency of the circulation period, together with particle Stokes number and water film area, can be used to explain the effect of spray properties on the aerosol removal efficiency as below.
In the experimental cases without water mist, both global spray efficiency and aerosol removal rate
in case 10 using spray nozzle 2 at 2 L/min were much lower than that in the cases using other nozzles at 2 L/min. This is because nozzle 2 has a larger orifice diameter (1.7 mm) than that of the other two nozzles (1.2 mm) and the generated droplets have much lower velocity magnitudes than that of the other two nozzles at same spray injection flow rate. When the spray injection flow rate of nozzle 2 was increased to 3 L/min, the
and
in case 4 became slightly higher than that in the cases using other nozzles at 2 L/min. With a larger spray injection flow rate in case 4, more spray droplets were generated and thus interacted with aerosol particles with a larger contact surface comparing to that in case 10, resulting in the higher
and
values in case 4. While the
and
values in the cases using nozzles 1 and 3 were similar to each other. This can be explained as that: though the circulation period of the case using nozzle 1 was shorter than that using nozzle 3, the corresponding spray spread volume and water film area were also smaller, finally leading to similar
and
values in the cases using nozzles 1 and 3.
In the experimental cases with low and high concentration mist, the coagulated mist-aerosol particles had larger sizes and thus larger St values. These coagulated particles mostly concentrated on the vortex peripheries and cannot follow the fluid streamlines when the particle-laden gas changed flow direction sharply. They can be captured easily by accumulated spray water and water film. In the cases using nozzle 1, the droplet velocity magnitude was largest, leading to the largest St values of coagulated aerosol-mist particles. The largest St values together with the shortest circulation period in the cases using nozzle 1 resulted in the largest and
values among all cases using different nozzles. In the cases using nozzles 2 and 3, though the spray spread volume and the water film area were larger than that in the cases using nozzle 1, their circulation periods were 3.88 and 4.61 times of that using nozzle 1. And the gaseous entrainment contributed to aerosol removal during the whole spraying process, while the water film and accumulated spray water only worked for particles with large St values and these particles can be removed quickly at the beginning of spray injection process. In addition, according to , the solid lines refer to the aerosol removal amount by spray droplets, while the difference between solid line and corresponding dot symbols stand for the aerosol removal amount by other factors including the accumulated spray water and water film. It also shows spray droplets removed more aerosol particles than the accumulated spray water and water film did. Therefore, the contribution of circulation period to aerosol removal became more important than that of water film and accumulated spay water. The combination of above factors explained why
and
in the cases with water mist.
5. Conclusions and prospects
To study the effect of spray properties on aerosol removal efficiency with water mist, three types of spray nozzles that can generate spray droplets with different size distributions, velocity magnitudes, and spray angles were used in our aerosol scavenging tests in the UTARTS facility. The global spray efficiency and the aerosol removal rate of different nozzles were compared by measuring the time evolution of aerosol size distribution during spraying. Also, numerical simulations of aerosol removal by three different nozzles without mist were conducted. The simulation results about the spray droplets, aerosol mass fraction, gas velocity vectors, particle Stokes number, water film, and gaseous circulation period were discussed to provide more information about the aerosol removal process by different spray nozzles.
The experimental results showed that mist aided in improving global spray efficiency and aerosol removal rate
for all three spray nozzles. However, the gaseous entrainment periods of three nozzles had the relationship as
With a shorter circulation period, the aerosol particles in the circulation region and entrainment region can be fed into the spray region at a faster rate, finally resulting in higher global spray efficiency
and aerosol removal rate
This indicates that the gaseous entrainment period is the dominant factor in determining
and
over other spray properties, such as accumulated spray water and water film.
The numerical model did not consider aerosol removal by accumulated spray water and water film, but it may happen in the experiments for particles with large St values. And the discrepancy about the time evolution of aerosol mass at different diameters between experiment and simulation results, especially for large particles with diameters approaching 1 μm, suggests the importance of the contribution of accumulated spray water and water film to aerosol particle capturing. It can be hypothesized that the coagulated mist-aerosol particles with large Stokes number cannot follow the gas flow when gas flow direction changed sharply and would be captured by the accumulated water and the water film.
An effective multi-nozzle spray system that consumes less spray water but can suppress more aerosol dispersion is required in the real Fukushima decommissioning. With understanding the aerosol removal process by different single spray nozzles, the combination of different nozzles can be employed to optimize the multi-nozzle spray system design and to improve the aerosol scavenging efficiency. For example, the spray nozzle with a narrow spray angle that generates high-speed spray droplets can be used in the middle of the containment vessel to cause strong vortex circulation, while the spray nozzle with a wide spray angle can be adopted near the vessel sidewalls to form the water film. The configuration of different spray nozzles at different locations, together with the new method of water mist, is expected to capture the coagulated aerosol-mist particle clusters at higher efficiency. The related experiments and simulations using a multi-nozzle spray system will be conducted in future.
| Nomenclature | ||
| Cmist | = | mist number concentration [P/cm3] |
| Cn(t) | = | aerosol number concentration at spraying time t [P/cm3] |
| dD | = | droplet diameter [m] |
| dP | = | aerosol particle diameter [m] |
| E | = | global spray efficiency [dimensionless] |
| N | = | number of fringes [dimensionless] |
| J | = | empirical factors [dimensionless] |
| K | = | empirical factors [dimensionless] |
| Pe | = | peclet number [dimensionless] |
| Qentr | = | gas entrainment flow rate from the outer spray area to the spray area [kg/m3] |
| R | = | ratio of aerosol diameter and spray droplet diameter, |
| Sfilm | = | water film area due to spray droplets impacting on vessel’s inner wall [m2] |
| Stot | = | total area of the vessel’s inner wall [m2] |
| St | = | stokes number [dimensionless] |
| t | = | water spraying time [s] |
| UD | = | droplet velocity [m/s] |
| UG | = | gas velocity [m/s] |
| Umax | = | maximum droplet velocity magnitude [m/s] |
| Vspray | = | spread volume of the water spray [m3] |
| Vtot | = | total volume of the vessel [m3] |
| αL | = | volume fraction of liquid phase [dimensionless] |
| σ | = | ratio of droplet dynamic viscosity to gas dynamic viscosity, |
| = | particle density [kg/m3] | |
| = | circulation period of gaseous entrainment by spray [s] | |
| = | aerosol removal rate [s−1] | |
| = | dynamic viscosity of air [kg/m/s] | |
Supplemental Material
Download MS Word (155.1 KB)Disclosure statement
The authors declare that the research was conducted in the absence of any commercial or financial relationships that could be construed as a potential conflict of interest.
Additional information
Funding
References
- Ardon-Dryer, K., Y. W. Huang, and D. J. Cziczo. 2015. Laboratory studies of collection efficiency of sub-micrometer aerosol particles by cloud droplets on a single-droplet basis. Atmos. Chem. Phys. 15 (16):9159–71. doi:10.5194/acp-15-9159-2015.
- Ali, M., C. Yan, Z. Sun, J. Wang, and H. Gu. 2013. CFD simulation of dust particle removal efficiency of a venturi scrubber in CFX. Nucl. Eng. Des. 256:169–77. doi:10.1016/j.nucengdes.2012.12.013.
- Brunel, M., and H. Shen. 2013. Design of ILIDS configurations for droplet characterization. Particuology 11 (2):148–57. doi:10.1016/j.partic.2012.06.014.
- Dépée, A., P. Lemaitre, T. Gelain, A. Mathieu, M. Monier, and A. Flossmann. 2019. Theoretical study of aerosol particle electroscavenging by clouds. J. Aerosol Sci. 135:1–20. doi:10.1016/j.jaerosci.2019.04.001.
- Diao, H., Y. Zhou, H. Gu, Y. Li, and C. Yan. 2020. Experimental study on the scrubbing efficiency of aerosols contained in horizontal and vertically downward submerged gas jet. Prog. Nucl. Energy 126:103406. doi:10.1016/j.pnucene.2020.103406.
- Finlay, W. H. 2001. The mechanics of inhaled pharmaceutical aerosols: An introduction. London, UK: Academic Press.
- Friedlander, S. K. 2000. Smoke, dust and haze: Fundamentals of aerosol dynamics. New York, USA: Oxford University Press.
- Gelain, T., E. Porcheron, Y. Leblois, I. Doyen, C. Chagnot, C. Journeau, and D. Roulet. 2020. Implementation and validation of an aerosol collection model by a spray in a CFD code: Application to the scavenging of aerosols released during laser cutting operations of fuel debris for the dismantling of the damaged reactors of Fukushima Dai-ichi. In 2020 International Conference on Nuclear Engineering Collocated with the ASME 2020 Power Conference (online conference). American Society of Mechanical Engineers Digital Collection. doi:10.1115/ICONE2020-16141.
- Glover, A. R., S. M. Skippon, and R. D. Boyle. 1995. Interferometric laser imaging for droplet sizing: A method for droplet-size measurement in sparse spray systems. Appl. Opt. 34 (36):8409–21. doi:10.1364/AO.34.008409.
- Greenfield, S. M. 1957. Rain scavenging of radioactive particulate matter from the atmosphere. J. Meteor. 14 (2):115–25. doi:10.1175/1520-0469(1957)014 < 0115:RSORPM>2.0.CO;2.
- Gupta, S., E. Schmidt, M. Freitag, G. Langerock, and F. Funke. 2017. Experimental investigations on containment spray performance under severe accident conditions. Paper presented at The 8rd European Meeting on Severe Accident Research (ERMSAR-2017), Warsaw, Poland, 16-18 May.
- Inter-Ministerial Council for Contaminated Water and Decommissioning Issues. 2015. Mid-and-long-term roadmap towards the decommissioning of TEPCO’s Fukushima Daiichi Nuclear Power Station. Accessed July 29, 2021. https://www.meti.go.jp/english/earthquake/nuclear/decommissioning/pdf/20170926_01a.pdf.
- Journeau, C., D. Roulet, E. Porcheron, P. Piluso, and C. Chagnot. 2018. Fukushima Daiichi fuel debris simulant materials for the development of cutting and collection technologies. J. Nucl. Sci. Technol. 55 (9):985–95. doi:10.1080/00223131.2018.1462267.
- Kaltenbach, C., and E. Laurien. 2018. CFD simulation of aerosol particle removal by water spray in the model containment THAI. J. Aerosol Sci. 120:62–81. doi:10.1016/j.jaerosci.2018.03.005.
- Krstic, M. 2006. Mixing control for jet flows. In Combustion processes in propulsion, ed. Gabriel D. Roy, 87. Burlington, USA: Elsevier Butterworth-Heinemann.
- Lemaitre, P., E. Porcheron, A. Nuboer, and G. Grehan. 2006. Interferometric Laser Imaging development for Droplets Sizing (ILIDS) in hostile environment. Paper presented at the 10th International Conference on Liquid Atomization and Spray Systems, Kyoto, Japan, August 27 - September 1.
- Li, B. S., Z. L. Ji, and L. Mei. 2010. An approach for correcting particle size distributions measured by the optical particle counter WELAS 2000. AIP Conference Proceedings 1207 (1): 686–689. doi:10.1063/1.3366449.
- Li, Y., Z. Sun, H. Gu, and Y. Zhou. 2019. Deposition characteristic of micro-nano soluble aerosol under bubble scrubbing condition. Ann. Nucl. Energy 133:881–8. doi:10.1016/j.anucene.2019.07.039.
- Liang, H., N. Erkan, V. Solans, and S. Suzuki. 2020. Numerical simulation and validation of aerosol particle removal by water spray droplets with OpenFOAM during the Fukushima Daiichi fuel debris retrieval. Front. Energy Res. 8:102. doi:10.3389/fenrg.2020.00102.
- Liang, H., Q. Zhou, N. Erkan, and S. Suzuki. 2021. Improvement of aerosol spray scavenging efficiency with water mist. J. Aerosol Sci. 153:105697. doi:10.1016/j.jaerosci.2020.105697.
- Liang, H., Q. Zhou, N. Erkan, S. Suzuki, Y. Leblois, T. Gelain, and E. Porcheron. 2020. Effect of containment vessel’s size scale on the aerosol spray scavenging efficiency with water mist. In International Conference on Nuclear Engineering, Vol. 83761, V001T04A006. American Society of Mechanical Engineers. doi:10.1115/ICONE2020-16338.
- Mölter, L., and P. Keßler. 2004. Partikelgrößen-und partikelanzahlbestimmung in der außenluft mit einem neuen optischen aerosolspektrometer. Gefahrstoffe Reinhalt. Luft 64 (10):439–47.
- Murata, K. K., D. C. Williams, R. O. Griffith, R. G. Gido, E. L. Tadios, F. J. Davis, G. M. Martinez, K. E. Washington, and J. Tills. 1997. Code manual for CONTAIN 2.0: A computer code for nuclear reactor containment analysis. No. NUREG/CR–6533. Nuclear Regulatory Commission. doi:10.2172/569132.
- Nishio, S. 2008. Uncertainty analysis: Particle imaging velocimetry (PIV). ITTC–Recommended Procedures and Guidelines.
- Nuclear Damage Compensation and Decommissioning Facilitation Corporation. 2016. Technical strategic plan 2016 for decommissioning of the Fukushima Daiichi Nuclear Power Station of Tokyo Electric Power Company Holdings. Accessed July 29, 2021. https://www.dd.ndf.go.jp/files/topics/449_ext_02_1.pdf.
- Pak, S. I., and K. S. Chang. 2006. Performance estimation of a Venturi scrubber using a computational model for capturing dust particles with liquid spray. J. Hazard. Mater. 138 (3):560–73. doi:10.1016/j.jhazmat.2006.05.105.
- Park, S. H., C. H. Jung, K. R. Jung, B. K. Lee, and K. W Lee. 2005. Wet scrubbing of polydisperse aerosols by freely falling droplets. J Aerosol Sci. 36 (12):1444–58. doi:10.1016/j.jaerosci.2005.03.012.
- Porcheron, E., P. Lemaitre, D. Marchand, W. Plumecocq, A. Nuboer, and J. Vendel. 2010. Experimental and numerical approaches of aerosol removal in spray conditions for containment application. Nucl. Eng. Des. 240 (2):336–43. doi:10.1016/j.nucengdes.2008.08.023.
- Porcheron, E., S. Peillon, T. Gelain, C. Chagnot, C. Journeau, and D. Roulet. 2018. Analysis of aerosol emission and dispersion during the laser cutting of Fukushima fuel debris simulants. In 2018 26th International Conference on Nuclear Engineering. American Society of Mechanical Engineers Digital Collection. doi:10.1115/ICONE26-81531.
- Powers, D. A., and S. B. Burson. 1993. A simplified model of aerosol removal by containment sprays (No. NUREG/CR-5966; SAND-92-2689). Nuclear Regulatory Commission, Washington, DC. Div. of Safety Issue Resolution; Sandia National Labs, Albuquerque, NM. doi:10.2172/6503368.
- Pruppacher, R. H., and J. D. Klett. 1997. Microphysics of clouds and precipitation, Vol. 18. Kluwer Academic Publishers. Dordrecht, Netherlands: Atmospheric and Oceanographic Sciences Library.
- Raffel, M., C. E. Willert, F. Scarano, C. J. Kähler, S. T. Wereley, and J. Kompenhans. 2018. Particle image velocimetry: A practical guide. Cham, Switzerland: Springer.
- Rosati, B., G. Wehrle, M. Gysel, P. Zieger, U. Baltensperger, and E. Weingartner. 2015. The white-light humidified optical particle spectrometer (WHOPS)—A novel airborne system to characterize aerosol hygroscopicity. Atmos. Meas. Tech. 8 (2):921–39. doi:10.5194/amt-8-921-2015.
- Sumiyoshitani, S., T. Okada, M. Hara, and M. Akazaki. 1984. Direct observation of the collection process for dust particles from an air stream by a charged water droplet. IEEE Trans. Ind. Appl. IA-20 (2):274–81. doi:10.1109/TIA.1984.4504408.
- Sun, H., Y. Leblois, T. Gelain, and E. Porcheron. 2020. Experimental study on aerosol collection by spray droplets: Application to fission products removal in containment. In International Conference on Nuclear Engineering, Vol. 83785, V003T13A050. American Society of Mechanical Engineers. doi:10.1115/ICONE2020-16857.
- Wang, A., Q. Song, and Q. Yao. 2015. Behavior of hydrophobic micron particles impacting on droplet surface. Atmos. Environ. 115:1–8. doi:10.1016/j.atmosenv.2015.05.053.
- Wang, L. P., A. S. Wexler, and Y. Zhou. 1998. Statistical mechanical descriptions of turbulent coagulation. Phys. Fluids 10 (10):2647–51. doi:10.1063/1.869777.
- Yang, H., and C. J. Hogan, Jr. 2017. Collision rate coefficient for charged dust grains in the presence of linear shear. Phys. Rev. E. 96 (3-1):032911. doi:10.1103/PhysRevE.96.032911.
- Zhang, X., N. Erkan, K. Okamoto, and H. Liang. 2019. Effects of ultrafine bubbles on the aerosols removal efficiency due to pool scrubbing. In The Proceedings of the International Conference on Nuclear Engineering (ICONE) 2019.27, 2022. The Japan Society of Mechanical Engineers. doi:10.1299/jsmeicone.2019.27.2022.
- Zhou, Y., Z. Sun, H. Gu, and H. Yu. 2020. Development of structural optimization design method for multilayer metal fiber filter in nuclear power plant. Prog. Nucl. Energy 124:103361. doi:10.1016/j.pnucene.2020.103361.
- Zuo, Z., J. Wang, Y. Huo, H. Liu, and R. Xu. 2016. Particle motion induced by electrostatic force of a charged droplet. Environ. Eng. Sci. 33 (9):650–8. doi:10.1089/ees.2015.0470.
Appendix A.
Numerical model of aerosol removal by spray in OpenFOAM
This is a brief summary of the numerical model of aerosol removal by spray droplets implemented into OpenFOAM. Please refer to Liang, Zhou et al. (Citation2020) and Liang, Erkan et al. (Citation2020) for more details.
A.1 Eulerian method for particle-laden gas
The total mass balance equation and momentum transport equation for the continuous particle-laden gas can be written as:
(A1)
(A1)
(A2)
(A2)
where, ρ is gas density, t is time,
is gas velocity,
is the sink term to model aerosol removal by spray droplets,
is the pressure,
is the gravitational acceleration,
is the momentum source term induced by the spray droplets.
The submicron aerosol particles with diameters from 0.2 to 1.0 μm are treated as different species in gas phase. The diffusion and convention of all gas species phase are solved by a passive scalar transport equation as:
(A3)
(A3)
where,
is the mass fraction of
gas species (
),
is the total viscosity and is defined as the sum of laminar and turbulent viscosities, i.e.,
is nonzero only for aerosol particle species.
A.2 Lagrangian particle-tracking method for dispersed spray droplets
In the Lagrangian particle-tracking method, spray nozzle injects numerous droplet parcels, and each parcel consists of a group of physical droplets possessing equal characteristics (including size, velocity, temperature, etc.). The motion of a single droplet is governed by Newton’s second law and can be written as:
(A4)
(A4)
where,
is droplet mass,
is droplet velocity,
is drag force from continuous phase,
is gravity force,
is droplet diameter,
is the drag coefficient,
is droplet density, and
is Reynolds number of spray droplets.
A.3 Aerosol removal by spray droplets
The mass variation rate of a single droplet caused by capturing gas species can be calculated as:
(A5)
(A5)
(A6)
(A6)
(A7)
(A7)
where,
is the droplet mass increase due to capturing of
gas species,
is total collection efficiency of
gas species by a single droplet,
is the molar concentration of
gas species around the droplet, and
is the molecular weight of
gas species. The empirical formula of the aerosol removal efficiency by a single droplet for inertial impaction
interception
and Brownian diffusion
are listed in (Park et al. Citation2005; Powers and Burson Citation1993).
Table A1. Empirical formula of aerosol removal efficiency by a single droplet.