
 ?Mathematical formulae have been encoded as MathML and are displayed in this HTML version using MathJax in order to improve their display. Uncheck the box to turn MathJax off. This feature requires Javascript. Click on a formula to zoom.
Abstract
Not much research has been done on the detachment of deposit structures from fibers in gas flow. This study presents two approaches to determine the fluid velocities uc required for detachment. The first is an analytical model based on the imbalance of drag and adhesive forces. With the help of available models in literature two curves for uc as a function of deposit diameter were calculated. The two curves represent the different conditions present in a deposited structure, consisting of a mixture of reactive and inert matter, before and after reaction. It approximates the structure by one sphere, that consists of two identical half spheres, of which one detaches due to drag. The second approach is a CFD model, in which the deposited particle structure is represented through an immersed boundary method (IBM). It calculates adhesive forces based on the van der Waals force between two half-spaces, while drag is directly evaluated from flow properties at the structure’s surface. To be comparable with the analytical approach, it also approximates the deposit with two half spheres. The models are capable of describing detachment velocity behavior as a function of deposit structure size and porosity as reported in literature.
Copyright © 2021 American Association for Aerosol Research
EDITOR:
1. Introduction
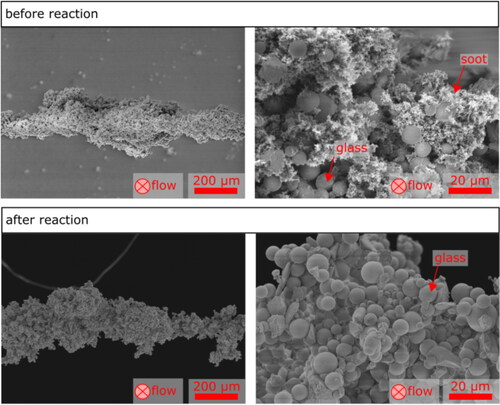
The filtration of particles may lead to large deposits on filter fibers. Zoller et al. (Citation2021) reported on deposition of soot and glass () particles on fibers. An example of such deposits can be seen in . It was found that increasing the velocity of the gas flow leads to a break-up/detachment of deposited structures. Detachment velocities have been measured at different temperatures, which correspond to different deposit porosities, due to the reaction of soot. One observation was that an increase in structure porosity, caused by the reaction of soot, leads to a reduction of detachment velocity. Previous measurements performed by Löffler (Citation1972) have shown that small individual glass spheres require flow velocities above
to be detached, while for larger structures of the same spheres the onset of detachment is at
Figure 1. Pictures of particle structures before and after reaction taken with a scanning electron microscope by Zoller et al. (Citation2021).
Numerical simulations of detachment are mostly related to the calculation of particle deposition where the possibility of detachment or re-entrainment is included to account for lower deposition rates at greater loading velocities (Przekop and Gradoń Citation2008; Li and Marshall Citation2007; Weber Citation2016). So while simulations exist that incorporate detachment as a part of the researched topic, none are known to the authors which would simulate the detachment of larger structures based on surface resolved forces. However, simulations are beneficial to the understanding of the underlying mechanisms of particle structure detachment, as simulations allow for a noninvasive analysis of the structure with respect to its geometry and porosity and enable a more time-resolved description of the detachment process. A validated model for structure detachment can then calculate parameter variations of individual variables, while keeping the remaining parameters constant, thereby finding the optimum for a given process in a more controlled environment than in experimental measurements.
The adhesion of two objects can be mainly attributed to interlocking, material bridges between contacts and surface and field forces at direct contact (Tomas Citation2006). In the absence of interlocking, material bridges and electrostatic charges the adhesion of deposit structures is dominated by the van der Waals forces. For two parallel half-spaces Hamaker (Citation1937) describes the van der Waals force per area A as
(1)
(1)
where H is the Hamaker constant, a the distance between both half-spaces and A the contact area. Although half-spaces are not of finite thickness, EquationEquation (1)
(1)
(1) can still be applied to thick enough plates, because force contributions of atoms further than
away from the surface can be neglected (Israelachvili Citation1994; Haarmann Citation2016). Experiments regarding the van der Waals force between spheres and a flat surface by Schaefer et al. (Citation1995) have shown, that the measured force differed from theory by a factor of 40 − 178. Glass spheres in particular depicted an adhesive force 56 and 51 times smaller for substrates consisting of mica and highly oriented pyrolitic graphite, respectively. The reduction in force was attributed to surface irregularities and non-sphericity of particles.
In this study an analytical and a numerical simulation model for larger deposit detachment will be presented. The analytical model considers glass and soot particles for the calculation of detachment velocities, including the change of adhesion due to high temperatures. Literature models are used to determine drag and adhesive forces. The latter are reduced based on previous reports in literature. The simulations employ glass as the only constituent of the deposits. A corrective factor to adjust for surface irregularities is employed, while adhesion and drag are directly calculated at the structure’s surface. Both models assume that deposited structures do not completely detach from the fiber. Instead, some residual particles will always remain on the fiber as reported in literature (Poggemann, Meyer, and Dittler Citation2021; Zoller et al. Citation2021). This can be further supported through theoretical consideration of the Van der Waals force which is stronger between the large cylindrical fiber and the spherical particles than between the spherical particles inside the structure.
2. Analytical detachment model
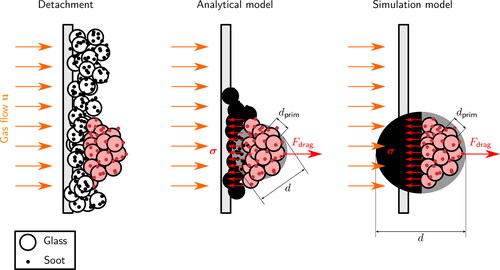
A simple model () was developed to calculate the velocity uc necessary for local detachment of particulate agglomerates of different sizes d. An agglomerate detaches if the drag force of the air flow exceeds the adhesion force
of the particulate structure caused by the adhesive forces between the particles:
(2)
(2)
Figure 2. Schematic picture of the agglomerate detachment from the fiber together with the analytical model reduction and the model used in the simulations. The black regions in the models represent the part of the deposited structure that will remain at the fiber after detachment has occurred. In the case of the simulation model this region can theoretically extend further along the fiber, but because those particles would not contribute to the adhesive force of the detaching structure they have been omitted in the figure. The gray regions (sphere in the analytical model, half sphere in the simulation) are the approximations of the detaching red particle structure. Both models only consider forces acting on those approximations.
The drag and adhesive force must be calculated in order to evaluate the velocity necessary for detachment. For the calculation of the drag force, three assumptions are made. The first assumption is that the deposited and later detached particle agglomerate is spherical and hence its drag coefficient cD can be calculated according to Martin (Citation1980). The second assumption is that the relative velocity between the adherent particle structure and the gas flow is equal to the free flow velocity u0. The third assumption is that no vortex shedding occurs, which would cause dynamic strain on the particle structure. The third assumption may cause deviations of the simple model from experimental results at higher flow velocities. With these assumptions the following equations can be used to calculate the drag force:
(3)
(3)
(4)
(4)
In these equations ν denotes the kinematic viscosity of the gas and ρf its density. An additional consideration of the porosity of the particle structure would cause a reduction (Singh and Gupta Citation1971) and the consideration of the form of the structure may cause an increase of the drag force (Hölzer and Sommerfeld Citation2008). Both effects are neglected in this model.
The total adhesion force of the potentially detaching agglomerate can be calculated using the following equation:
(5)
(5)
The theoretical stress necessary for the break up of the particle structure can be calculated according to Rumpf (Citation1970):
(6)
(6)
where ϵ denotes the porosity of the structure,
the corrected adhesion force between the primary particles in the structure (explained later in EquationEquation (14)
(14)
(14) ) and
the primary particle diameter. The difference between d and
can be seen in the model reduction of . EquationEquation (6)
(6)
(6) usually overpredicts the breaking stress, therefore a correction factor
of 10 (Schubert Citation1975) is used to consider this overprediction. The corrected breaking stress is:
(7)
(7)
As mentioned in the introduction as adhesive forces only van der Waals forces are regarded. In literature there are two common models to calculate van der Waals forces, which are the model of Derjaguin, Muller, and Toporov (Citation1975) (DMT-model) for hard materials and the model of Johnson, Kendall, and Roberts (Citation1971) (JKR-model) for soft materials. Which model is more appropriate for a certain application can be evaluated using a set of dimensionless parameter Π, K and R proposed by Tsai, Pui, and Liu (Citation1991):
(8)
(8)
(9)
(9)
(10)
(10)
(11)
(11)
In these equations, ψi denotes the Possion’s ratio, Ei the Young’s modulus of material i, di the diameter of half i of the deposited structure, a0 the minimum distance at contact, the contact energy of adhesion, R the combined radius and K the composite Young’s modulus. If
the DMT theory is more appropriate and if
the JKR theory is valid. If Π is calculated for all combinations of steel, soot (graphite) and glass (
) using the values from literature summarized by Tsai, Pui, and Liu (Citation1991) and listed in , the maximum value of Π is 0.28 for the steel-
contact. This indicates that the DMT-model is the most appropriate. The highest force for tear off according to the DMT-model is the same as the one calculated by Hamaker, therefore the well-known adhesion force according to Hamaker is used in this model:
(12)
(12)
where
is the Hamaker constant between two materials i and j. It can be calculated as (Eichenlaub, Chan, and Beaudoin Citation2002):
(13)
(13)
Table 1. Parameters used in the theoretical model.
The real contact distance a0 in this system is unknown and strongly depends on surface roughness. In this study we use a common and small contact distance of (Götzinger and Peukert Citation2004) and a correction factor
to consider the surface roughness.
is approximately 50 for
glass spheres and goes up to 175 for polystyrene or tin particles on mica or graphite substrates according to Schaefer et al. (Citation1995). The glass spheres used in the study by Zoller et al. (Citation2021) have a surface weighted mean diameter of
and are therefore comparable to the particles used by Schaefer et al. (Citation1995). Soot agglomerates in Zoller’s investigation are not comparable to the particles used by Schaefer, because of the small surface weighted mean diameter of
of the soot. However, the soot agglomerates are not spherical and consist of a fractal structure of even smaller primary particles resulting in higher surface roughness.
If high temperatures occur they can enhance adhesion forces due to elastic deformation, plastic deformation, sintering, viscoelastic flattening and surface reactions (Berbner and Löffler Citation1994). A fitting factor fT is used to consider the influence of temperature on adhesion force in this model. The corrected adhesion force is
(14)
(14)
The velocity just before detachment of a particulate structure with a certain size can be calculated from EquationEquation (2)(2)
(2) using an iterative method, which minimizes —F˙drag - F˙vdW—. The resulting equation for calculation of the Reynolds number Re and hence the flow velocity at force equilibrium is:
(15)
(15)
(16)
(16)
Two cases were calculated. Case one is without reaction, which means that soot and glass () are both present in the deposited structure. The case uses a mean diameter of glass and soot particles equal to
as the primary particle diameter
The porosity used for case one is the porosity of a soot filter cake measured by Kim et al. (Citation2009). Because it is not known which particles are in contact (in the region of the detachment), the used Hamaker constant was calculated as the average of the three possible contacts: soot-soot, glass-glass and glass-soot. The fit factor fT for the temperature influence on the adhesion force is 1 because no high temperatures occur in this case. The parameters used for calculation of case one are shown in .
Case two is with reaction at a temperature of It assumes that all soot vanished from the deposited structure due to oxidation. Hence the primary particle diameter used in this case is the diameter of the glass spheres and the chosen Hamaker constant applies for a glass-glass contact. Here the porosity is set to 0.975 in accordance to Zoller’s assumption for the deposited structure after reaction (Zoller et al. Citation2021). The fit factor fT for the temperature influence on the adhesion force has been set to 20 for the case of increased temperature, because amongst the investigated integer fit factors this yielded the best accordance with the experimental data. Further, Berbner and Löffler (Citation1994) describe the increase in adhesive force for a
gold particle by a factor of 10 after it has been heated to
As this is of the same order as the fitted parameter fT it appears to be a legitimate choice. The parameters used in the calculation of the second case are shown in as well. After the reaction the deposited structure’s values for the surface weighted mean diameter, the Hamaker constant, the fit factor for temperature and the porosity have changed, hence these parameters contain the words “after reaction” in their description.
3. Simulation model
The analytical model made assumptions relating to the drag coefficient of the deposited structure and the reduction of adhesive forces. In an effort to reduce the amount of necessary assumptions a new simulation model is introduced. It directly calculates the drag forces acting on the surface of the structure, as well as the adhesive forces acting in the contact plane between both halves. A validation of this approach would allow for detachment calculations of more complex deposited geometries, for which no analytical formulation of the drag force is available. All simulations are calculated in the Open Source CFD code OpenFOAM® version 5.0. However, OpenFOAM® can only take care of the fluid phase, therefore to determine the adhesive forces between structure components and to calculate fluid forces acting on them an additional tool is required. These calculations of the solid phase are handled by the in-house developed immersed boundary method ABSFoam, which will be described later.
3.1. Geometry of the model
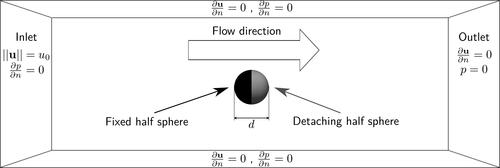
The simulation’s approach to deposited structure detachment is similar to the one used for the analytical model. The structure does not consist of multiple particles, but instead it is made up of two identical half spheres with diameter d. This simplification is necessary, because the exact shape of detaching structures measured by Zoller et al. (Citation2021) is unknown. In theory the adhering half could have any sufficiently thick shape as long as the contact plane remains flat because the simulation’s adhesive forces are only calculated directly at the surface. Furthermore the assumption of a spherical shape lends itself to a valid comparison with the analytical model which uses sphere drag in its detachment calculation. In order to keep the calculations simple the fiber is not present in the simulation, as for larger deposit sizes the mesh would require significant refinement to correctly represent the fiber’s influence on the flow. The half sphere representing the part of the structure, which remains attached to the fiber, is instead constrained in its degrees of freedom forcing it to stay in position. The domain size in deposited structure diameters d is 24d perpendicular to flow and 72d in flow direction. A schematic illustration of the domain is given in together with its boundary conditions. The two identical half spheres are positioned at the center of the computational grid with their flat sides facing each other at a normal distance of a0 between their surfaces. The half sphere geometry has been scaled to achieve diameters of 40, 80, 160 and and the domain has been scaled accordingly.
Figure 3. Numerical domain with deposited structure (depicted 6 times larger) at its center. Boundary conditions at the front and back of the domain are identical to those on top and at the bottom. The partial derivative calculates the gradient in surface normal direction.
3.2. Assumptions and constraints
The following assumptions and constraints were made to limit computational resources:
Fluid: the fluid is considered to be incompressible and Newtonian. The flow is laminar and until the onset of detachment steady state.
Half spheres: the halves are treated as rigid and therefore no deformations take place. They are completely solid, which means that their porosity has no effect on the flow and is only considered in the adhesive force calculations. Surface elements in the halves’ contact region are flat, but irregularities are considered within the calculated adhesion through a corrective factor.
Fixed half sphere: the upstream half sphere is kept at a constant position. To achieve this its translational and angular velocity is kept at 0.
3.3. Equations governing the fluid phase
The fluid phase is governed by two equations. The incompressible continuity equation
(17)
(17)
and the momentum balance
(18)
(18)
with fluid velocity u, time t, kinematic viscosity ν and kinematic pressure p.
3.4. Implementation of the immersed boundary method
The implemented immersed boundary method can be separated into three distinct parts:
geometry part
fluid part
coupling part.
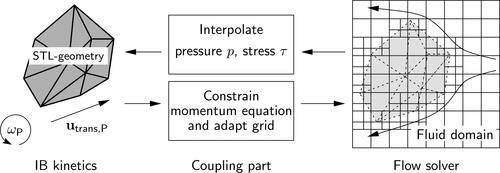
The geometry part handles everything, which directly concerns the immersed body (IB). This includes its physical properties, six degrees of freedom model rigid body movement, contact dynamics like collisions and adhesion. Further this part also takes care of the actual objects creation and destruction. The IB’s geometry is provided as a triangulated surface grid, usually in the STL file format and can be of any arbitrary shape. The fluid part solves the fluid equations as described in Section 3.3 without any particular knowledge of the solid phase, treating everything as fluid. This task can be mostly done by any of the flow solvers, that come directly with the OpenFOAM® toolkit, without further modification. Both parts are linked through the coupling part. To determine the force and torque acting on the IB, this part interpolates the fluid pressure p and the viscous stress tensor τ from the fluid to the face centers of the geometry’s surface elements. A subsequent integration of those values over the IB’s surface yields the IB’s force
and torque
where the subscript “P” denotes variables relating to the immersed boundary:
(19)
(19)
(20)
(20)
where n is the outward pointing surface normal and
the IB’s center of gravity. Based on these forces and torque the geometry part calculates an update of the IB’s motion state. Therefore a six degrees of freedom model is applied to perform the rigid body motion. On the other hand the existence or even the movement of the IB takes affect on the fluid’s momentum. This feature is realized by modifying the momentum equation of the Navier-Stokes equations so that the solved fluid velocity is identical to the IB velocity field
wherever the fluid is occupied by that IB:
(21)
(21)
with the particle velocity field
defined as
(22)
(22)
where
is the translational and
the angular velocity of the IB. The interplay of all three parts is illustrated in . A more detailed description of the implementation of the IBM with several validation cases can be found in Bürger (Citation2020).
Figure 4. Bidirectional coupling between IB and fluid domain in ABSFoam.
3.5. Model for adhesive force calculation
As introduced in the previous section, the IB is represented through its surface, which consists of connected triangular elements. For each surface element the adhesive force is calculated individually as given through EquationEquation (1)(1)
(1) . The total van der Waals force acting on one half of the structure then is
(23)
(23)
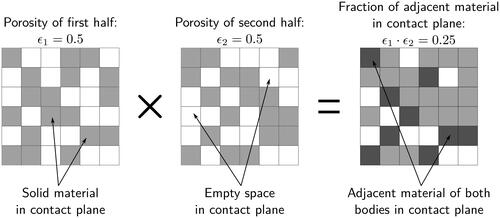
where n is the total number of surface elements and Ai and ai are each element’s area and distance to the other half of the structure, respectively. The validity of this approach with an extension to curved surfaces has already been demonstrated (Braschke and Janoske Citation2018). The correction factor k is used to adjust the magnitude of force based on material porosity. To derive k a purely probabilistic approach including porosities ϵ1 and ϵ2 of both halves is used. The assumption is that only components directly in contact distance result in a relevant contribution to the adhesive force (with
). The material porosity leads to empty regions in the contact plane between both halves, thereby reducing the effective contact surface area of one half to
(24)
(24)
This behavior is illustrated in , where both halves have a porosity of Under the assumption of a homogeneous porosity the ratio of solid and empty space in the depicted contact plane should also be equal to 0.5. Combining both distributions shows how the actual fraction of overlapping solid region in the contact plane is then equal to
With the assumption that regions, which do not directly overlap, yield negligible contributions to the adhesive force the total effective contact area can be written as
(25)
(25)
resulting in EquationEquation (23)
(23)
(23) 's corrective factor
(26)
(26)
where fR is an additional reduction factor, which considers possible surface irregularities as described by Schaefer et al. (Citation1995). Deposit structures cannot move closer than the contact distance a0. Further it is assumed that after initiation of detachment no direct reattachment can occur, as this would imply a force opposing flow direction, which is not the adhesive force. Therefore EquationEquation (23)
(23)
(23) can be rewritten as
(27)
(27)
Figure 5. Porosity based calculation of corrective factor k.
3.6. Material parameters
In all simulations the Hamaker constant valid for a glass-glass contact, is used (Dahneke Citation1972). Because the Hamaker constant for a soot-soot and combined soot-
contact is larger, it is valid to assume that in such a case the simulations would yield a higher detachment velocity. Fluid is considered to be air (incompressible) with density
and kinematic viscosity
Any effects of gravity have been neglected. Based on reduced adhesive forces as determined by Schaefer et al. a force reduction factor of fR = 50 has been chosen for the simulations. Contact distance a0, porosity ϵ and inlet velocity u are varied according to and detachment velocities are determined.
Table 2. Parameter variations used for the simulations.
4. Results and discussion
shows the detachment velocity uc as a function of structure diameter d for both approaches and compares them to measurements by Zoller et al. (Citation2021). The measured diameters are based on an optical evaluation of the projected area of detached structures. This area is then used to calculate the diameter of a sphere with an identical projected area. In contrast to this the diameter used in the analytical model and numerical simulations is the actual geometrical diameter of the spherical structure. A porosity of in the first plot corresponds to measurements by Zoller without any reaction taking place, therefore the analytical model utilizes parameters from described as “before reaction.” Here the analytical model is generally in better agreement with the experimental data. At lower structure diameters the simulated detachment velocities are much larger than in the measurements, although the employed Hamaker constant is that of
and not of soot, which would be larger and should therefore increase uc even further.
Figure 6. Detachment velocities as determined by simulations and two evaluations with the analytical model compared to measurements by Zoller et al. (Citation2021) with and without reaction.
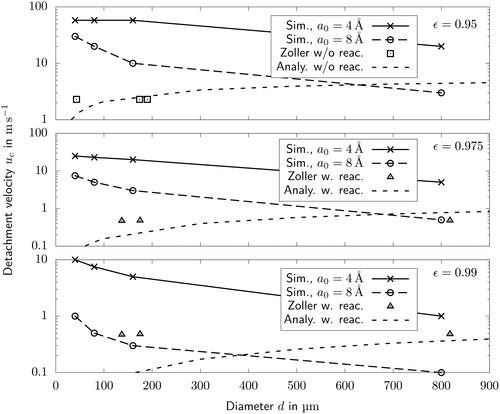
Plots with simulated porosities and
represent cases after a reaction has taken place and the parameters applied in the analytical model are marked as “after reaction.” With
the analytical results approximate the measurements very well, while the simulations are roughly one order larger at low structure diameters and in good agreement for
However, this is only the case for simulations with a contact distance twice as large as commonly assumed. Simulations with
still exhibit large deviations from measurements. Increasing porosity to 0.99 yields significantly better results for larger d and
however, smaller structure diameters still require
to be in agreement with available data.
It is clear that porosity and contact distance have a vast impact on uc, but it is unclear to what extent the measured values of ϵ and a0 are applicable to any section of the deposit structure, in particular to the plane at which detachment occurs. Consequently the theoretical model is more reliable at predicting detachment velocities of structures with lower porosity, because the break up stress model of Rumpf (Citation1970) is based on a statistical distribution of contact points between structure constituents. The assumption regarding contact points gains statistical confidence for an increasing amount of deposited material or for the case of decreasing porosity. This behavior is also reflected in the relatively good agreement of the theoretical model with measurements for the case of larger detachments with The same reasoning explains why the disagreement between analytical model and measurements increases for small diameters at porosities of
and
as the statistical approach becomes less reliable. The simulation model on the other hand does also employ a statistical model for the reduction of the adhesive force, but it reduces the effective adhering area of the flat contact plane instead of taking the spherical geometry of primary particles into account. This can lead to a significant overestimation of detachment velocities at lower porosities like
where the assumption of a uniform flat contact leads to larger adhesive forces than a contact between two spheres. While the contact is still considered flat for the case of
it is more effective at describing the average mass distribution in the contact plane independent of particle shape and contact state, thereby yielding more accurate results than the analytical model.
Overall both, the analytical model and the simulation, appear capable of describing some of the detachment phenomena. Their most obvious difference is the behavior of the curves with change of diameter. Simulation’s predicted increase of uc at low d agrees more with investigations by Löffler (Citation1972), but contradicts measurements of Zoller et al. (Citation2021), which show almost no variation of uc over a range of diameters. Comparing EquationEquations (27)(27)
(27) and Equation(15)
(15)
(15) it shows that the analytical model and the simulation model have an adhesive term, which is proportional to the surface area or d2. Therefore the difference must originate from the calculation of drag. Here the used approximation (EquationEquation (3)
(3)
(3) ) for the drag coefficient overestimates the drag force at lower deposit diameters yielding lower critical velocities. As the formulation becomes more precise for larger deposits the critical velocities approach those of the simulations, which do not employ any model for cD, but directly calculate the force acting on the half sphere from pressure and viscous stress (EquationEquation (19)
(19)
(19) ). Another difference between both approaches is the factor by which the adhesive force is reduced (not considering further contributions of porosity). While the theoretical model decreases the adhesive force by
the numerical simulations just use fR = 50 to account for surface irregularities. This was done, because the simulations only considered
-spheres as deposit constituents, while the analytical model included soot particles, whose small size corresponds more to surface irregularities with
5. Conclusion
Two approaches for determining the detachment velocity uc of deposit structures have been presented and compared to measurements. Depending on structure porosity and assumed contact distance both can approximate uc relatively well. More experimental data at smaller structure diameters could clarify the slope of uc as a function of d in a region where analytical model and simulations deviate the most. Further measurements at similar diameters would be of interest, in order to determine how much local variations of porosity might influence detachment velocities. Both approaches assume a spherical deposit geometry, which for most experiments should not be the case. Here the immersed boundary method opens up further possibilities for investigations of irregular shapes, where models for cD are not readily available. Moreover the adhesion model employed in simulations could be adjusted to use the van der Waals force formulation between spheres instead of half spaces. This would be closer to measurements, as most structure components are of spherical shape, and is expected to further reduce adhesion and thereby uc as well.
Additional information
Funding
References
- Berbner, S., and F. Löffler. 1994. Influence of high temperatures on particle adhesion. Powder Technol. 78 (3):273–80. doi:10.1016/0032-5910(93)02798-F.
- Braschke, K., and U. Janoske. 2018. Eine Immersed Boundary Methode zur Berechnung komplexer Partikelinteraktionen für volumetrisch aufgelöste Partikel. In NAFEMS: Neue Methoden in der numerischen Strömungsberechnung (CFD) – Alternativen zu Finite-Volumen-Methoden? Wiesbaden, Germany, November 12 and 13, 2018.
- Bürger, M. 2020. An immersed boundary method for arbitrarily shaped lagrangian bodies. PhD thesis, Bergische Universität Wuppertal.
- Dahneke, B. 1972. The influence of flattening on the adhesion of particles. J. Colloid. Interface. Sci. 40 (1):1–13. doi:10.1016/0021-9797(72)90168-3.
- Derjaguin, B. V., V. Muller, and Y. Toporov. 1975. Effect of contact deformations on the adhesion of particles. J. Colloid Interface Sci. 53 (2):314–26. doi:10.1016/0021-9797(75)90018-1.
- Eichenlaub, S., C. Chan, and S. Beaudoin. 2002. Hamaker constants in integrated circuit metalization. J Colloid Interface Sci. 248 (2):389–97. doi:10.1006/jcis.2002.8241.
- Götzinger, M., and W. Peukert. 2004. Particle adhesion force distributions on rough surfaces. Langmuir 20 (13):5298–303. doi:10.1021/la049914f.
- Haarmann, A. 2016. Haftmoment im Partikel-Wand Kontakt - Simulation und Messung des Haftmomentes in gasförmiger Umgebung. PhD thesis, Bergische Universität Wuppertal.
- Hamaker, H. 1937. The london—van der waals attraction between spherical particles. Physica 4 (10):1058–72. doi:10.1016/S0031-8914(37)80203-7.
- Hölzer, A., and M. Sommerfeld. 2008. New simple correlation formula for the drag coefficient of non-spherical particles. Powder Technol. 184 (3):361–5. doi:10.1016/j.powtec.2007.08.021.
- Israelachvili, J. N. 1994. Intermolecular and surface forces. London: Academic Press.
- Johnson, K., K. Kendall, and A. Roberts. 1971. Surface energy and the contact of elastic solids. Proc. R. Soc. Lond. 324:301–13. doi:10.1098/rspa.1971.0141.
- Kelly, A. 1973. Werkstoffe hoher Festigkeit. Werkstoffkunde, Bd. 4. Braunschweig: Springer Vieweg.
- Kim, S. C., J. Wang, W. G. Shin, J. H. Scheckman, and D. Y. H. Pui. 2009. Structural properties and filter loading characteristics of soot agglomerates. Aerosol Sci. Technol. 43 (10):1033–41. doi:10.1080/02786820903131081.
- Li, S.-Q., and J. S. Marshall. 2007. Discrete element simulation of micro-particle deposition on a cylindrical fiber in an array. J. Aerosol Sci 38 (10):1031–46. doi:10.1016/j.jaerosci.2007.08.004.
- Löffler, F. 1972. Abblasen von an Filterfasern abgeschiedenen Feststoffteilchen. Verfahrenstechnik 6:3–7.
- Martin, H. 1980. Wärme- und Stoffübergang in der Wirbelschicht. Chem. Ing. Tech. 52 (3):199–209. doi:10.1002/cite.330520303.
- Poggemann, L., J. Meyer, and A. Dittler. 2021. A novel method to investigate detachment of particulate structures from an elastic single fiber at low gas flow velocities. J. Aerosol Sci. 156:105785. doi:10.1016/j.jaerosci.2021.
- Przekop, R., and L. Gradoń. 2008. Deposition and filtration of nanoparticles in the composites of nano and microsized fibers. Aerosol Sci. Technol. 42 (6):483–93. doi:10.1080/02786820802187077.
- Rumpf, H. 1970. Zur Theorie der Zugfestigkeit von Agglomeraten bei Kraftübertragung an Kontaktpunkten. Chem. Ing. Tech. 42 (8):538–40. doi:10.1002/cite.330420806.
- Schaefer, D., M. Carpenter, B. Gady, R. Reifenberger, L. Demejo, and D. Rimai. 1995. Surface roughness and its influence on particle adhesion using atomic force techniques. J. Adhes. Sci. Technol. 9 (8):1049–62. doi:10.1163/156856195X00897.
- Schubert, H. 1975. Tensile strength of agglomerates. Powder Technol. 11 (2):107–19. doi:10.1016/0032-5910(75)80036-2.
- Singh, M., and J. Gupta. 1971. The effect of permeability on the drag of a porous sphere in a uniform stream. Z Angew. Math. Mech. 51 (1):27–32. doi:10.1002/zamm.19710510103.
- Span, R. 2013. VDI-Wärmeatlas, chapter Trockene Luft, 196–217. Berlin, Heidelberg: Springer Vieweg.
- Tomas, J. 2006. Mechanics of particle adhesion. In Extended master version of J. Tomas, ed. K. L. Mittal, 183–229. Particles on Surfaces 8: Detection, Adhesion and Removal, VSP Utrecht (2003), and full version of review paper of CHISA event, Prague 2004, 2006. London: CRC Press.
- Tsai, C.-J., D. Pui, and B. Liu. 1991. Elastic flattening and particle adhesion. Aerosol Sci. Technol. 15 (4):239–55. doi:10.1080/02786829108959531.
- Visser, J. 1972. On Hamaker constants: A comparison between Hamaker constants and Lifshitz-van der Waals constants. Adv. Colloid Interface Sci. 3 (4):331–63. doi:10.1016/0001-8686(72)85001-2.
- Weber, J. 2016. Numerische Simulation von Transport- und Abscheideprozessen in der Gas-Feststoff-Filtration. PhD thesis, Universität Stuttgart.
- Zoller, J., A. Zargaran, K. Braschke, J. Meyer, U. Janoske, and A. Dittler. 2021. Experimental investigation of reactive-inert particulate matter detachment from metal fibres at low flow velocities and different gas temperatures. Aerosol Sci. Eng. 5 (1):21–7. doi:10.1007/s4181.0-020-00081-3.