?Mathematical formulae have been encoded as MathML and are displayed in this HTML version using MathJax in order to improve their display. Uncheck the box to turn MathJax off. This feature requires Javascript. Click on a formula to zoom.
Abstract
An accurate observational dataset of the size-resolved concentration of mineral dust particles in the atmosphere, hydrosphere, and cryosphere is needed for investigating the effect of mineral dust on the climate with earth system models. However, automated measurements of dust particles remain challenging due to the complexities of the physicochemical properties (e.g., shape and mineralogy) of individual dust particles and the difficulties in discriminating dust from other particulate components (e.g., black carbon). Here, we suggest the use of complex forward-scattering amplitude data obtained by the single particle extinction and scattering (SPES) method as a low-cost optical approach for identification and quantification of silicate (aluminosilicates + quartz) particles, the major particulate component of desert dust. We focus here on the submicron particle-size range to challenge the robust identification of wavelength or smaller scale dust solely according to the principle of elastic light scattering. The two-dimensional nature of the complex scattering amplitude data allows us to identify silicate-dominant particles in waterborne dust samples and discriminate them from light-absorbing particulate components (e.g., hematite). We demonstrate that the two-dimensional dataspace of the complex amplitude allows an accurate retrieval of the particle-size distribution of silicate particles thanks to the simultaneous retrieval of the particle’s effective refractive index. We discuss some notable differences in our results from those retrieved from conventional elastic light scattering approaches.
Copyright © 2022 American Association for Aerosol Research
EDITOR:
1. Introduction
Mineral dust aerosol emitted from desert and dried soil regions plays a crucial role in the climate system. Dust aerosol affects both shortwave and longwave radiation in the atmosphere (Liao and Seinfeld Citation1998; Sokolik and Toon Citation1996). Dust contributes a substantial fraction of global aerosol optical depth (Moosmüller et al. Citation2012; Satheesh and Moorthy Citation2005). Radiation perturbation by mineral dust can alter the atmospheric circulation and precipitation (Bangalath and Stenchikov Citation2015). Mineral dust acts as both cloud condensation nuclei and ice nucleating particles in the atmosphere, affecting the radiative properties and lifetime of clouds (Hoose and Möhler Citation2012; Murray et al. Citation2011). The structural iron embedded within the aluminosilicate minerals of dust aerosol is considered to act as a fertilizer for oceanic phytoplankton in high-nutrient, low-chlorophyll regions (Jickells et al. Citation2005; Journet et al. Citation2008). The climatically relevant particle size of dust aerosol ranges from ∼0.2 to ∼20 μm (Kok et al. Citation2017). Accurate observational constraint of the dust particle-size distribution within this size range is needed for evaluating the dust radiative forcing, which is a superposition of the negative forcing of fine dust and potentially positive forcing of coarse dust (Miller et al. Citation2006). Clay-sized dust (0.2 μm ≤ D ≤ 2 μm), which is usually minor in terms of mass, could be responsible for about half of the global dust aerosol optical depth (Kok et al. Citation2017). Clay-sized dust accounts for a substantial fraction of the total number concentration of desert dust in remote regions due to its longer lifetime, as is also evidenced from analyses of the Greenland ice core (Nagatsuka et al. Citation2021). An accurate measurement of particle-size distributions of desert dust has been technically challenging because of the inherent variety of physicochemical properties (e.g., shape, mineralogy) of individual particles and the need for robust discrimination from coexisting non-dust particles. A robust discrimination of desert dust from other particulate components in environmental samples can be even harder in the submicron particle-size range wherein combustion-originated particles (e.g., black carbon) can also be predominant.
Elastic light scattering (Hulst and van de Hulst Citation1981; Jones Citation1999; Xu Citation2015; Romanov and Yurkin Citation2021) has long been employed as a principle for low cost, field deployable, noninvasive fast measurements of the number concentration of particles as a function of particle size. Here, we focus our review of the conventional methods for dust measurement on those based on the principle of elastic light scattering, which is of direct relevance to our method.
Inline particle sensing based on the extinction of a light beam by single particles has been used for monitoring the size-resolved number concentration of water-insoluble particles in ice core samples (Ruth et al. Citation2002; Simonsen et al. Citation2018), and particles detected in the supermicron particle-size range have often been regarded as dust on the basis of tight correlation with non-sea-salt Ca2+ (Lambert et al. Citation2012). The assumption of dust for all the detected particles would be erroneous for submicron particle sizes in which the concentration of black carbon particles originating from natural wildfires and anthropogenic fossil fuel combustion would not be negligible (Kaspari et al. Citation2011; Zennaro et al. Citation2014).
Several attempts have been made to identify dust within the framework of elastic light scattering, utilizing the fact that most of the individual dust particles are nonspherical. The degree of depolarization of light scattered to the side or backwards has often been used as an optical proxy for dust identification (Sugimoto et al. Citation2002; Kobayashi et al. Citation2014). Inline digital holography, which is also based on elastic light scattering, has been used for coarse dust identification according to the non-circularity of the holographic image (Berg and Videen Citation2011; Kemppinen et al. Citation2020; Ravasio et al. Citation2021). This holographic approach for shape reconstruction becomes difficult for particle sizes comparable to or smaller than the wavelength. Besides, dust aerosol particles collected in the atmosphere have been reported to be less nonspherical in smaller particle-size ranges (Huebert et al. Citation2000; Koren, Ganor, and Joseph Citation2001; Okada et al. Citation2001). Therefore, none of the above dust identification approaches based on elastic light scattering at visible wavelengths would be practical in the submicron particle-size range. Even after successful dust identification, the optical particle sizing would suffer from uncertainties due to unconstrained physicochemical properties (e.g., particle shape, internal porosity, and complex refractive index).
The recently proposed Single-Particle Extinction and Scattering (SPES: Potenza, Sanvito, and Pullia Citation2015) method that measures the complex forward-scattering amplitude of single particles is a new approach within the framework of elastic light scattering. The two-dimensional dataspace (the real and imaginary parts of the scattering amplitude) of SPES has been shown to be useful for discriminating different types of particles according to differences in either the complex refractive index or particle shape (Villa et al. Citation2016; Potenza et al. Citation2017).
In this study, we evaluate the applicability of the SPES method for identification and size-quantification of particulate silicate minerals (aluminosilicates + quartz), the major mineralogical component of desert dust, in the submicron particle-size range (0.2 μm ≤ D ≤ 1 μm). We selected water (instead of air) as a working fluid for future applications of SPES to inline measurements of particles in ice core, rainwater, ocean water, and atmospheric aerosols collected into water.
2. Methods and materials
2.1. Single particle extinction and scattering (SPES) method
The SPES method used here has been described in detail in Moteki (Citation2020); here we focus only on the necessary points. In the SPES, one of the two diagonal elements of the complex forward-scattering amplitude matrix of each particle in the sample flow is determined from a measurement of the interference of incident and scattered fields in forward direction (). We properly take into account the non-negligible contribution of the scattered power in addition to the interference power at the surface of the photodetector (Moteki Citation2020). The measured
data are therefore denoted as
in which the theoretical correction to the measured
values according to the scattered power contribution is denoted with the subscript “sc”. In our instrumental setup, a small systematic error probably caused by beam aberration was observed in the original
data that had been derived according to Eqs. (29) and (36) of Moteki (Citation2020). To correct this error, the original
and
data were multiplied by the tuning coefficients 1.02 and 1.16, respectively. The tuning coefficients were determined so as to minimize the discrepancies between measured and theoretical
values for polystyrene (PS) spheres. shows a scatterplot of the measured
data for PS spheres with six different sizes after this correction. The theoretical
values were computed using Mie theory, assuming the complex refractive indices of PS and water to be 1.585 + 0i and 1.332 + 0i, respectively, at the laser wavelength 632.8 nm. The PS refractive index value was given by linearly interpolating the measured complex refractive index of bulk PS material as a function of wavelength (0.4–2 μm) available from the supplementary material of Zhang et al. (Citation2020). The water refractive index value was given by linearly interpolating the data given by the of Hale and Querry (Citation1973), neglecting the imaginary part (∼10−8). Measured and theoretical results agree within 10% relative error for each particle size.
Figure 1. Schematic diagram of our SPES instrument with an illustration of the interferometric detection of scattered wave from each particle in forward direction.
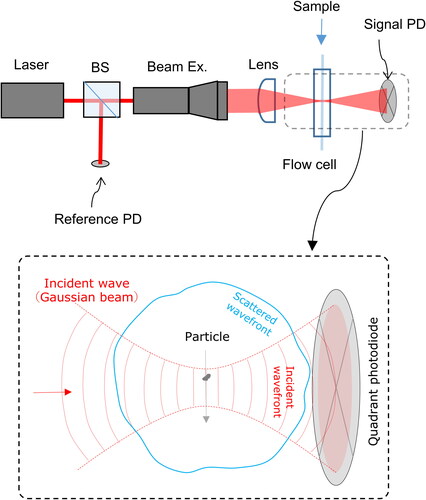
Figure 2. Scatterplot of versus
for polystyrene spheres measured by the SPES instruments. The black dots indicate single-particle data. The red-filled circles with error bars indicate the median and 10th–90th percentile ranges of single-particle data for each particle size. The blue-filled circles with error bars indicate the theoretical values and their uncertainty ranges for each particle size. The uncertainty ranges of the theoretical values were computed from the expanded uncertainty (k = 2) of each particle size specified in the sample datasheet.
![Figure 2. Scatterplot of [ImS22]sc versus ReS22 for polystyrene spheres measured by the SPES instruments. The black dots indicate single-particle data. The red-filled circles with error bars indicate the median and 10th–90th percentile ranges of single-particle data for each particle size. The blue-filled circles with error bars indicate the theoretical values and their uncertainty ranges for each particle size. The uncertainty ranges of the theoretical values were computed from the expanded uncertainty (k = 2) of each particle size specified in the sample datasheet.](/cms/asset/a52cf606-1d54-4135-9c25-50f75cdc3e65/uast_a_2057839_f0002_c.jpg)
Table 1. List of samples.
2.2. Samples
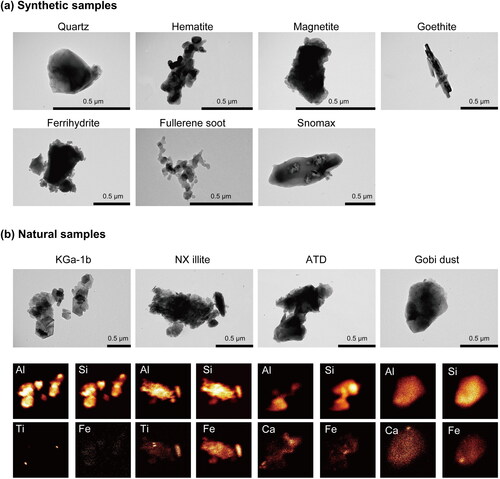
lists the synthetic and natural samples used in our experiment. Transmission electron microscopy (TEM) images of individual particles of these samples are shown in . We used seven different synthetic pure powder materials as proxies for several ubiquitous compositions of water-insoluble aerosols. Fullerene soot powder (Moteki et al. Citation2009; Moteki and Kondo Citation2010; Gysel et al. Citation2011) was used as a proxy for refractory black carbon. Hematite, magnetite, goethite, and ferrihydrite powders were used as proxies for light-absorbing iron oxides/hydroxides. Quartz powder (>99.9% purity) was used as a proxy for particulate silicates in desert dust. Snomax® powder made from the bacterium Pseudomonas syringae (Wex et al. Citation2015) was used as a proxy for bio-aerosols. For laboratory proxies of desert dust aerosols, we used four reference materials. The KGa-1b powder is dominated by kaolinite (∼96% purity) (Murray et al. Citation2011). The NX illite powder consists of illite (∼60%), interstratified illite-smectite (∼14%), feldspar (∼10%), kaolinite (∼7%), quartz (∼7%), and carbonate (∼2%) (Broadley et al. Citation2012). Kaolinite and illite are known as major mineralogical components of clay-sized soil particles (Ito and Wagai Citation2017). Arizona test dust (ATD) consists of feldspar (∼33%), quartz (∼17%), interstratified illite-smectite (∼10%), illite (∼8%), carbonate (6%), kaolinite (2%), and others (∼24%) (Broadley et al. Citation2012). The ATD was reported to be similar in composition to the desert dust aerosols near the source regions (Broadley et al. Citation2012). Gobi Kosa is a reference material of Asian desert dust aerosols that was prepared through soil sampling at the Gobi Desert followed by aerodynamic particle-size fractionation (Nishikawa et al. Citation2013). Its X-ray diffraction pattern implies that Gobi Kosa contains quartz, feldspar, calcite, and clay minerals (group of aluminum phyllosilicates) (Nishikawa et al. Citation2013). Each sample was dispersed in pure water for the SPES analyses. To avoid clogging the flow cell, we removed most of the supermicron-sized waterborne particles through gravitational particle-size fractionation (24–30 h at ∼5 °C). Therefore, the measured particle-size distributions reported here should be different from the original distributions of the powder sample.
Figure 3. Representative TEM images for each of the (a) synthetic and (b) natural samples. In (b), four elemental mappings are shown for each TEM image. The TEM images were obtained using a 120-kV TEM (JEM-1400, JEOL) and the elemental mappings were measured using an energy-dispersive X-ray spectrometer (EDS, Oxford Instruments) with scanning TEM mode (STEM-EDS).
3. S22 data clusters
shows scatterplots of data points for the synthetic and natural samples. summarizes these scatterplots in a single panel for ease of comparison between samples. The quartz sample exhibited a unique cluster of
data points densely distributed along a particular curve (). Each of the iron oxide/hydroxide samples (hematite, magnetite, goethite, and ferrihydrite) exhibited clusters of
data points with a higher
ratio than the quartz sample () due to their higher real and imaginary parts of the refractive index (Huffman and Stapp Citation1973; Querry Citation1985; Longtin et al. Citation1988; Bedidi and Cervelle Citation1993). The synthetic hematite and magnetite samples each exhibited two distinct clusters of
data points near the origin ( and ) for unknown reasons.
Figure 4. Scatter plots of S22 data points for the individual samples listed in .
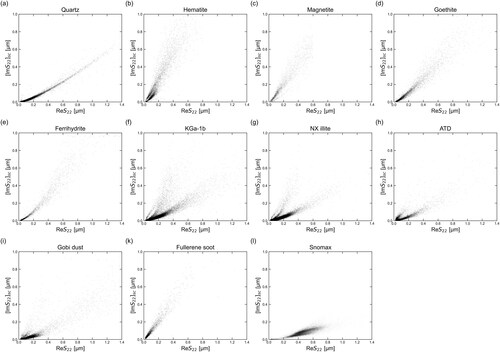
Every natural dust sample exhibited a dense cluster of data points with a
ratio similar to the quartz sample that accounted for more than 85% of the data points (). In addition, each of the natural dust samples exhibited less dense clusters with higher
values than that of the major cluster. The major dense cluster is attributable to particles mostly consisting of aluminosilicates, which are major mineralogical components (e.g., interstratified illite-smectite, illite, kaolinite, feldspar, and quartz). TEM analyses of the natural dust samples confirmed the presence of iron oxide particles with smaller number fraction than the aluminosilicate particles (cf. ). Such iron oxide particles isolated from the aluminosilicate particles would account for the minor clusters of
data points with high
ratios. The data points with medium
ratios between the major and minor clusters can be attributed to particles consisting of various fractions of aluminosilicate and iron oxides.
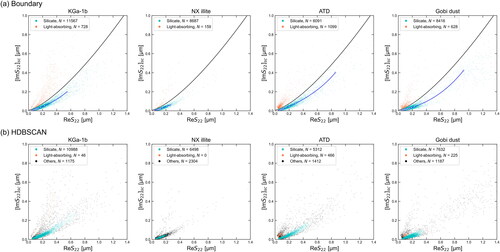
shows density plots for natural dust samples with a magnified color scale. The ridge curve of the density of data points for each iron oxide/hydroxide standard sample is also shown for reference. For convenience, we call the major cluster the “silicate cluster” and the minor cluster including the outlier data points the “light-absorbing cluster”.
Figure 5. Density plots of data points for natural dust samples. The solid lines indicate the traces of median values of
as a function of
for each synthetic sample. Because the
data points for hematite show two distinct clusters (), we separated the hematite data into two clusters using a boundary line (y = 0.95x – 0.02) and then computed the trace for each cluster.
![Figure 5. Density plots of S22 data points for natural dust samples. The solid lines indicate the traces of median values of [ImS22]sc as a function of ReS22 for each synthetic sample. Because the S22 data points for hematite show two distinct clusters (Figure 4b), we separated the hematite data into two clusters using a boundary line (y = 0.95x – 0.02) and then computed the trace for each cluster.](/cms/asset/d1200c4b-0d2a-4475-a1b4-c803d27597a3/uast_a_2057839_f0005_c.jpg)
Conventional elastic light scattering approaches for optical particle sizing have not been able to resolve these two optically distinct components in natural dust samples. Therefore, we have been forced to assume a single physicochemical property (i.e., complex refractive index, particle shape, and mixing state) to estimate the optical particle size for every detected particle. The most notable advantage of the SPES method is an ability to discriminate optically distinct types of particles coexisting in a sample prior to the particle-size estimation. In the following sections, we illustrate a procedure for SPES data analyses to measure the particle-size distribution of the submicron silicate particles in natural dust samples and then discuss the accuracy of results in comparison with the conventional optical particle sizing approaches.
4. Data analyses for the silicate particles
4.1. Clustering
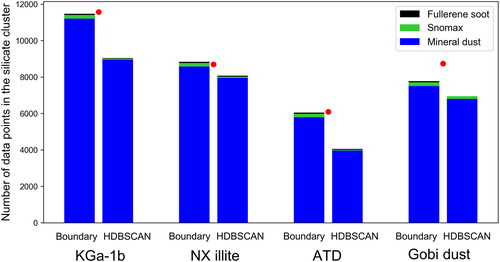
We compared two approaches for discriminating the silicate cluster from other data points. The first appoach (Boundary method) uses an empirical boundary curve to discriminate data points of the silicate cluster from those of light-absorbing cluster. The second approach (HDBSCAN method) is applying Density-Based Clustering Based on Hierarchical Density Estimates (HDBSCAN; Campello, Moulavi, and Sander Citation2013) to all the data points and assigning the largest identified cluster to the silicate cluster). Appendix A describes the details of these methods. For each sample, the number of data points used for the following analysis was fixed at 15,000.
shows the results of applying each clustering method to each natural dust sample. For the KGa-1b sample, the number of data points in the silicate cluster identified by the curve and HDBSCAN methods were 11,567 and 10,988, respectively. In the HDBSCAN method, the number of data points in the silicate cluster was smaller than that determined by the Boundary method because the data points with relatively large were classified as noise. This potential underestimation of the silicate cluster by the HDBSCAN method could also be observed regardless of the total number of data points, as illustrated in . The appropriate procedure for the clustering can change depending on the coexisting compositions in samples. In the following analyses, we used the silicate cluster determined by the Boundary method. The principal curve, an orthogonal projection of data points into one-dimensional space (Hastie and Stuetzle Citation1989), was computed for each silicate cluster and is also shown in .
Figure 6. Clustering results of data points for natural dust samples. For each sample, the (a) Boundary and (b) HDBSCAN methods were applied to the 15,000 raw data points. The black solid lines in (a) indicate the boundary curve (y = 0.65x1.4 + 0.008). The blue solid lines with open circles indicate the principal curves for the silicate clusters, wherein the open circles indicate the 0th, 10th, …, 90th, 98th, and 100th percentiles of the arc-length coordinate of the
data points. The data points with the largest 2%
values were removed before the principal curve fitting to avoid an overfitting issue. The data number of each cluster is denoted in the legend. The total number of data points shown in each figure is less than 15,000 because of trimming of the raw data points near the origin.
4.2. Bayesian inversion
The Bayesian inversion method of Moteki (Citation2020) was designed to automatically select the most plausible model of particle type among the candidate models
It provides estimates of the complex refractive index and volume-equivalent size distribution for the selected model, using a tuple of data points within the cluster of each particulate compound. Here, we used six candidate models defined in of Moteki (Citation2020): NONABSORBING SPHERE, NONABSORBING OBLATE_SPHEROID, NONABSORBING AGGREGATE, GENERAL SPHERE, GENERAL OBLATE_SPHEROID, and GENERAL AGGREGATE. The GENERAL models allow the imaginary part of the refractive index to be
whereas the NONABSORBING models restrict its range to near zero (
). Each of the two nonspherical shape model considered here was made based on T-matrix theory and has a shape parameter that is continuously varied to find the best fit of the simulated data to the measured data. The OBLATE_SPHEROID model allows the horizontal-to-rotational axis ratio between 1.0 and 1.66. The AGGREGATE model, that mimics the fractal-like aggregate of nanospheres, allows the fractal dimension between 1.7 to 2.5.
An application of Bayesian inversion to the tuple of median values of PS spheres data (6 red-filled circles in ) resulted in the selection of the NONSABSORBING SPHERE model with a MAP complex refractive index of 1.57 + 0.00i, which is in fair agreement with the true properties of the PS spheres.
For each of the four natural dust samples and the synthesized quartz sample, we executed the Bayesian inversion method using a tuple of (0th, 10th, …, 90th, 98th, and 100th) percentile points of the arclength coordinate of the principal curve as the input data vector shows the marginal likelihood
and the maximum a posteriori (MAP) values of the complex refractive index mMAP for each sample. The model with the largest
value (i.e., smallest
value) was selected as the best model because it explained the data with the smallest redundancy in model parameter space. Regardless of shape, the
value was always smaller in the NONABSORBING model than in the GENERAL model. Moreover, the mi values even in the GENERAL model were predicted to be very close to zero. These results suggest that the dust particles generating the
data points in the “silicate cluster” predominantly consist of non-light-absorbing materials.
Figure 7. Bar plots of values for the silicate cluster. The MAP estimate of the complex refractive index mMAP = mr + imi is also shown on the top of each bar plot.
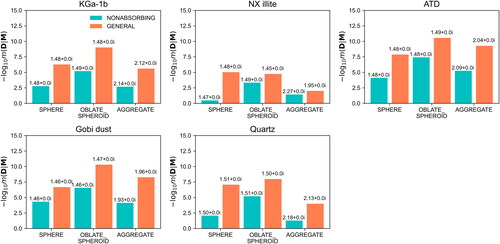
In the NONABSORBING constraint, we compare the three different shape models. For each sample, the lowest was attained by either the SPHERE or AGGREGATE model. The mrMAP values for the AGGREGATE model were 1.87–2.27. This mrMAP value range is much higher than the reported mr range for single crystals of silicate minerals (cf. ) and thus we regard the results of the AGGREGATE model for any of our dust samples to be unphysical. Besides, the mrMAP values for the SPHERE model were 1.46–1.50, slightly less than the reported mr range for single crystals of silicate minerals (cf. ). The smaller mrMAP values in the SPHERE model for dust samples could be attained by assuming a presence of the microscopic pores and cracks that shift the effective refractive index of the particle closer to that of the surrounding medium.
Table 2. The effective refractive indices of the silicate clusters estimated according to the Bayesian inversion method.
The TEM images () imply that the particles’ envelopes are mostly nonspherical, apparently in contradiction to the selection of the SPHERE model. However, irregularity of a particle’s envelope may result in the same S22 shift as a certain porosity of a spherical particle’s volume, considering the fact that the S22 value of a constant-volume particle remains unchanged through any shape deformation as long as the internal field integrated over the particle’s volume, that is, the complex structure factor defined by Eq. (10) of Moteki (Citation2020), remains unchanged. Therefore, the observed lower shift of mrMAP in the SPHERE model from the refractive index of pure silicate minerals could be caused by any of the presence of microscopic pores and cracks, and nonspherical envelope. A clearer physical interpretation for each sample would be attainable, for example, by combining the TEM data and additional dataset of effective density (Lee et al. Citation2009) as a function of particle size. In our Bayesian inversion algorithm, any nonspherical shape model that has the larger freedom in model parameter space should always shows lower marginal likelihood than the SPHERE model given that it exhibits the same goodness of fitting the measured S22 data. From these considerations, we suggest that the NONASORBING SPHERE model does not represent the actual shape of silicate particles but a preferred mathematical model with regard to the Bayesian criterion for the particles in the silicate cluster. We use the MAP parameters provided by this model for analyses hereafter. A particle’s size and complex refractive index derived in our Bayesian inversion method may therefore be interpreted respectively as the “envelope size” and “effective complex refractive index” of a porous sphere that has a value of equal to that of a real particle. It should be noted that the SPHERE model might not be able to fit the
data of dust particles in a larger size range (> ∼1μm), wherein the shape effects on the scattering properties will be more pronounced (e.g., Kalashnikova and Sokolik Citation2004).
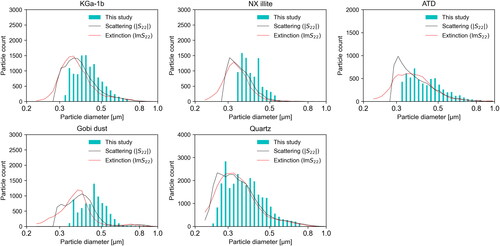
For each sample, the particle-size distribution for the silicate cluster was derived by the following procedure. The arclength coordinate value was previously determined for every data point in the silicate cluster through principal curve projection. The particle volume for each
data point was estimated by linearly interpolating the MAP particle volumes with respect to the arclength coordinate. The particle size was defined according to the estimated volume as the diameter of an equal-volume homogeneous sphere.
shows the derived particle-size distributions of the silicate cluster of each dust sample as well as that for the synthetic quartz sample. For comparison, we also show in the two simulated particle-size distributions derived from either the absolute scattering amplitude () or the imaginary scattering amplitude (
) for all the data points (silicate cluster + light-absorbing cluster). In the simulations, every particle is assumed to be a single homogeneous sphere with a refractive index of 1.56 + 0i, a typical value for single crystals of clay minerals. The
-based simulation result mimics the particle-size distribution that would be obtained by using a low-cost optical particle sensor that measures only the angle-integrated power of scattered field by individual particles. Besides, the
-based simulation mimics the observation by an occultation particle sensor that measures only the extinguished power of the incident field by individual particles. The difference between our results (bars) and the simulations (lines) in implies that an unambiguous physical interpretation of the particle-size distribution obtained through conventional elastic light scattering approaches would not be attainable even for an unmixed dust material.
Figure 8. Retrieved particle-size distributions for the silicate cluster of each dust sample. For comparison, also shown by solid lines are the retrieved particle-size distributions by elastic light scattering approaches that measure only either or
assuming m = 1.56 + 0i to be a typical refractive index value for single crystals of clay minerals.
5. Discussion
Conventional elastic light scattering approaches for particle measurements have mostly been designed to have a one-dimensional dataspace for the signal of either angular-integrated scattering or beam extinction. In a one-dimensional dataspace, assumptions for the complex refractive index and shape are always necessary for particle-size estimation, leading to errors for multi-component environmental samples. A multidimensional dataspace provided by an angle-resolved scattering detector enables determinations of both size and complex refractive index for spherical particles (Chernyshev et al. Citation1995). However, even the dataspace of an angle-resolved scattering detector loses resolution for the complex refractive index as the particle size gets smaller and approaches the Rayleigh limit.
By contrast, the two-dimensional dataspace provided by complex forward-scattering amplitude sensing has a superior resolution for a particle’s complex refractive index in the particle-size range comparable to or smaller than the wavelength (cf. of Moteki Citation2020), even at the Rayleigh limit (Taubenblatt and Batchelder Citation1991). Our approach was therefore able to discriminate silicate-dominant particles from light-absorbing iron-oxide particles coexisting in each desert dust sample in the submicron particle-size range. The discrimination of such optically distinct mineralogical components helps in the acquisition of less ambiguous data of the particle-size distribution of desert dust. The complex forward-scattering amplitude distribution data of dust samples also provides an experimental constraint on the optical properties, in addition to the constraints from the bulk absorption and scattering coefficients (Moosmüller et al. Citation2012) and theoretical calculations on the basis of individual particle analyses (Kalashnikova and Sokolik Citation2004; Kemppinen et al. Citation2015). It should also be mentioned that quality-controlled measurements of the complex forward-scattering amplitude can be performed over a wider particle-size range (Moteki Citation2021). In future, more realistic shape models, such as the Gaussian ellipsoid (Muinonen and Pieniluoma Citation2011), should also be considered in the inversion algorithm for an improved estimation of refractive index and distributions in shape and particle’s volume for silicate particles. Comprehensive light-scattering databases for nonspherical particles have been developed for application to remote sensing and radiative transfer simulations (Meng et al. Citation2010; Saito et al. Citation2021). A “complex amplitude counterpart” of such databases should also be developed for an improvement of the SPES approach for dust measurement.
Here, we contrast our approach with previously proposed approaches for estimating physical properties of particles from the SPES data. Potenza, Sanvito, and Pullia (Citation2015) used a look up table according to the Mie theory for unique determinations of both particle-size and refractive index for non-absorbing spherical scatterers such as polystyrene and Polymethyl Methacrylate (PMMA). For particles with unknown shape, Villa et al. (Citation2016) propose a use of anomalous diffraction theory, that is applicable to any scatterer with large size parameter and small refractive index contrast (Hulst and van de Hulst Citation1981), to estimate some geometric properties of waterborne dust particles. Villa et al. (Citation2016) also used a look up table for spheroidal shape model prepared through an exact numerical method to estimate the two-dimensional distribution of concentration with respect to the aspect ratio and particle-volume, assuming the complex refractive index a priori.
Our method presented here is applicable to any waterborne particles, such as particles in rainwater, ocean water, and ice core meltwater. Application to atmospheric aerosols would also be straightforward by resuspending particles collected on a filter substrate into water (e.g., DeMott et al. Citation2017) or collecting aerosol particles into water (e.g., Weber et al. Citation2001; Cho et al. Citation2019). For untreated environmental samples, it might not always be possible to discriminate desert dust silicates from other particulate compounds solely based on the complex forward-scattering amplitude. Appendix B provides a discussion of the possibility of clustering using synthetic data. Additional techniques (e.g., pretreatment of samples) might be necessary for environmental samples to reduce misidentification.
Supplemental Material
Download MS Word (376 KB)Acknowledgments
We thank Y. Tobo for providing the KGa-1b, NX-illite, and Snomax® particles and for useful comments. We thank Y. Takahashi for providing the ferrihydrite particles. We thank M. Koike, S. Ohata, and Y. Ushikubo for discussions.
Disclosure statement
No potential conflict of interest was reported by the authors.
Additional information
Funding
References
- Arakawa, E. T. P. S. Tuminello, B. N. Khare, M. E. Millham, S. Authier, and J. Pierce. 1997. Measurement of optical properties of small particles. Oak Ridge National Lab., Oak Ridge, TN.
- Bangalath, H. K, and G. Stenchikov. 2015. Role of dust direct radiative effect on the tropical rain belt over Middle East and North Africa: A high-resolution AGCM study. J. Geophys. Res. Atmosph. 120 (10):4564–84.
- Bedidi, A, and B. Cervelle. 1993. Light scattering by spherical particles with hematite and goethitelike optical properties: effect of water impregnation. J. Geophys. Res. Solid Earth. 98 (B7):11941–52.
- Berg, M. J, and G. Videen. 2011. Digital holographic imaging of aerosol particles in flight. J. Quant. Spectrosc. Radiat. Transf. 112 (11):1776–83.
- Broadley, S. L., B. J. Murray, R. J. Herbert, J. D. Atkinson, S. Dobbie, T. L. Malkin, E. Condliffe, and L. Neve. 2012. Immersion mode heterogeneous ice nucleation by an Illite Rich powder representative of atmospheric mineral dust. Atmos. Chem. Phys. 12 (1):287–307.
- Campello, R. J. D. Moulavi, and J. Sander. 2013. Density-based clustering based on hierarchical density estimates. In Pacific-Asia conference on knowledge discovery and data mining, 160–72. Berlin, Heidelberg: Springer.
- Chernyshev, A. V., V. I. Prots, A. A. Doroshkin, and V. P. Maltsev. 1995. Measurement of scattering properties of individual particles with a scanning flow cytometer. Appl. Opt. 34 (27):6301–5.
- Cho, Y. S., S. C. Hong, J. Choi, and J. H. Jung. 2019. Development of an automated wet-cyclone system for rapid, continuous and enriched bioaerosol sampling and its application to real-time detection. Sens. Actuator. B 284:525–33.
- DeMott, P. J., T. C. Hill, M. D. Petters, A. K. Bertram, Y. Tobo, R. H. Mason, K. J. Suski, C. S. McCluskey, E. J. Levin, and G. P. Schill. 2017. Comparative measurements of ambient atmospheric concentrations of ice nucleating particles using multiple immersion freezing methods and a continuous flow diffusion chamber. Atmos. Chem. Phys. 17 (18):11227–11245. doi:10.5194/acp-17-11227-2017.
- Friedrich, F., A. Steudel, and P. G. Weidler. 2008. Change of the refractive index of illite particles by reduction of the Fe content of the octahedral sheet. Clays Clay Miner. 56 (5):505–10.
- Gysel, M., M. Laborde, J. S. Olfert, R. Subramanian, and A. J. Gröhn. 2011. Effective density of aquadag and fullerene soot black carbon reference materials used for SP2 calibration. Atmos. Meas. Tech. 4 (12):2851–8.
- Hale, G. M, and M. R. Querry. 1973. Optical constants of water in the 200-nm to 200-μm wavelength region. Appl. Opt. 12 (3):555–63.
- Hastie, T, and W. Stuetzle. 1989. Principal curves. J. Am. Stat. Assoc. 84 (406):502–16.
- Hoose, C, and O. Möhler. 2012. Heterogeneous ice nucleation on atmospheric aerosols: a review of results from laboratory experiments. Atmos. Chem. Phys. 12 (20):9817–54.
- Huebert, B. J. S. G. Howell, D. Covert, A. Clarke, J. R. Anderson, B. G. Lafleur, R. Seebaugh, J. C. Wilson, D. Gesler, and D. Baumgardner. 2000. Passing efficiency of a low turbulence inlet (PELTI), Final Report to NSF.
- Huffman, D. R, and J. L. Stapp. 1973. Optical measurements on solids of possible interstellar importance. In Symposium-international astronomical union, 52, 297–301. Cambridge: Cambridge University Press.
- Hulst, H. C, and H. C. van de Hulst. 1981. Light scattering by small particles. Mineola, NY: Dover Publication Inc.
- Ito, A, and R. Wagai. 2017. Global distribution of clay-size minerals on land surface for biogeochemical and climatological studies. Sci. Data 4 (1):1–11.
- Jickells, T. D., Z. S. An, K. K. Andersen, A. R. Baker, G. Bergametti, N. Brooks, J. J. Cao, P. W. Boyd, R. A. Duce, K. A. Hunter, et al. 2005. Global iron connections between desert dust, ocean biogeochemistry, and climate. Science 308 (5718):67–71.
- Jones, A. R. 1999. Light scattering for particle characterization. Prog. Energy Combust. Sci. 25 (1):1–53.
- Journet, E., K. V. Desboeufs, S. Caquineau, and J.-L. Colin. 2008. Mineralogy as a critical factor of dust iron solubility. Geophys. Res. Lett. 35 (7):L07805.
- Kalashnikova, O. V, and IN. Sokolik. 2004. Modeling the radiative properties of nonspherical soil-derived mineral aerosols. J. Quant. Spectrosc. Radiat. Transf. 87 (2):137–66.
- Kaspari, S. D., M. Schwikowski, M. Gysel, M. G. Flanner, S. Kang, S. Hou, and P. A. Mayewski. 2011. Recent increase in black carbon concentrations from a Mt. Everest ice core spanning 1860–2000 AD. Geophys. Res. Lett. 38 (4):L04703.
- Kemppinen, O., J. C. Laning, R. D. Mersmann, G. Videen, and M. J. Berg. 2020. Imaging atmospheric aerosol particles from a UAV with digital holography. Sci. Rep. 10 (1):1–12.
- Kemppinen, O., T. Nousiainen, S. Merikallio, and P. Räisänen. 2015. Retrieving microphysical properties of dust-like particles using ellipsoids: the case of refractive index. Atmos. Chem. Phys. 15 (19):11117–32.
- Kobayashi, H., M. Hayashi, K. Shiraishi, Y. Nakura, T. Enomoto, K. Miura, H. Takahashi, Y. Igarashi, H. Naoe, and N. Kaneyasu. 2014. Development of a polarization optical particle counter capable of aerosol type classification. Atmos. Environ. 97:486–92. doi:10.1016/j.atmosenv.2014.05.006.
- Kok, J. F., D. A. Ridley, Q. Zhou, R. L. Miller, C. Zhao, C. L. Heald, D. S. Ward, S. Albani, and K. Haustein. 2017. Smaller desert dust cooling effect estimated from analysis of dust size and abundance. Nat. Geosci. 10 (4):274–8.
- Koren, I., E. Ganor, and J. H. Joseph. 2001. On the relation between size and shape of desert dust aerosol. J. Geophys. Res. Atmosph. 106 (D16):18047–54.
- Lambert, F., M. Bigler, J. P. Steffensen, M. Hutterli, and H. Fischer. 2012. Centennial mineral dust variability in high-resolution ice core data from Dome C, Antarctica. Climate Past. 8 (2):609–23.
- Lee, S. Y., W. Widiyastuti, N. Tajima, F. Iskandar, and K. Okuyama. 2009. Measurement of the effective density of both spherical aggregated and ordered porous aerosol particles using mobility- and mass-analyzers. Aerosol Sci. Technol. 43 (2):136–44.
- Liao, H, and J. H. Seinfeld. 1998. Radiative forcing by mineral dust aerosols: sensitivity to key variables. J. Geophys. Res. Atmosph. 103 (D24):31637–45.
- Longtin, D. R. E. P. Shettle, J. R. Hummel, and J. D. Pryce. 1988. A wind dependent desert aerosol model: radiative properties. Optimetrics Inc., Burlington, MA.
- Meng, Z., P. Yang, G. W. Kattawar, L. Bi, K. N. Liou, and I. Laszlo. 2010. Single-scattering properties of tri-axial ellipsoidal mineral dust aerosols: A database for application to radiative transfer calculations. J. Aerosol Sci. 41 (5):501–12.
- Miller, R. L., R. V. Cakmur, J. Perlwitz, I. V. Geogdzhayev, P. Ginoux, D. Koch, K. E. Kohfeld, C. Prigent, R. Ruedy, and G. A. Schmidt. 2006. Mineral dust aerosols in the NASA goddard institute for space sciences modele atmospheric general circulation model. J. Geophys. Res. Atmosph. 111 (D6):D06208.
- Moosmüller, H., J. P. Engelbrecht, M. Skiba, G. Frey, R. K. Chakrabarty, and W. P. Arnott. 2012. Single scattering albedo of fine mineral dust aerosols controlled by iron concentration. J. Geophys. Res. Atmosph. 117 (D11):D11210.
- Moteki, N. 2020. Capabilities and limitations of the single-particle extinction and scattering method for estimating the complex refractive index and size-distribution of spherical and non-spherical submicron particles. J. Quant. Spectrosc. Radiat. Transf. 243:106811. doi:10.1016/j.jqsrt.2019.106811.
- Moteki, N. 2021. Measuring the complex forward-scattering amplitude of single particles by self-reference interferometry: CAS-v1 protocol. Opt. Express. 29 (13):20688–714. doi:10.1364/OE.423175.
- Moteki, N, and Y. Kondo. 2010. Dependence of laser-induced incandescence on physical properties of black carbon aerosols: measurements and theoretical interpretation. Aerosol Sci. Technol. 44 (8):663–75.
- Moteki, N., Y. Kondo, N. Takegawa, and S. Nakamura. 2009. Directional dependence of thermal emission from nonspherical carbon particles. J. Aerosol Sci. 40 (9):790–801.
- Muinonen, K, and T. Pieniluoma. 2011. Light scattering by Gaussian random ellipsoid particles: First results with discrete-dipole approximation. J. Quant. Spectrosc. Radiat. Transf. 112 (11):1747–52.
- Murray, B. J., S. L. Broadley, T. W. Wilson, J. D. Atkinson, and R. H. Wills. 2011. Heterogeneous freezing of water droplets containing kaolinite particles. Atmos. Chem. Phys. 11 (9):4191–207.
- Nagatsuka, N., K. Goto-Azuma, A. Tsushima, K. Fujita, S. Matoba, Y. Onuma, R. Dallmayr, M. Kadota, M. Hirabayashi, and J. Ogata. 2021. Variations in mineralogy of dust in an ice core obtained from northwestern greenland over the past 100 years. Clim. Past 17 (3):1341–62.
- Nishikawa, M., D. Batdorj, M. Ukachi, K. Onishi, K. Nagano, I. Mori, I. Matsui, and T. Sano. 2013. Preparation and chemical characterisation of an asian mineral dust certified reference material. Anal. Methods 5 (16):4088–95.
- Okada, K., J. Heintzenberg, K. Kai, and Y. Qin. 2001. Shape of atmospheric mineral particles collected in three chinese arid-regions. Geophys. Res. Lett. 28 (16):3123–6.
- Potenza, M. A. C., Ž. Krpetić, T. Sanvito, Q. Cai, M. Monopoli, J. M. de Araújo, C. Cella, L. Boselli, V. Castagnola, P. Milani, et al. 2017. Detecting the shape of anisotropic gold nanoparticles in dispersion with single particle extinction and scattering. Nanoscale 9 (8):2778–84.
- Potenza, M. A., T. Sanvito, and A. Pullia. 2015. Measuring the complex field scattered by single submicron particles. AIP Adv. 5 (11):117222.
- Querry, M. R. 1985. Optical constants, contractor report. US Army Chemical Research, Development and Engineering Center (CRDC), Aberdeen Proving Ground, MD, 418.
- Ravasio, C., L. Cremonesi, C. Artoni, B. Delmonte, V. Maggi, and M. A. Potenza. 2021. Optical characterization of mineral dust from the EAIIST project with digital holography. ACS Earth Space Chem. 5 (10):2855–64.
- Romanov, A. V, and M. A. Yurkin. 2021. Single-particle characterization by elastic light scattering. Laser Photon. Rev. 15 (2):2000368.
- Ruth, U., D. Wagenbach, M. Bigler, J. P. Steffensen, R. Röthlisberger, and H. Miller. 2002. High-resolution microparticle profiles at NorthGRIP, Greenland: case studies of the calcium–dust relationship. Ann. Glaciol. 35:237–42.
- Saito, M., P. Yang, J. Ding, and X. Liu. 2021. A comprehensive database of the optical properties of irregular aerosol particles for radiative transfer simulations. J. Atmos. Sci. 78 (7):2089–111.
- Satheesh, S. K, and K. K. Moorthy. 2005. Radiative effects of natural aerosols: a review. Atmos. Environ. 39 (11):2089–110.
- Simonsen, M. F., L. Cremonesi, G. Baccolo, S. Bosch, B. Delmonte, T. Erhardt, H. A. Kjaer, M. Potenza, A. Svensson, and P. Vallelonga. 2018. Particle shape accounts for instrumental discrepancy in ice core dust size distributions. Clim. Past 14 (5):601–8.
- Sokolik, IN., and O. B. Toon. 1996. Direct radiative forcing by anthropogenic airborne mineral aerosols. Nature 381 (6584):681–3.
- Sugimoto, N., I. Matsui, A. Shimizu, I. Uno, K. Asai, T. Endoh, and T. Nakajima. 2002. Observation of dust and anthropogenic aerosol plumes in the northwest pacific with a two-wavelength polarization lidar on board the research vessel Mirai. Geophys. Res. Lett. 29 (19):7–1.
- Taubenblatt, M. A, and J. S. Batchelder. 1991. Measurement of the size and refractive index of a small particle using the complex forward-scattered electromagnetic field. Appl. Opt. 30 (33):4972–9.
- Villa, S., T. Sanvito, B. Paroli, A. Pullia, B. Delmonte, and M. A. C. Potenza. 2016. Measuring shape and size of micrometric particles from the analysis of the forward scattered field. J. Appl. Phys. 119 (22):224901.
- Weber, R. J., D. Orsini, Y. Daun, Y.-N. Lee, P. J. Klotz, and F. Brechtel. 2001. A particle-into-liquid collector for rapid measurement of aerosol bulk chemical composition. Aerosol Sci. Technol. 35 (3):718–27.
- Weidler, P. G, and F. Friedrich. 2007. Determination of the refractive index of particles in the clay and sub-micrometer size range. Am. Mineral. 92 (7):1130–2.
- Wex, H., S. Augustin-Bauditz, Y. Boose, C. Budke, J. Curtius, K. Diehl, A. Dreyer, F. Frank, S. Hartmann, and N. Hiranuma. 2015. Intercomparing different devices for the investigation of ice nucleating particles using Snomax® as test substance. Atmos. Chem. Phys. 15 (3):1463–85.
- Xu, R. 2015. Light scattering: a review of particle characterization applications. Particuology 18:11–21. doi:10.1016/j.partic.2014.05.002.
- Zennaro, P., N. Kehrwald, J. R. McConnell, S. Schüpbach, O. J. Maselli, J. Marlon, P. Vallelonga, D. Leuenberger, R. Zangrando, and A. Spolaor. 2014. Fire in ice: two millennia of boreal forest fire history from the Greenland neem ice core. Clim. Past 10 (5):1905–24.
- Zhang, X., J. Qiu, X. Li, J. Zhao, and L. Liu. 2020. Complex refractive indices measurements of polymers in visible and near-infrared bands. Appl. Opt. 59 (8):2337–44.
Appendix A.
Clustering method
We removed data points from around the origin () where the data points of even optically distinct components were severely overlapping. In the Boundary method, we defined two boundary curves:
and
where
and
The former was used to descriminate the silicate cluster from the light-absorbing cluster. The latter was used only for the procedure described in Appendix B to discriminate the silicate cluster from the cluster of Snomax. In the HDBSCAN method, we transformed the coodinates of S22 dataspace according to the method of Moteki (Citation2020) before application of HDBSCAN clustering to the data. Two hyperparameters of HDBSCAN, “min_cluster_size” and “min_samples,” were tuned for each sample to obtain reasonable clustering results. For all samples except for Gobi dust, we set (min_cluster_size, min_samples) to (20, 30) when N
25,000 and (40, 45) when N > 25,000. For the Gobi dust sample, we set (min_cluster_size, min_samples) to (40, 30) for any N.
Appendix B.
Clustering tests using synthetic data
We briefly evaluated the potential errors of our clustering methods for multicomponent samples by using synthetic data. The synthetic data consisted of 45,000 data points prepared by merging 15,000 data points of either of the four dusts (), 15,000 data points of fullerene soot (), and 15,000 data points of Snomax (). We designate the clustered data points to one of three distinct clusters: “light-absorbing cluster” (fullerene soot + iron oxides), “silicate cluster” (aluminosilicates + quartz), and “biogenic cluster” (Snomax). shows scatterplots of the clustered data points. shows the number of data points in the silicate cluster extracted from the synthetic data for individual cases. In each case, the number of data points in the silicate cluster determined for pure dust data using the Boundary method is also shown. For both the Boundary and HDBSCAN methods, contamination of the silicate cluster by other components (fullerene soot + Snomax) was less than 5%.
Figure B1. Scatter plots of the synthetic data that were classified by the (a) Boundary and (b) HDBSCAN methods. The black solid and black dashed lines in (a) represent the boundary curves for the curve method. Each of the blue solid lines with open circles indicates the principal curve for each silicate cluster.
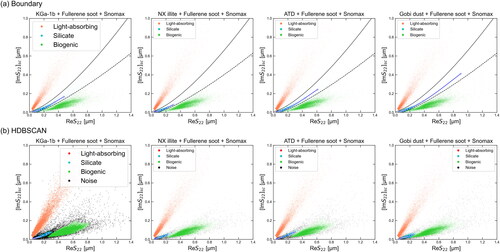
Figure B2. Number of data points in the silicate cluster for the synthetic data. Contributions to the number of data points in the silicate cluster from different components are shown. The red-filled circles indicate the original number of data points in the silicate cluster determined for each dust sample.