
 ?Mathematical formulae have been encoded as MathML and are displayed in this HTML version using MathJax in order to improve their display. Uncheck the box to turn MathJax off. This feature requires Javascript. Click on a formula to zoom.
Abstract
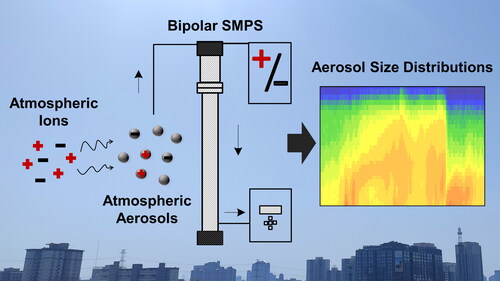
Electrical mobility size spectrometers are widely used to measure ambient aerosol number size distributions. A key component of these mobility systems is the charge conditioner, or neutralizer, which is used to place a stationary charge distribution on the aerosols prior to mobility analysis. Yet, there are natural air ions in the atmosphere which are constantly conditioning the charge state of atmospheric aerosols. In this study, we demonstrate that this natural charging process can be utilized by these spectrometers to measure size distributions of atmospheric aerosols without using a conventional neutralizer. This is achieved by measuring charged particles of both polarities, in contrast to only one polarity as conventionally done. The bipolar data is used to retrieve air ion properties from which the aerosol charge fractions are calculated. We deployed this new method in urban Beijing to measure atmospheric aerosols over a period of two years and verified that size distributions can be effectively measured using natural air ions. There is good agreement in aerosol size distributions when comparing this new method to a conventional spectrometer, and good agreement in total particle number concentrations measured by a condensation particle counter. Additionally, measuring charged particles of both polarities makes the uncertainties due to aerosol charging now traceable. We show that during two years of measurement in urban Beijing, the properties of ions produced by conventional neutralizers drifted due to the aging of ion sources, while the properties of natural atmospheric ions remained stable over time, despite occasional short-period fluctuations.
Graphical Abstract
Copyright © 2022 American Association for Aerosol Research
EDITOR:
1. Introduction
Atmospheric aerosols have great impacts on air quality, climate, and human health, which is largely governed by their size property. Long-term measurements of atmospheric particle number size distribution (PNSD) is essential (Birmili et al. Citation2016). This is often achieved using electrical mobility size spectrometers (e.g., SMPS or DMPS) which condition the charge state of aerosols using a neutralizer (Liu and Pui Citation1974), select positively or negatively charged particles based on their electrical mobilities, and then detect them to obtain the raw PNSD (Wang and Flagan Citation1990; Wiedensohler et al. Citation2012). Since only a proportion of charged particles are measured, aerosol charge fractions achieved by the neutralizer are used to derive atmospheric PNSD through data inversion. For neutralizers using radioactive materials or soft X-ray (SXR) as ion sources, charge fractions approximated by two sets of formulae are often used (Wiedensohler Citation1988; Tigges et al. Citation2015). Charge fractions calculated by these approximations are constant, however, the actual fractions can deviate due to variants in neutralizer source intensity and ion properties during long-term measurements (Jiang et al. Citation2014; Steiner et al. Citation2014; Maißer et al. Citation2015). Variability in these fractions can cause significant uncertainty in the inverted PNSD which becomes arguably the most untraceable uncertainty source for these measurements.
Recently, Chen, McMurry, and Jiang (Citation2018) demonstrated that operating the spectrometers to measure charged particles of both polarities (hereafter, referred as the bipolar SMPS), in contrast to that only a single polarity is conventionally measured, can reduce the uncertainty caused by aerosol charging since the sum of positive and negative charge fractions is relatively constant under typical conditions. In addition, those information on charged particles of both polarities can be used to retrieve the actual ion properties and aerosol charge fractions during atmospheric measurements (Chen and Jiang Citation2018).
There are natural air ions in the atmosphere, e.g., generated by galactic cosmic rays, gamma rays emitted from soil and rocks, and alpha radiation from 222Rn and its progeny (Harrison and Tammet Citation2008). The composition of the generated primary ions and cluster ions has been examined using mass spectrometry (Ehn et al. Citation2010; Yin et al. Citation2021). Thus, atmospheric aerosols are naturally conditioned by these natural air ions. We hypothesize that this can be utilized by the bipolar SMPS to measure atmospheric PNSD without using a conventional neutralizer.
In this study, we demonstrate that the atmosphere itself is a natural neutralizer and atmospheric PNSD can be effectively measured using natural air ions. A bipolar SMPS is deployed at two sites in urban Beijing. Atmospheric PNSDs are measured using natural ions and integrated total particle number concentrations are also obtained. They are compared to PNSDs measured by an SMPS using a conventional neutralizer and total number concentrations measured by a condensation particle counter (CPC). Additionally, we show that the bipolar SMPS can trace the variations in ion properties and aerosol charge fractions of both natural and conventional neutralizers during long-term atmospheric measurements.
2. Methodology
2.1. Measurements
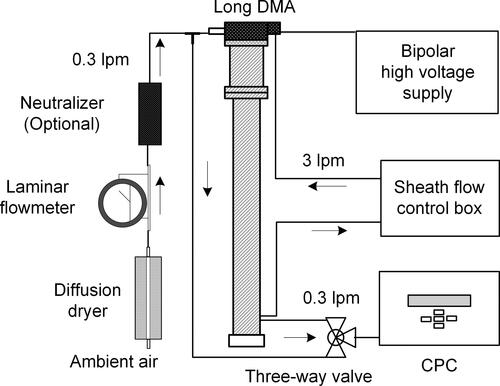
A bipolar SMPS was deployed in urban Beijing to measure the raw size distributions of both positively and negatively charged atmospheric aerosols. shows the schematic of the instrument. Its details and operating conditions are provided in the supplementary information (SI). In a conventional SMPS, high voltage of only one polarity is applied to its differential mobility analyzer to select negatively or positively charged particles. In the bipolar SMPS, however, a bipolar power supply is used to provide both positive and negative voltages. During the measurement, the applied voltage is scanned between the set positive and negative values such that charged particles of both polarities are measured. Note that after each scan for the size distribution measurement, total number concentration of atmospheric aerosols is measured by the same CPC with the automatically controlled three-way valve operating bypass the differential mobility analyzer. Its time resolution is set to be 5 min, including each scan for the size distribution, zeroing, total particle number concentration measurement, and waiting time.
Figure 1. Schematic of the bipolar SMPS to measure charged particles of both polarities. Note that the conventional neutralizer is removed when measuring atmospheric aerosols using natural air ions.
Atmospheric measurements were conducted at two sites in urban Beijing. The first site was located on the campus of Tsinghua University (Cai et al. Citation2017). The measurement period was from 7 November 2018, to 10 August 2020, during which the bipolar SMPS was operated to measure atmospheric aerosols in the size range of 13–690 nm. Due to instrument maintenance, data of 314 days are available and were used for the analysis (). The bipolar SMPS was operated in two modes, i.e., without a conventional neutralizer and with one. For the first mode, atmospheric aerosols conditioned by natural air ions were measured. Data of 153 days were obtained with natural air ions (). For the second mode, we used a 85Kr neutralizer (TSI Model 3077; source reference date: 4 November 2004) and three SXR neutralizers (an aged TSI Model 3087 neutralizer, a new Model 3087 neutralizer, and an aged Model 3088 neutralizer), respectively. These conventional neutralizers with different ages help to test the effect of decayed source intensity during long-term atmospheric measurements and to compare with natural air ions. During our measurements, the 85Kr neutralizer was tested three times and for a total of 58 days (). The aged and new 3087 neutralizers were tested for 34 and 33 days, respectively, and the aged 3088 one was tested for 36 days (). Further information about these neutralizers is provided in the SI.
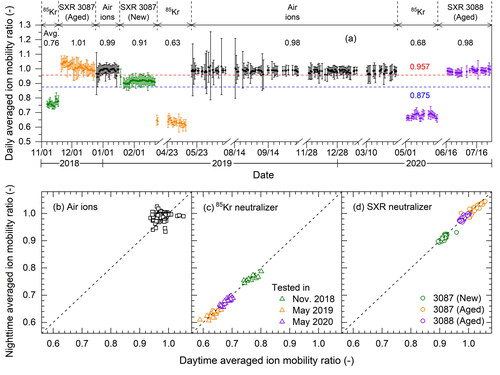
Figure 2. (a) Time series of daily averaged ion mobility ratios during the measurement period at Tsinghua site. The time resolution for the measured size distribution and thus the calculated ion mobility ratio is 5 min. The symbols and error bars represent daily average and standard deviation of the ratios. The average ratio value for each neutralizer and natural air ions during its measurement period are listed on the plot. Two horizontal dash lines are the fixed ion mobility ratios of 0.875 and 0.957 for developing the constant aerosol charge fractions by Wiedensohler (Citation1988) and Tigges et al. (Citation2015), respectively. In the lower panels are daytime and nighttime averaged ion mobility ratios during measurement periods using (b) natural air ions, (c) 85Kr neutralizer, and (d) SXR neutralizers. Each symbol represents one day, with the daytime averaged from 8:00–20:00 and the nighttime averaged from 20:00–8:00. The dash lines are for guiding the eyes. Note that natural air ions, 85Kr neutralizer, and SXR neutralizers were tested for 153, 58, and 103 days, respectively.
The other site was located on the west campus of Beijing University of Chemical Technology (BUCT site), ∼7 km from Tsinghua site (Deng et al. Citation2020). The measurement period was from 28 December 2020, to 4 February 2021. The bipolar SMPS was operated only using natural air ions and data of 30 days are available. For comparison, a well-calibrated conventional SMPS using a SXR neutralizer (Liu et al. Citation2016) was operated in parallel to measure atmospheric aerosols in the size range of 3–700 nm. These two instruments used the same sampling inlet.
2.2. Data analysis
Ion properties, aerosol charge fractions, and atmospheric PNSDs can be derived from the raw PNSDs directly measured by the bipolar SMPS (). As detailed in the SI, the raw PNSDs can first be used to retrieve ion mobility ratio weighted by ion concentrations, x, defined as,
(1)
(1)
where
is the concentration of positive or negative ions (cm−3); and
is the mobility of positive or negative ions (cm2·V−1·s−1). The charge state of aerosols achieved by a neutralizer is governed by this ratio which reflects the differences between positive and negative ions. Its times series illustrate the dynamic variations of the ions from both natural and conventional neutralizers (). Note that the concentrations of positive and negative ions were often assumed to be the same in previous studies which will simplify EquationEquation (1)
(1)
(1) , however, this is not a prerequisite for this method.
Ion mobility ratio at a given time is then used to retrieve aerosol charge fractions using the modified Gunn and Woessner formula (Chen and Jiang Citation2018):
(2)
(2)
where f (±q, dp) is the fraction of size dp particles carrying ±q elementary charges (dimensionless); e is the elementary charge (C); ε0 is the permittivity of vacuum (C2·N−1·m−2); kB is the Boltzmann’s constant (J·K−1); T is the temperature (K); α is the correction coefficient (dimensionless). Note that in this study the α for q = 1 case is the one from , rather than Equation (5) in Chen and Jiang (Citation2018) in order to calculate particles smaller than 20 nm. Note that the more the above ion mobility ratio deviates from unity, the larger difference between positive and negative charge fractions.
The retrieved aerosol charge fractions are then used for deriving the inverted PNSDs using a linear inversion algorithm (Hagen and Alofs Citation1983). This data inversion routine was done for each scan of the bipolar SMPS. Details are given in the SI.
Total particle number concentration integrated from the inverted PNSDs by the bipolar SMPS, Nintegrated, was compared to that directly measured by the CPC in the bipolar SMPS. Since the sampling losses through the bipolar SMPS was included when obtaining the inverted PNSDs, loss correction was performed for the CPC total number concentration data as well. Additionally, the lower size limit of the inverted PNSDs from our bipolar SMPS is 13 nm while the CPC can detect particles well below this size. The contribution of particles smaller than 13 nm to total number concentration measured by the CPC was evaluated using the inverted PNSDs and then discarded, i.e., obtaining the number concentration of atmospheric aerosols with the size greater than 13 nm (denote as NCPC for simplicity) for the comparison. Particles greater than 690 nm was also measured by the CPC while not by our bipolar SMPS, however, their contribution to total number concentration is mostly negligible. Details about the calculation are given in the SI. Note that because of the fitting method for discarding particles smaller than 13 nm, days with new particle formation (NPF) events when a significant amount of nanoparticles are formed cannot be used for the comparison. Nevertheless, the validity of the bipolar SMPS for measuring atmospheric NPF events is directly tested by comparing it to the conventional SMPS at BUCT site.
3. Variations in ion properties
The bipolar SMPS well captured the variations in ion properties of conventional neutralizers due to the aging of ion sources during long-term atmospheric measurements (). Because of the aging, both 85Kr and SXR neutralizers have significant drifts in ion mobility ratio. The tested 85Kr source had passed its half-life time of ∼10.7 yrs. The averaged ion mobility ratio decreased from 0.76 to 0.63 six months after the first test, i.e., ∼14.5 years from its source reference date. This complements the finding that no significant drift in aerosol charge fractions were observed when the 85Kr source is within its half-life time (Jiang et al. Citation2014). For SXR, the recommended lifetime by the source manufacturer is 8000 h. The ratio for the aged SXR source increased toward high values, even above unity in some periods, in contrast to the decreasing ratio for the aged 85Kr source. This extends the known differences between neutralizers using SXR and radioactive materials (Tigges et al. Citation2015). Additionally, the ratios for both sources fluctuated even during a short period (possibly related to atmospheric conditions). Thus, these ratios can be significantly different from the fixed ion mobility ratios (0.875 and 0.957 for 85Kr and SXR, respectively) used for developing the constant aerosol charge fractions used by most SMPSs and DMPSs. Note that drift in aerosol charge fractions was also observed for the aged 210Po sources in controlled laboratory experiments (Jiang et al. Citation2014). The influence of ion source aging on ion mobility ratios could be due to that the change in source intensity leads to change in ion concentrations and ion composition (Maißer et al. Citation2015). Fortunately, these variations in ion properties and in aerosol charge fractions can now be captured by the bipolar SMPS, then be incorporated when deriving atmospheric PNSD.
Natural air ions can be used by the bipolar SMPS for size distribution measurements and the properties of these ions were obtained (). In contrast to those observed for the aging 85Kr and SXR sources, natural air ions had no systematic drift during the two years of measurement. During a short period, however, natural air ions have more fluctuations than those produced by conventional neutralizers. For instance, daytime and nighttime averaged ion mobility ratios are the same for 85Kr and SXR neutralizers while obvious fluctuations occurred for natural air ions. These fluctuations are possibly related to diurnal changes in atmospheric conditions including ionization sources and ion clustering kinetics. Nevertheless, they can be retrieved from charged particles of both polarities detected by the bipolar SMPS and used for data inversion.
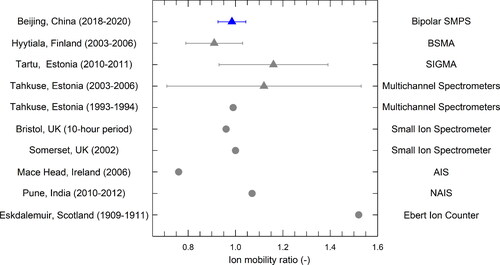
The retrieved mobility ratios of natural air ions in urban Beijing are within a similar range with those directly measured at other ground sites (). Concentration and mobility of natural air ions were measured by various instruments including those based on ion electrical mobility with a high time resolution (Hõrrak, Salm, and Tammet Citation2000). These data were adopted to calculate ion mobility ratio using EquationEquation (1)(1)
(1) . The average ratios for various atmospheric sites are mostly within the range of 0.9–1.2, except for the measurements made in Mace Head (Vana et al. Citation2008) and Eskdalemuir (Harrison Citation2007). The reported concentration of positive ions in Mace Head is lower than that of negative ions, while the data in Eskdalemuir was obtained with an Ebert ion counter of low accuracy. Similar to ions produced by SXR neutralizer, the concentration weighted mobility ratios of natural air ions at various sites are close to or greater than unity, in contrast to ions produced by radioactive neutralizer that are known to be less than unity.
Figure 3. The concentration weighted mobility ratio of natural air ions at various atmospheric sites. Data for sites other than Beijing were adopted from previous studies. Detailed information and references are given in the SI. For datasets with a high time resolution (e.g., 5 min in this study), the ion mobility ratio was calculated for each scan; the triangle and error bar represent the average and standard deviation of all scans, respectively. The solid circle is ion mobility ratio calculated with average values of ion concentration and mobility. Acronyms of the instruments are defined in the SI.
4. Measured PNSDs using natural air ions
4.1. Comparison of the bipolar SMPS and the conventional SMPS
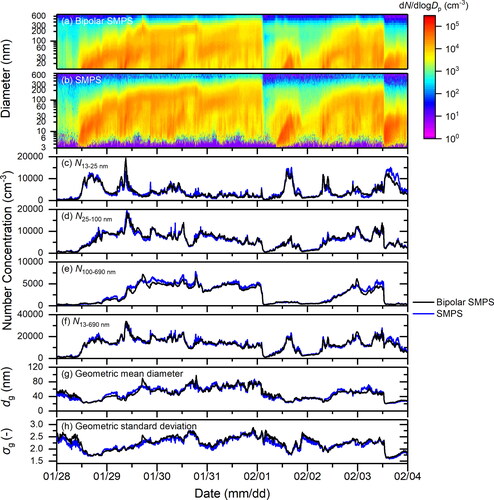
Atmospheric PNSDs were effectively measured by the bipolar SMPS using natural air ions and the results are consistent with those from the conventional SMPS using SXR neutralizer. As shown by the data of seven consecutive days measured at BUCT site (), both instruments well captured the dynamically varying atmospheric PNSDs and are consistent with each other in terms of PNSDs, geometric mean diameter, geometric standard deviation, and integrated particle number concentrations for the size range of 13 − 25 nm, 25 − 100 nm, 100 − 690 nm, and 13 − 690 nm. Atmospheric NPF events were detected by both instruments on three out of seven days, for which these parameters have good agreement as well. During these NPF events, significant amounts of new particles were formed, followed by subsequently growth, which governs atmospheric PNSDs. Note that the formation rates of new particles in urban Beijing are often significantly higher than those in clean atmospheric environments (Deng et al. Citation2020). Additionally, primary emissions from anthropogenic activities such as cooking and transportation were also detected, i.e., bursts of particles across the ultrafine size range (Li et al. Citation2021).
Figure 4. Size distributions of atmospheric aerosols for seven consecutive days measured at BUCT site by (a) the bipolar SMPS using natural air ions and (b) the conventional SMPS using SXR neutralizer. Integrated number concentrations in the size range of (c) 13–25 nm, (d) 25–100 nm, (e) 100–690 nm, (f) 13–690 nm, as well as (g) geometric mean diameter and (h) geometric standard deviation of measured size distributions are shown. The time resolution for the measured size distribution and thus the calculated parameters is 5 min. On 28 January, 1 February, and 3 February, there were new particle formation events.
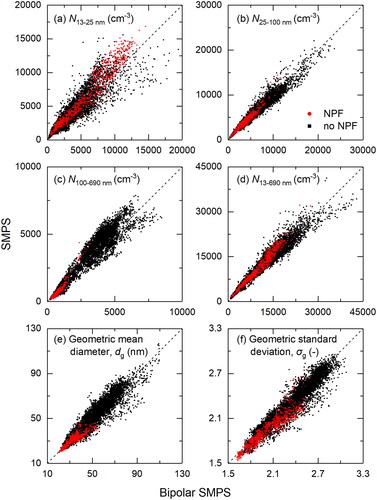
For atmospheric data of 30 days (including 8 days with NPF events) collected at BUCT site, scatter plots of these parameters also show good agreement (). For these examined parameters, their data points are mostly distributed near the equal dash lines for the bipolar SMPS and the SMPS. The consistency between two instruments confirms that atmospheric PNSDs can be effectively measured by the bipolar SMPS using natural air ions. Note that results of N13-25 nm are more scattered than others (). This may be related to the uncertainty of nanoparticle charging. It has been observed that small nanoparticles (e.g., less than 15 nm) can be under- or overcharged during NPF events but reaches stationary state as the size becomes larger (Iida et al. Citation2006; Laakso et al. Citation2007). This may deviate from the fixed aerosol charge fractions used in the conventional SMPS. Though charged nanoparticles of both polarities measured by the bipolar SMPS responds to and reflects these variations, there is more uncertainty in retrieving this information for small nanoparticles (Chen and Jiang Citation2018; Chen, McMurry, and Jiang Citation2018). More studies for particles in this size range is needed. Nevertheless, the results of the bipolar SMPS and the SMPS are generally consistent with each other.
Figure 5. Comparing size distributions of atmospheric aerosols for 30 days measured at BUCT site by the bipolar SMPS using natural air ions and the conventional SMPS using SXR neutralizer. Integrated number concentrations in the size range of (a) 13–25 nm, (b) 25–100 nm, (c) 100–690 nm, (d) 13–690 nm, as well as (e) geometric mean diameter and (f) geometric standard deviation of measured size distributions are shown. The time resolution for the data is 5 min. There were 8 days with new particle formation events. Data points during new particle formation period are shown in circles (red) while the others are shown in squares (black). The dash lines are for guiding the eyes.
4.2. Comparison of total particle number concentration
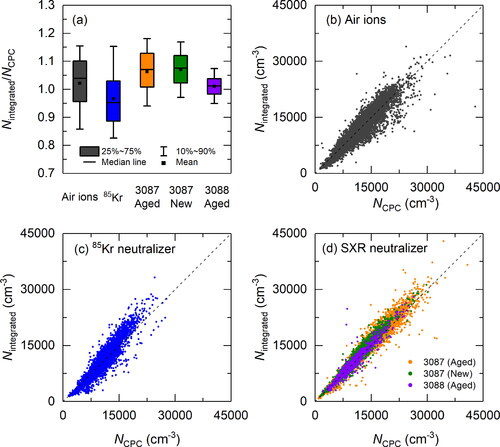
We used atmospheric data of 314 days collected at Tsinghua site to further examine the new method. Despite the variations in ion properties, the ratios of total particle number concentration integrated from the PNSDs measured by the bipolar SMPS to that directly measured by the CPC, i.e., Nintegrated/NCPC, are within a similar range (). The median values of this ratio are 1.04, 0.95, 1.07, 1.08, and 1.01 for natural air ions, 85Kr neutralizer, aged SXR neutralizer (3087), new SXR neutralizer (3087), and aged SXR neutralizer (3088). The Nintegrated/NCPC for measurements with natural air ions is comparable with other periods when conventional neutralizers are utilized, and within the range of 0.9 − 1.1 as suggested by Wiedensohler et al. (Citation2018) based on laboratory experiments comparing SMPS to CPC. An inter-comparison of a DMPS with a conventional neutralizer to a CPC during long-term atmospheric measurement in Nanjing reported a median value of 0.91 (Qi et al. Citation2015).
Figure 6. (a) The ratio of total particle number concentration integrated from the PNSDs measured by the bipolar SMPS (Nintegrated) to that directly measured by the CPC (NCPC) at Tsinghua site. Scatter plots show data measured using (b) natural air ions, (c) 85Kr neutralizer, and (d) SXR neutralizers. The time resolution for the data is 5 min. The dash lines are for guiding the eyes.
The agreement of Nintegrated and NCPC during two years of measurement at Tsinghua site further confirms the feasibility of measuring atmospheric PNSD using natural air ions. The same comparison of total particle number concentration was done using data of 30 days collected at BUCT site. As shown in , the results are similar and the median value of Nintegrated/NCPC is 1.04.
5. Conclusion
Atmospheric ions produced by the nature itself are constantly conditioning the charge state of atmospheric aerosols. We demonstrated that this process can be utilized by electrical mobility size spectrometers to measure size distributions of these aerosols, in contrast to using a conventional neutralizer. For two urban sites tested in this study, natural air ions are sufficient to condition atmospheric aerosols for their measurements even with intensive secondary formation and primary emissions. Achieving this requires a minor modification to current spectrometers such that charged particles of both polarities are measured. This improvement makes the variations in ion properties and aerosol charge fractions now traceable. In addition to fluctuations in short period during atmospheric measurements, we also showed systematic drift for conventional neutralizers due to the aging of ion source. Despite their fluctuations in short period as well, natural air ions were stable during two years of measurement in Beijing. By replacing conventional neutralizers with the nature itself, it also improves the feasibility of developing miniature spectrometers for applications such as airborne measurements, exposure monitoring, and sensor network. Note that the relative abundance of air ions to atmospheric aerosols is higher at high altitude than ground surface.
Supplemental Material
Download PDF (343.4 KB)Acknowledgments
We appreciate comments from two anonymous reviewers. We thank Prof. Hannes Tammet for sharing the dataset of air ion measurements. Support from Qiang Zhang at Tsinghua and technical staff at BUCT is acknowledged.
Additional information
Funding
References
- Birmili, W., K. Weinhold, F. Rasch, A. Sonntag, J. Sun, M. Merkel, A. Wiedensohler, S. Bastian, A. Schladitz, G. Loschau, et al. 2016. Long-term observations of tropospheric particle number size distributions and equivalent black carbon mass concentrations in the German Ultrafine Aerosol Network (GUAN). Earth Syst. Sci. Data 8 (2):355–82. doi:10.5194/essd-8-355-2016.
- Cai, R. L., D. S. Yang, Y. Y. Fu, X. Wang, X. X. Li, Y. Ma, J. M. Hao, J. Zheng, and J. Jiang. 2017. Aerosol surface area concentration: a governing factor in new particle formation in Beijing. Atmos. Chem. Phys. 17 (20):12327–40. doi:10.5194/acp-17-12327-2017.
- Chen, X. T., and J. Jiang. 2018. Retrieving the ion mobility ratio and aerosol charge fractions for a neutralizer in real-world applications. Aerosol Sci. Technol. 52 (10):1145–55. doi:10.1080/02786826.2018.1498587.
- Chen, X. T., P. H. McMurry, and J. Jiang. 2018. Stationary characteristics in bipolar diffusion charging of aerosols: Improving the performance of electrical mobility size spectrometers. Aerosol Sci. Technol. 52 (8):809–13. doi:10.1080/02786826.2018.1479058.
- Deng, C. J., Y. Y. Fu, L. Dada, C. Yan, R. L. Cai, D. S. Yang, Y. Zhou, R. J. Yin, Y. Q. Lu, X. X. Li, et al. 2020. Seasonal characteristics of new particle formation and growth in urban Beijing. Environ. Sci. Technol. 54 (14):8547–57. doi:10.1021/acs.est.0c00808.
- Ehn, M., H. Junninen, T. Petaja, T. Kurten, V. M. Kerminen, S. Schobesberger, H. E. Manninen, I. K. Ortega, H. Vehkamaki, M. Kulmala, et al. 2010. Composition and temporal behavior of ambient ions in the boreal forest. Atmos. Chem. Phys. 10 (17):8513–30. doi:10.5194/acp-10-8513-2010.
- Hagen, D. E., and D. J. Alofs. 1983. Linear inversion method to obtain aerosol size distributions from measurements with a differential mobility analyzer. Aerosol Sci. Technol. 2 (4):465–75. doi:10.1080/02786828308958650.
- Harrison, R. G. 2007. Electrical properties of surface atmospheric air at Eskdalemuir, 1909-1911. Atmos. Res. 84 (2):182–8. doi:10.1016/j.atmosres.2006.08.001.
- Harrison, R. G., and H. Tammet. 2008. Ions in the terrestrial atmosphere and other solar system atmospheres. Space Sci. Rev. 137 (1-4):107–18. doi:10.1007/s11214-008-9356-x.
- Hõrrak, U., J. Salm, and H. Tammet. 2000. Statistical characterization of air ion mobility spectra at Tahkuse Observatory: Classification of air ions. J. Geophys. Res. 105 (D7):9291–302. doi:10.1029/1999JD901197.
- Iida, K., M. Stolzenburg, P. McMurry, M. J. Dunn, J. N. Smith, F. Eisele, and P. Keady. 2006. Contribution of ion-induced nucleation to new particle formation: methodology and its application to atmospheric observations in Boulder, Colorado. J. Geophys. Res. Atmos. 111:D23201.
- Jiang, J., C. M. Kim, X. L. Wang, M. R. Stolzenburg, S. L. Kaufman, C. L. Qi, G. J. Sem, H. Sakurai, N. Hama, and P. H. McMurry. 2014. Aerosol charge fractions downstream of six bipolar chargers: effects of ion source, source activity, and flowrate. Aerosol Sci. Technol. 48 (12):1207–16. doi:10.1080/02786826.2014.976333.
- Laakso, L., S. Gagne, T. Petaja, A. Hirsikko, P. P. Aalto, M. Kulmala, and V. M. Kerminen. 2007. Detecting charging state of ultra-fine particles: instrumental development and ambient measurements. Atmos. Chem. Phys. 7 (5):1333–45. doi:10.5194/acp-7-1333-2007.
- Li, X. X., Y. Y. Li, M. J. Lawler, J. M. Hao, J. N. Smith, and J. Jiang. 2021. Composition of ultrafine particles in urban Beijing: measurement using a thermal desorption chemical ionization mass spectrometer. Environ. Sci. Technol. 55 (5):2859–68. doi:10.1021/acs.est.0c06053.
- Liu, B. Y. H., and D. Y. H. Pui. 1974. Electrical neutralization of aerosols. J. Aerosol Sci. 5 (5):465–72. doi:10.1016/0021-8502(74)90086-X.
- Liu, J. Q., J. Jiang, Q. Zhang, J. G. Deng, and J. M. Hao. 2016. A spectrometer for measuring particle size distributions in the range of 3 nm to 10 mu m. Front. Environ. Sci. Eng. 10 (1):63–72. doi:10.1007/s11783-014-0754-x.
- Maißer, A., J. M. Thomas, C. Larriba-Andaluz, S. He, and C. J. Hogan. 2015. The mass-mobility distributions of ions produced by a Po-210 source in air. J. Aerosol Sci. 90:36–50. doi:10.1016/j.jaerosci.2015.08.004.
- Qi, X. M., A. J. Ding, W. Nie, T. Petäjä, V.-M. Kerminen, E. Herrmann, Y. N. Xie, L. F. Zheng, H. Manninen, P. Aalto, et al. 2015. Aerosol size distribution and new particle formation in the western Yangtze River Delta of China: 2 years of measurements at the SORPES station. Atmos. Chem. Phys. 15 (21):12445–64. doi:10.5194/acp-15-12445-2015.
- Steiner, G., T. Jokinen, H. Junninen, M. Sipila, T. Petaja, D. Worsnop, G. P. Reischl, and M. Kulmala. 2014. High-resolution mobility and mass spectrometry of negative ions produced in a Am-241 aerosol charger. Aerosol Sci. Technol. 48 (3):261–70. doi:10.1080/02786826.2013.870327.
- Tigges, L., A. Wiedensohler, K. Weinhold, J. Gandhi, and H. J. Schmid. 2015. Bipolar charge distribution of a soft X-ray diffusion charger. J. Aerosol Sci. 90:77–86. doi:10.1016/j.jaerosci.2015.07.002.
- Vana, M., M. Ehn, T. Petaja, H. Vuollekoski, P. Aalto, G. de Leeuw, D. Ceburnis, C. D. O'Dowd, and M. Kulmala. 2008. Characteristic features of air ions at Mace Head on the west coast of Ireland. Atmos. Res. 90 (2-4):278–86. doi:10.1016/j.atmosres.2008.04.007.
- Wang, S. C., and R. C. Flagan. 1990. Scanning electrical mobility spectrometer. Aerosol Sci. Technol. 13 (2):230–40. doi:10.1080/02786829008959441.
- Wiedensohler, A. 1988. An approximation of the bipolar charge-distribution for particles in the sub-micron size range. J. Aerosol Sci. 19 (3):387–9. doi:10.1016/0021-8502(88)90278-9.
- Wiedensohler, A., W. Birmili, A. Nowak, A. Sonntag, K. Weinhold, M. Merkel, B. Wehner, T. Tuch, S. Pfeifer, M. Fiebig, et al. 2012. Mobility particle size spectrometers: harmonization of technical standards and data structure to facilitate high quality long-term observations of atmospheric particle number size distributions. Atmos. Meas. Tech. 5 (3):657–85. doi:10.5194/amt-5-657-2012.
- Wiedensohler, A., A. Wiesner, K. Weinhold, W. Birmili, M. Hermann, M. Merkel, T. Muller, S. Pfeifer, A. Schmidt, T. Tuch, et al. 2018. Mobility particle size spectrometers: calibration procedures and measurement uncertainties. Aerosol Sci. Technol. 52 (2):146–64. doi:10.1080/02786826.2017.1387229.
- Yin, R. J., C. Yan, R. L. Cai, X. X. Li, J. W. Shen, Y. Q. Lu, S. Schobesberger, Y. Y. Fu, C. J. Deng, L. Wang, et al. 2021. Acid-base clusters during atmospheric new particle formation in urban Beijing. Environ. Sci. Technol. 55 (16):10994–1005. doi:10.1021/acs.est.1c02701.