
 ?Mathematical formulae have been encoded as MathML and are displayed in this HTML version using MathJax in order to improve their display. Uncheck the box to turn MathJax off. This feature requires Javascript. Click on a formula to zoom.
Abstract
The effects of concentrating particles using the Versatile Aerosol Concentration Enrichment System (VACES) were investigated with a focus on the organic particle composition. The VACES uses water condensation to grow particles and allow enrichment in particle concentrations by virtual impaction, followed by diffusion drying to remove excess liquid water. Aerosol mass spectrometry was used to compare the submicron organic composition before and after the VACES for laboratory-generated secondary organic aerosol (SOA) from ozonolysis of α-pinene as well as ambient particles. Size distributions were retained after the VACES for both types of samples. SOA particles showed evidence of high molecular weight compounds forming after enrichment, suggesting that some oligomerization occurs during the water condensation and/or evaporation stages, but with only slight changes in the elemental composition. Oligomerization was also observed for ambient particles, especially those with higher O/C in the accumulation mode. Ambient ultrafine particles with low O/C were not as efficiently enriched. Such composition changes in the organic fraction may be relevant to other methodologies where particles are grown through water uptake and then dried, as well as to atmospheric processes involving water uptake and evaporation. In the context of particle mass, the extent of oligomerization is small. However, given the widespread use of particle concentrators in health effects and particle composition studies, whether this impacts interpretation of health effects and particle composition data when using particle concentrators needs further exploration.
Copyright © 2022 American Association for Aerosol Research
EDITOR:
Introduction
Atmospheric particles have well documented negative effects on health (Dockery et al. Citation1993; Villeneuve et al. Citation2002; Pope et al. Citation2004, Citation2019; Nel Citation2005; Laden et al. Citation2006; Pope and Dockery Citation2006; Miller et al. Citation2007; Apte et al. Citation2018). Particles with diameters ≤ 2.5 µm (PM2.5) are inhaled into the deep lung and the smaller diameters reach the alveoli (Hinds Citation1999; Nemmar et al. Citation2002; Oberdörster and Utell Citation2002; Oberdörster et al. Citation2004; Oberdörster, Oberdörster, and Oberdörster Citation2005; Simkhovich, Kleinman, and Kloner Citation2008; Lepistö et al. Citation2020). Exposure to PM2.5 is associated with harmful effects on the respiratory, cardiovascular, and neurological systems as well as with total mortality (Bourdrel et al. Citation2017; Apte et al. Citation2018; Kilian and Kitazawa Citation2018; U.S. EPA 2019). There are fewer health effects studies focusing on the subset of PM2.5, ultrafine particles (UFP), which are defined as those with diameters ≤ 0.1 µm (PM0.1) or quasi-ultrafines with diameters ≤ 0.18 µm (PM0.18). UFP are believed to contribute to higher toxicity because of their larger surface areas for a given mass, increased lung deposition efficiency, and predominantly organic composition, although the mechanism(s) remain unclear (Brown et al. Citation2001; Oberdörster Citation2001; Oberdörster and Utell Citation2002; Li et al. Citation2003; Oberdörster et al. Citation2004; Delfino, Sioutas, and Malik Citation2005; Oberdörster, Oberdörster, and Oberdörster Citation2005; Araujo et al. Citation2008; Stone et al. Citation2017; Thompson Citation2018). The mass concentration of PM2.5 is dominated by larger particles, while UFP commonly dominate in number concentration.
Sources of PM2.5 include both primary and secondary particles. Primary emissions in urban regions are typically dominated by automobile fuel combustion emissions and are a major contributor to UFP (Alfarra et al. Citation2004; Allan et al. Citation2004; Drewnick et al. Citation2004; Zhang et al. Citation2004, Citation2005a, Citation2005b, Citation2007; McFiggans et al. Citation2005; Docherty et al. Citation2008). Secondary particle sources include oxidation of volatile organic compounds (VOC) to produce secondary organic aerosol (SOA) particles as well as oxidation of gaseous SO2 and NOx to form particulate sulfate and nitrate (Finlayson-Pitts and Pitts Citation2000). SOA and secondary inorganics make up a large fraction of PM2.5 mass, most often in the accumulation mode, which represents particles with diameters of approximately 0.2–2.5 µm (Zhang et al. Citation2007; Docherty et al. Citation2008; Jimenez et al. Citation2009; Shilling et al. Citation2013; Zhao et al. Citation2014).
Studies on the health effects of atmospheric particles often use particle concentrators to increase concentrations to levels typical of polluted conditions (Lippmann and Chen Citation2009). Many particle concentrators utilize a virtual impactor (Sioutas et al. Citation1997; Lawrence et al. Citation2004; Moffet et al. Citation2004; McWhinney et al. Citation2012; Gute et al. Citation2019), which divides the flow into major and minor portions, and allows particles with enough inertia to flow through a nozzle and into a second orifice at a lower flow rate, the “minor flow,” while the remaining “major flow” containing gases is removed. The adjustment of the ratio of total inlet flow to minor flow determines the theoretical enrichment factor of the initial particle concentration, assuming no particle losses. The addition of a particle growth stage upstream of the virtual impactor that uses water vapor condensation to increase the diameter and inertia of the incoming particles, extends enrichment down into the ultrafine particle diameter range (Sioutas, Kim, and Chang Citation1999; Kim et al. Citation2001b; Demokritou, Gupta, and Koutrakis Citation2002; Gupta, Demokritou, and Koutrakis Citation2004; Khlystov et al. Citation2005; Zhao et al. Citation2005; Su et al. Citation2006). Following virtual impaction, the minor flow passes through diffusion dryers to remove excess aerosol water, as in the case of the Versatile Aerosol Concentration Enrichment System (VACES) used here. Other concentrators, such as the Harvard Ultrafine Concentrated Ambient Particle System (HUCAPS), use mild thermal treatment and dilution to remove excess water (Demokritou, Gupta, and Koutrakis Citation2002; Gupta, Demokritou, and Koutrakis Citation2004; Su et al. Citation2006; McWhinney et al. Citation2012; Rastogi et al. Citation2012).
Particle concentrators with water condensation stages are used for in vivo animal and human studies (Li et al. Citation2003; Verma et al. Citation2011; Keebaugh et al. Citation2015; Kleinman et al. Citation2018; Taghvaee et al. Citation2019; Herman et al. Citation2020) and for in vitro health-related studies (Kim et al. Citation2001b; Cho et al. Citation2005; Ntziachristos et al. Citation2007; Steenhof et al. Citation2011; Krapf et al. Citation2017; Taghvaee et al. Citation2019), as well as to increase mass concentrations for analytical aerosol measurements (Geller et al. Citation2002; Sun et al. Citation2009; Salcedo et al. Citation2010; Saarikoski et al. Citation2014; Soleimanian, Taghvaee, and Sioutas Citation2020; Shang et al. Citation2021a, Citation2021b). While many studies have been carried out on the effects of concentrators on particle size distributions and inorganic composition of ambient particles, less is known about the details of the organic fraction, which is under increasing scrutiny as a source of toxicity of inhaled particles (Baltensperger et al. Citation2008; Lippmann and Chen Citation2009; Gaschen et al. Citation2010; Keebaugh et al. Citation2015; Rohr and McDonald Citation2016; Mesquita et al. Citation2017; Ridley et al. Citation2018; Hwang et al. Citation2021). The presence of liquid water in and/or on organic particles and the rapid drying stage that follows can allow chemical reactions such as hydrolysis and oligomerization to be accelerated at the surface or throughout the particles, depending on their solubility in water, thus changing their original composition. In this study, the effects of particle concentration enrichment using the VACES on organic composition and size distributions were investigated for laboratory-generated α-pinene ozonolysis SOA particles and compared to the results from enrichment of ambient particles.
Experimental methods
Operation of VACES
A schematic of the VACES is provided in , based on the design of Kim et al. (Citation2001a, Citation2001b). Ambient outdoor air was drawn in from above the roofline of a single-floor laboratory at a flow rate of 100 L min−1. Air flow containing ambient particles was used or, alternatively, this air was filtered through a bypass line with HEPA and VOC filters to add laboratory-generated particles to the VACES. For either case, particle-laden air flow passed through the headspace of a saturator one-third filled with doubly deionized water and temperature-controlled to Tsat = 27–33 °C. The water-saturated particle flow then passed through a condenser maintained at Tcond = 10 °C so that the particles grew from water uptake under the super-saturated conditions. The saturation ratio, calculated from the ratio of the water vapor pressure at Tsat to that at Tcond, is 2.9–4.1 (see , online supplemental information). The higher mass droplets subsequently flowed through an inertial virtual impactor (expanded view in ) as the minor flow, while the remaining flow of gases was pumped away as the major flow. After the virtual impactor, the minor flow passed through a diffusion dryer filled with silica gel desiccant to remove excess water.
Figure 1. Schematic of the Versatile Aerosol Concentration Enrichment System (VACES).
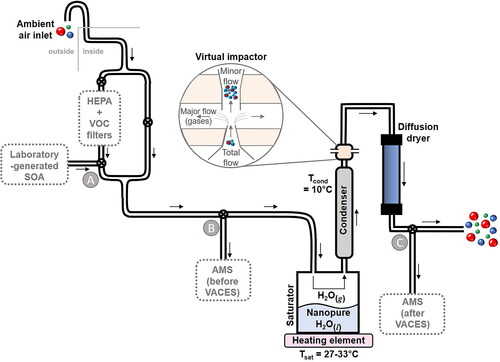
The ratio of the total flow (typically 100 L min−1) to the minor flow (typically 5 L min−1) defines the theoretical concentration enrichment factor (typically EFtheor = 20), assuming no particle losses. Between the two different ambient particle sampling periods in this study, the VACES was reconfigured, with an adjusted inlet flow into the saturator of 300 L min−1; this was then split into three identical legs each at 100 L min−1 total flow through three condensers, and 10 L min−1 minor flow through three virtual impactors, EFtheor = 10. There was no significant difference in the results using the two EFtheor configurations. Total particle number concentrations were measured every 15 min with a condensation particle counter (CPC, TSI model 3025A) upstream (ambient) and downstream of the VACES and minor adjustments made to the flows (< ±10%) every 15 min to maintain EFtheor.
Secondary organic aerosol particle measurements
SOA particles were generated by ozonolysis of α-pinene to form a polydisperse particle distribution in a Teflon chamber run in batch mode. The chamber was filled with 400 L of clean air (Scott-Marrin, NOx < 0.001 ppm, SO2 < 0.001 ppm). Ozone was generated (Polymetrics, Model T-816) at a concentration of 2% in O2 (Oxygen Services, Ultra High Purity, 99.993%) in a 30 mL glass cell and was flushed into the chamber with additional clean air to a total volume of 450 L and a concentration of 1.2 ppm O3 before reaction. Liquid α-pinene ((1 R)-(+)-α-pinene; Sigma Aldrich, >99%) was injected to give a final gas phase concentration after evaporation of 0.7 ppm. After reacting for ∼20 min, particle size distributions were measured by SMPS to confirm that particle growth had stabilized.
With the VACES operating under the same conditions as above, SOA particles were introduced at point A with a mild venturi effect drawing ∼100 mL/min of the chamber sample into the total flow. During addition of SOA, the inlet ambient flow was filtered with a HEPA filter and a Purafil®/charcoal filter to remove particles and VOCs, respectively. High particle concentrations were generated in the Teflon chamber to ensure their detection after dilution into the total flow.
Measurements before and after the VACES were taken at points B and C, respectively (). AMS mass concentration detection limits using the VACES were defined as three standard deviations of average 10-min sampling times for sampling of filtered air. These filtered VACES mass concentrations were ≤0.05 µg m−3 for all AMS species (≤0.03 µg m−3 for organics) within 10-min sampling times.
Ambient particle measurements
The VACES was operated at the Air Pollution Health Effects Laboratory (APHEL) at the University of California, Irvine, located approximately 5 miles inland from the Pacific Ocean, <1 mile from a wetland nature reserve, and is surrounded by several heavily trafficked roads and freeways.
Ambient particles were concentrated with the VACES over two time periods: Period 1, spring/summer (April 27-August 23, 2012) and Period 2, summer/fall (August 20-October 21, 2016). Measurements of ambient particles, typically between 8 am and noon PST, were taken before and after the VACES at points B and C, respectively. Sampling times were in the range of 10–45 min. For one to four time periods each day, size distributions, fragment intensities, and elemental composition were averaged for upstream periods and compared to the corresponding downstream periods (collected immediately afterward).
Aerosol mass spectrometry
Submicron particle measurements were made with a high-resolution time-of-flight aerosol mass spectrometer (AMS, Aerodyne, Inc.) (DeCarlo et al. Citation2006). Briefly, aerosol particles are sampled at ∼0.08 L min−1 through a 100 µm orifice into an aerodynamic lens, which focuses particles in the range of 50–1000 nm vacuum aerodynamic diameter. Particles travel through a time-of-flight vacuum chamber for particle size distribution measurement, are flash vaporized at 600 °C, and ionized by electron impact ionization (70 eV). All results are from V-mode mass spectra.
The AMS was calibrated using a scanning mobility particle sizer (SMPS; TSI Inc., model 3080 classifier with long DMA, model 3776 CPC). The SMPS was used to calibrate the AMS with respect to mass concentrations and vacuum aerodynamic diameters, Dva. AMS calibration of Dva was carried out with carboxylate modified polystyrene latex spheres (CMLs, Life Technologies, Grand Island, NY) (Kidd, Perraud, and Finlayson-Pitts Citation2014) and size-selected NH4NO3 (Fisher, ≥98%) particles atomized from aqueous (18.2 MΩ cm) solutions. Calibrations from 50 nm to 800 nm electrical mobility diameter were in good agreement for the two particle types. The AMS standard vaporizer temperature was increased to 850 °C for CML calibrations. Ionization efficiency and mass concentration calibrations were carried out using size-selected 250, 300, and 350 nm NH4NO3 particles. Note that changes in size and composition of particle diameters below ∼50 nm and >1 µm are not measurable with AMS.
Analysis was performed using software packages SQUIRREL v1.62F and PIKA v1.22F with Igor Pro (WaveMetrics, v. 6.37) with default values for relative ionization efficiencies. AMS collection efficiency (CE) has been shown to be ∼0.5 for most ambient particles as well as for laboratory-generated SOA primarily due to bounce of particles at the vaporizer (Matthew, Middlebrook, and Onasch Citation2008; Sun et al. Citation2010; Middlebrook et al. Citation2012; Docherty et al. Citation2013) and was taken to be the same before and after the VACES. Any increases in CE, for example for liquid particles, would lead to consistent increases in enrichment efficiency after VACES, which were not observed.
Results and discussion
SOA particles
Mass-weighted size distributions collected before and after the VACES for two different experiments show that the mode diameters did not shift consistently in one direction or the other, as shown in and summarized in . The average mode diameters shifted by less than ±5% and the width, indicated by the geometric standard deviation, changed by less than 3%. Thus, particle size distributions are well preserved, suggesting that all particles grew to sufficient sizes to be transferred efficiently through the virtual impactor, and that the particles dried back to their original sizes, in agreement with both organic and inorganic particles in previous studies (Sioutas, Kim, and Chang Citation1999; Kim et al. Citation2001b; Geller et al. Citation2002; Freney et al. Citation2006; Saarikoski et al. Citation2014). also summarizes the enrichment factors, size distributions and elemental composition of SOA. The mass enrichment factors are within experimental error of the theoretical values. Size-dependent EFmass values, calculated using the mass concentrations in each diameter bin (), show a slight trend toward lower enrichments at smaller diameters. Similar trends have been reported in previous studies (Hering and Stolzenburg Citation2005; Maciejczyk et al. Citation2005; Su et al. Citation2006; McWhinney et al. Citation2012; Rastogi et al. Citation2012; Gute et al. Citation2019).
Figure 2. AMS size distributions of SOA particles generated from α-pinene ozonolysis introduced before (grey lines) and measured after the VACES (black lines) and size-dependent EFmass (circles). The dashed line shows the average EFmass for (a) Expt. 1, 17.7 (EFtheor = 20) and (b) Expt. 2, 13.8 (EFtheor = 15).
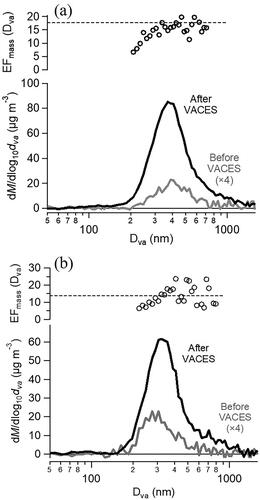
Table 1. Size distribution, enrichment, and elemental composition data for SOA particles from AMS.
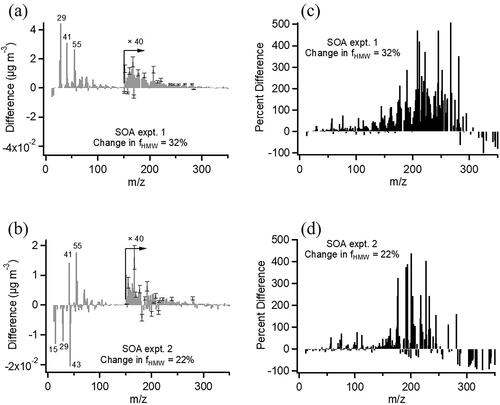
While the mass spectrum does not change dramatically (), there are small shifts in relative contributions of three dominant fragment families (CxHy+, CxHyO1+, and CxHyO>1+) after enrichment. Oxidized fragments, particularly those with more than one oxygen, decrease () and the overall O/C ratio decreases by 8–10% (). A similar loss of the oxygenated fragment, CO2+, was observed in a previous study for ambient particles (Saarikoski et al. Citation2014). The changes are also seen in the Van Krevelen diagram (), where the slope lends insight into the possible reactions taking place (Canagaratna et al. Citation2015; Chen et al. Citation2015). A slope of −1 indicates a change in both carbonyl and alcohol groups or a change in carboxylic acid groups. A slope of −0.5 can indicate either a change in both carboxylic acid and alcohol groups without molecular fragmentation or a change in carboxylic acid groups with fragmentation. For SOA samples, the average slope is −0.66 and the direction of the samples is toward lower O/C and higher H/C. This indicates a small loss of oxygenated functional groups and points to a net loss of carboxylic acids and alcohols when SOA passes through the VACES.
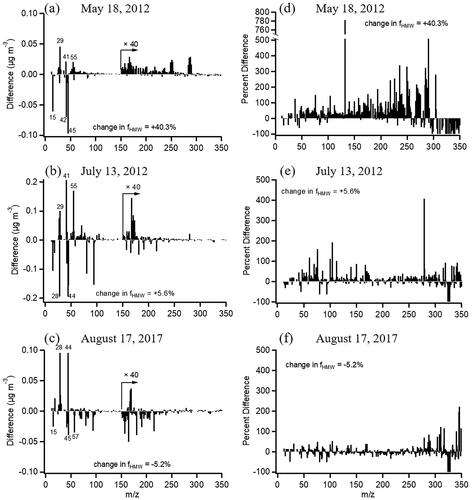
Figure 3. (a, b) Difference mass spectra of SOA before and after the VACES. Each spectrum is the difference between after the VACES divided by its EFmass and before the VACES. Positive peaks at m/z > 150 show gain in HMW compounds after the VACES; (c, d) Difference mass spectra expressed as a percentage relative to the initial mass spectrum. The HMW increases after the VACES are statistically significant from those before the VACES (p < 0.05).
There are a number of possible oligomerization reactions that can occur in an aqueous environment or upon subsequent drying of SOA. For example, glyoxal and methylglyoxal, produced from ozonolysis of α-pinene and other monoterpenes (Yu, Flagan, and Seinfeld Citation1998; Fick et al. Citation2003; Fick, Nilsson, and Andersson Citation2004; Nunes et al. Citation2005), are highly water soluble and have been shown to oligomerize with enhanced rates during drying (Loeffler et al. Citation2006; De Haan et al. Citation2009; Yasmeen et al. Citation2010; Petters et al. Citation2020) and in the presence of carboxylic acids (Corrigan, Hanley, and De Haan Citation2008; Qin et al. Citation2020). Organic hydroperoxides in terpene SOA can decompose in water to generate free radicals such as RO and OH (Tong et al. Citation2016, Citation2018; Wei et al. Citation2020a) which may then initiate further chemistry and contribute to oligomerization through radical-radical combination or radical-neutral chain reactions. Such reactions would lead to decreases in O/C and increases in H/C (Barsanti and Pankow Citation2004, Citation2005, Citation2006; Kroll and Seinfeld Citation2008; De Haan et al. Citation2009; Yasmeen et al. Citation2010; Petters et al. Citation2020). Acceleration of aqueous phase reactions in microdroplets has also been reported due to increased concentrations and acidity during drying (Yan, Bain, and Cooks Citation2016; Banerjee et al. Citation2017; Petters et al. Citation2020; Wei et al. Citation2020b). In short, some oligomerization in the VACES is perhaps not surprising.
The lifetime of oligomer formation was estimated using an aldol condensation rate constant of ∼104 M−1 s−1 (Krizner et al. Citation2009). When a 3–5 µm droplet is formed, a dissolved 400 nm SOA particle will give an organic concentration of 10−3–10−2 M. Assuming 1% of this is available to undergo oligomer-forming reactions, the reaction lifetime is given by τ = ln 2/(k [Org]) = 0.5–2 s. This estimate does not take into account possible changes in rates that increase with acidity during drying or droplet interface reactions, but shows that reaction rates can be sufficiently fast for such chemistry to occur within the ∼2 s residence time of the VACES.
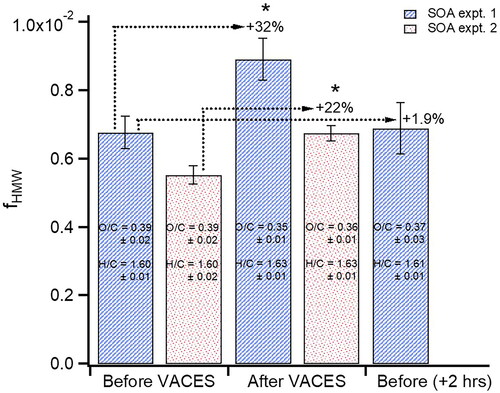
Mass spectra were also examined for changes in the amount of high molecular weight (HMW) compounds by calculating the fraction of peaks above m/z 150 relative to the sum of all peaks, fHMW, before and after the VACES. and b show difference mass spectra for the two SOA experiments, where there is an increase of 22–32% in fHMW after the VACES (). The mass spectra are also expressed as percent difference observed after the VACES relative to the initial spectrum () where the increases above m/z 150 are clearly seen. HMW compounds such as highly oxidized molecules (HOMs) as well as oligomers are known to form during α-pinene ozonolysis, especially at the relatively high reactant concentrations used for this study (Gao et al. Citation2004; Tolocka et al. Citation2004; Hall and Johnston Citation2012; Kristensen et al. Citation2014, Citation2016; Kourtchev et al. Citation2016; Molteni et al. Citation2019). Electron impact ionization generally results in significant fragmentation so that the majority of peaks appear at m/z < 150, but some peaks at larger masses indicative of oligomeric molecules do survive. Size distributions of several peaks with m/z > 150 are shown in to indicate their diameters and relative intensities. Because sampling of the original particle stream and enriched particles occurred over approximately two hours, it is possible that there was an increase in the oligomers during this aging time in the chamber (Qi et al. Citation2010). To test for this, the SOA was sampled again before the VACES after two hours of aging in the reaction chamber. Neither the fHMW (which increased by only 1.9%) nor the O/C (0.37 ± 0.03) and H/C (1.61 ± 0.01) changed significantly () compared to the unaged SOA, ruling this out as a source of oligomerization and suggesting HMW compounds formed during enrichment. Similar observations of high molecular weight increases have been reported for ambient air and (NH4)2SO4 particles using the Harvard particle concentrator which uses heat to remove the excess water (McWhinney et al. Citation2012).
Figure 4. Fraction of high molecular weight fragments, fHMW, before and after the VACES for the two α-pinene SOA experiments with a 22–32% increase after the VACES. Error bars represent 2 s uncertainty of each measurement over 20–40 min. No significant change occurred after 2 hrs. of aging. Asterisks indicate values are statistically different (p < 0.05) from the corresponding value before the VACES.
Changes in gas-particle partitioning are also possible within the VACES. α-Pinene SOA is a mixture of particles and semivolatile products and the latter may partition into the particles as the sample passes through the condenser if its concentration is greater than its saturation vapor pressure (Khlystov et al. Citation2005). Such compounds may only partially desorb in the virtual impactor and dryers when they return to room temperature. However, if this occurred to a significant extent, measured enrichment factors would be expected to be larger than EFtheor along with diameter increases after the VACES, which were not observed in the present studies, although this has been observed in previous studies of inorganic salts and ambient air particles (Su et al. Citation2006; McWhinney et al. Citation2012; Saarikoski et al. Citation2014; Soleimanian, Taghvaee, and Sioutas Citation2020). Thus, partitioning from the gas phase induced by the VACES is likely to be minor here. Additionally, partitioning of HMW compounds from the vapor phase into the particles was considered to explain increases in fHMW, but their small expected vapor pressures make this process unlikely to contribute.
Ambient particles
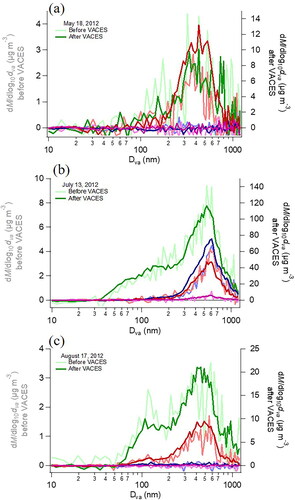
Size distributions of ambient particles before and after the VACES are shown in . An accumulation mode at ∼300–700 nm is common to all samples and contains both organics and inorganics. Bimodal distributions with a UFP mode near ∼100 nm containing primarily organics were observed on many days (). These distributions are similar to other reported urban profiles with both primary and secondary particles (Finlayson-Pitts and Pitts Citation2000; Alfarra et al. Citation2004; Drewnick et al. Citation2004; McFiggans et al. Citation2005; Zhang et al. Citation2005b, Citation2007; Docherty et al. Citation2008). The data in show that again the overall shapes of the size distributions before the VACES and the distributions of the various inorganic and organic components are retained, in agreement with several previous studies of particle concentrators (Kim et al. Citation2001b; Misra et al. Citation2004; Khlystov et al. Citation2005; Maciejczyk et al. Citation2005; Zhao et al. Citation2005; Freney et al. Citation2006; Taghvaee et al. Citation2019; Soleimanian, Taghvaee, and Sioutas Citation2020; Shang et al. Citation2021a, Citation2021b). A previous study of the VACES using AMS reported gas phase condensation forming small nitrate particles under high ambient mass concentration conditions, which was not observed here, but in that case the mass increase of nitrate was <10% of the total mass after the VACES (Khlystov et al. Citation2005). Our results suggest little to no mixing of different particle sizes within VACES.
Figure 5. (a–c) Size distributions of ambient particles for three typical sampling periods before (light colors) and after the VACES (dark colors). (Green = organics, red = sulfate, blue = nitrate, pink = chloride.).
A convenient way to examine the enrichment efficiency of organics is through the ratio of the mass concentration measured after the VACES to that before the VACES where Mafter is scaled down by its expected EFtheor:
(1)
(1)
A mass concentration ratio of one indicates that the measured mass concentrations were enriched by the intended enrichment factor, while Mratio > 1 indicates over-enrichment and <1 indicates under-enrichment. Mratio was calculated for each time period (one to four each day) in both seasons. Similar expressions have been used in previous studies of particle concentrators (Khlystov et al. Citation2005; McWhinney et al. Citation2012). EquationEquation (1)(1)
(1) allows for comparisons over months of operation even if absolute values of EFtheor change.
shows Mratio as a function of the initial (unconcentrated) O/C of ambient particles for studies during two different time periods, one in the spring/summer and one in the summer/fall. Those with lower O/C are significantly under-enriched relative to the expected EFtheor, and there is no significant trend with mass concentrations. The mass concentration ratio shows a similar trend with the average oxidation state of carbon, OSc (), another indicator of oxidation level which is defined as 2 O/C–H/C (Kroll et al. Citation2011). shows the corresponding plot of Mratio plotted as a function of H/C of ambient particles. There is a trend toward under-enrichment of particles with higher H/C in both seasons. In short, the VACES tends to under-enrich ambient particles with lower initial O/C and higher H/C, i.e., the least oxidized particles. Ambient UFP typically have low O/C and OSc, and high H/C relative to accumulation mode organic particles, which has often been shown using mass spectral markers (Alfarra et al. Citation2004; Allan et al. Citation2004; Drewnick et al. Citation2004; Zhang et al. Citation2004, Citation2005a, Citation2005b, Citation2007; McFiggans et al. Citation2005; Docherty et al. Citation2008). This trend in composition with particle diameter also emerges in this study. shows size distributions of several mass spectral markers over a range of time periods. In general, the marker m/z 44 (predominantly CO2+), which is intense in oxygenated organics, lies in the accumulation mode and m/z 57 (predominantly C4H9+), which is commonly observed for traffic-related emissions, is significant for the UFP mode. The additional peaks, m/z 43 and 55, have both oxidized and unoxidized sources and appear in both modes in this study. The UFP mode of these ambient particles is composed primarily of unoxidized compounds. Thus, the under-enrichment of low O/C particles by the VACES falls disproportionately on UFP.
Figure 6. Organic mass concentration ratios (EquationEquation (1)(1)
(1) ) after VACES enrichment versus (a) O/C of ambient particles (b) OSc of ambient particles and (c) H/C of ambient particles for Period 1 (Spring/Summer, circles, EFtheor = 15) and Period 2 (Summer/Fall, diamonds, EFtheor = 10). SOA data are included (asterisks). Data points are colored by their measured ambient organic mass concentrations.
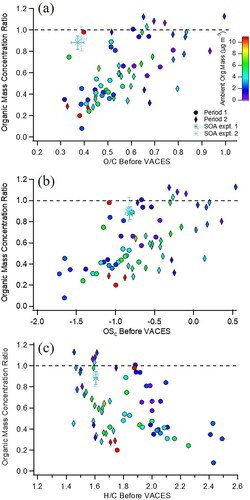
also compares Mratio for both SOA samples to ambient particles. SOA particles (asterisks) appear to be much more efficiently enriched than ambient particles with the same initial O/C ratio (). However, this difference is not as significant when their OSc is examined. The average carbon oxidation state of SOA (OSc = −0.82) falls at the upper end of wide-ranging enrichments exhibited by ambient particles of the same OSc. The least oxidized particles with OSc < −1.1, typical of hydrocarbon-like organic aerosol (Kroll et al. Citation2011), are less enriched than SOA. OSc may be more representative of composition here because it is less sensitive to changes from loss of water during measurement that can occur in the AMS (Kroll et al. Citation2011; Canagaratna et al. Citation2015). With respect to H/C, SOA also lies within the wide range of similar H/C ambient particles. This comparison suggests bulk oxidation measurements (O/C, OSC, or H/C) of ambient organic particles are not complete indicators of their ability to be enriched in the VACES, i.e., ambient particle samples with O/C = 0.4 are not efficiently enriched, while the larger SOA particles are. It is likely that diameter and bimodality of ambient particles contribute to this and that the low O/C of ultrafines is not represented in the average due to their smaller mass concentrations.
A search for an enhancement in high molecular weight fragments (m/z > 150) was also made for the ambient particle data. Large increases (>100%) were seen on some days, with decreases of ∼50% on others, reflecting the variability typical of ambient particles. Difference mass spectra of ambient particles for several sampling periods, with the HMW region enlarged, are shown in c. A gain in HMW compounds is seen for the May 18 time period, but is negligible for the other two periods. This is also evident when the mass spectra are expressed as a percent difference relative to the initial spectrum (). From , only accumulation mode diameter particles were present on May 18 and no UFP mode was detected, thus the individual mass concentrations of UFP and accumulation mode particles were examined for all periods.
Figure 7. (a–c) Difference mass spectra for ambient particles for three typical sampling periods. Each spectrum is the difference between after the VACES divided by its EFmass and before the VACES. Positive peaks at m/z > 150 show gain in HMW compounds after the VACES and negative peaks show loss after the VACES. (d–f) The difference mass spectra expressed as a percentage relative to the initial mass spectrum.
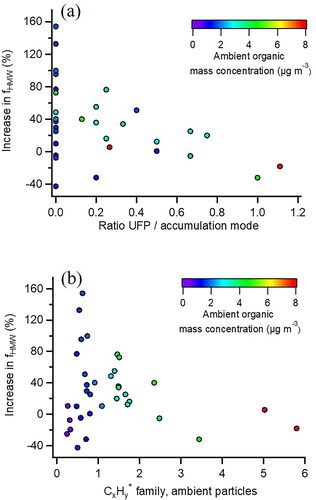
shows the change in HMW compounds plotted against the ratio of the UFP to accumulation mode mass concentration measured before the VACES. Periods with the smallest contributions of UFP and larger accumulation modes, exhibited the largest increases in fHMW values. Periods that did not follow the trend were those with low ambient mass concentrations (purple) which had low signal-to-noise in size distributions and at higher m/z, increasing the uncertainty in fHMW and individual mode masses. A similar trend is shown in in which the change in HMW compounds is plotted against the CxHy+ family of ions measured before the VACES, an indicator of UFP composition. Larger increases in HMW compounds were observed for particles with less CxHy+ ions, i.e., more oxidized organic particles. It is possible that the components of UFP may also yield fragments with m/z > 150 after the VACES but may be masked by the under-enrichment of UFP in the VACES.
Figure 8. Change in fHMW after VACES for ambient particles (a) as a function of ratio of UFP to accumulation mode mass (b) as a function of CxHy+ composition of ambient particles. Data points are colored by the mass concentration of organics of ambient (unconcentrated) particles before the VACES.
The mass spectra of ambient particles collected before and after the VACES show significant fragments containing CxHy+, CxHyO1+, and CxHyO>1+ (). Fragments containing CxHyN+ also appear in most ambient spectra at m/z 30, corresponding to CH4N+, and m/z 42–45, corresponding to C2HyN+ (y = 4–7) and tend to be under-enriched after the VACES. Analysis of the signal intensities as a function of carbon number () shows that most CxHyN+ fragments contain one or two carbon atoms after the VACES as well as before, suggesting they do not contribute significantly to oligomerization. Comparison with the NIST database suggests that these CxHyN+ fragments correspond to low molecular weight primary or secondary aliphatic amines, diamines, amides, or amino acids (NIST 2021). Such compounds have a number of potential sources in this study including marine biological activity at the ocean or a nearby wetland reserve, automobile exhaust, port activity, biomass burning or cooking, and agricultural activity (Ge, Wexler, and Clegg Citation2011; Gaston et al. Citation2013; Sintermann and Neftel Citation2015; Poudel et al. Citation2017). Changes in amines and ammonia have been observed previously in particle concentrators (Su et al. Citation2006; Jung et al. Citation2010; Saarikoski et al. Citation2014). For example, in one study using the VACES, amines were observed to be over-enriched, which was attributed to uptake during neutralization of acids in the particles (Saarikoski et al. Citation2014). Similarly, an increase in amines in the 100–300 nm range with the VACES system has been reported, while in the same study, there was a loss of amines from volatilization using the Harvard concentrator system, which thermally dries the particles (Su et al. Citation2006). The under-enrichment observed here using diffusion dryers may similarly be due to volatilization during drying. Small enrichments in gaseous ammonia have been reported in the VACES for ambient and laboratory-generated particles (Jung et al. Citation2010), but are likely to be minor in the current study since the observed nitrogen-containing fragments are higher before the VACES than after.
The supersaturation of water vapor, which is determined by Tsat, is a major factor in determining the ability of a particle to grow to the size range that allows it to pass through the virtual impactor, and hence in determining enrichment factors (Gupta, Demokritou, and Koutrakis Citation2004; Petäjä et al. Citation2006). Studies characterizing water-based condensation particle counters have shown that activation of smaller particles is more efficient when the temperature difference between the saturator and condenser is larger (Petäjä et al. Citation2006; Wlasits et al. Citation2020). As part of the current studies, Tsat was increased in separate experiments during ambient particle enrichment while holding Tcond constant at 10 °C. shows size distributions collected at Tsat of 30 °C and 33 °C (saturation ratios of 3.5 and 4.1, respectively, ), demonstrating that increased enrichment of organic UFP can occur at higher Tsat. This increase in saturation ratio resulted in a decrease in O/C from 0.57 at Tsat = 30 °C to 0.33 at Tsat = 33 °C and an increase in H/C from 1.77 to 1.90. Since UFP generally have lower O/C ratios, a larger contribution from the UFP mode can change the O/C significantly. Consistent with this, fragments at m/z 55 and 57, characteristic of hydrocarbons, increase with Tsat and m/z 43 (from both C2H3O+ and C3H7+) also increases with Tsat. However, saturation ratios > 3.5 can induce homogeneous water nucleation (Hinds Citation1999), which accelerates liquid water accumulation in the virtual impactor and decreases enrichment factors. Thus, Tsat is generally kept at or below 31 °C to avoid this.
A number of studies of uptake of water or butanol on organic particles have been carried out with respect to understanding particle growth in condensation particle counters. Uptake of water and butanol to detect the smallest particles (∼1–2 nm) was shown to depend on the particle composition, for example solubility in the condensing fluid (i.e., H2O in the VACES) (Hering and Stolzenburg Citation2005; Petäjä et al. Citation2006; McGraw, Wang, and Kuang Citation2012; Hering, Spielman, and Lewis Citation2014; Hering et al. Citation2017; Kangasluoma and Attoui Citation2019; Wlasits et al. Citation2020). Under-enrichment of less oxidized ambient particles is likely a combination of size and composition. The SOA particles have mode diameters in the ∼300–400 nm range, whereas a large fraction of low O/C ambient particles had diameters <200 nm. Obtaining reliable and stable VACES data requires a sufficiently long sampling time that smaller SOA particles had already grown to larger sizes so that data on SOA UFP could not be accessed experimentally. As seen in , there is a trend to smaller enrichment factors at smaller diameters, consistent with the results of a number of other studies (Hering and Stolzenburg Citation2005; Maciejczyk et al. Citation2005; Su et al. Citation2006; McWhinney et al. Citation2012; Rastogi et al. Citation2012; Gute et al. Citation2019). Thus, ambient particles with a significant contribution from the smaller UFP mode are expected to be less efficiently enriched. In addition, UFP have lower OSc and O/C than accumulation mode particles (Alfarra et al. Citation2004; Allan et al. Citation2004; Drewnick et al. Citation2004; Zhang et al. Citation2004; McFiggans et al. Citation2005; Zhang et al. Citation2005a, Citation2005b, Citation2007; Docherty et al. Citation2008), suggesting they are less polar and hence less soluble. For example, when UFP were isolated from a whole air sample with a 180-nm cut-point slit impactor (Kim et al. Citation2001b; Misra et al. Citation2002) the O/C after the VACES was 0.22 ± 0.03 (OSc = −1.38 ± 0.2), which was much lower than the 0.45 ± 0.04 (OSc = −0.75 ± 0.07) for the combined UFP and accumulation modes after the VACES. The lower O/C (OSc) of isolated UFP are not well represented in the O/C measurements of whole/bimodal particle samples and thus their less polar composition may contribute more to under-enrichment when there is a larger UFP mode.
Summary and conclusions
As particle concentrators and other similar water condensation methods are used to increase particle concentrations for both health effects and particle composition studies, it is important to understand what changes, if any, are induced by the uptake of water followed by drying. The Versatile Aerosol Concentration Enrichment System (VACES) was characterized with a focus on the submicron organic composition of particles using aerosol mass spectrometry applied both to SOA particles from the reaction of ozone with α-pinene and to ambient air particles. Size distributions for SOA particles were conserved within instrumental uncertainty. SOA particles after the VACES showed evidence for oligomerization, even though there were only slight changes in the overall elemental composition. Oligomerization was also observed for ambient particles, specifically for higher O/C particles contained in the accumulation mode. Ambient ultrafine particles with low O/C were under-enriched so that oligomerization, if it was occurring, may not have been detectable. Whether this is significant for health effects studies and composition measurements using particle concentrators remains to be explored.
Supplemental Material
Download PDF (281.2 KB)Acknowledgments
The authors wish to thank Mr. Michael Ezell, Dr. Veronique Perraud, and Dr. Yue Zhao for assistance with transporting the AMS. We also appreciate the staff from the Department of Chemistry and the Division of Occupational and Environmental Medicine, Department of Medicine.
Data availability statement
The data that support the findings of this study are archived and openly available at http://doi.org/10.7280/D1VH7W.
Additional information
Funding
References
- Alfarra, M. R., H. Coe, J. D. Allan, K. N. Bower, H. Boudries, M. R. Canagaratna, J. L. Jimenez, J. T. Jayne, A. A. Garforth, S.-M. Li, et al. 2004. Characterization of urban and rural organic particulate in the lower fraser valley using two aerodyne aerosol mass spectrometers. Atmos. Environ. 38 (34):5745–58. doi:10.1016/j.atmosenv.2004.01.054.
- Allan, J. D., K. N. Bower, H. Coe, H. Boudries, J. T. Jayne, M. R. Canagaratna, D. B. Millet, A. H. Goldstein, P. K. Quinn, R. J. Weber, et al. 2004. Submicron aerosol composition at Trinidad Head, California, during ITCT 2K2: Its relationship with gas phase volatile organic carbon and assessment of instrument performance. J. Geophys. Res.: Atmos. 109:D23S24. doi:10.1029/2003JD004208.
- Apte, J. S., M. Brauer, A. J. Cohen, M. Ezzati, and C. A. Pope. 2018. Ambient PM2.5 reduces global and regional life expectancy. Environ. Sci. Technol. Lett. 5 (9):546–51. doi:10.1021/acs.estlett.8b00360.
- Araujo, J. A., B. Barajas, M. Kleinman, X. Wang, B. J. Bennett, K. W. Gong, M. Navab, J. Harkema, C. Sioutas, A. J. Lusis, et al. 2008. Ambient particulate pollutants in the ultrafine range promote early atherosclerosis and systemic oxidative stress. Circ. Res. 102 (5):589–96. doi:10.1161/CIRCRESAHA.107.164970.
- Baltensperger, U., J. Dommen, M. R. Alfarra, J. Duplissy, K. Gaeggeler, A. Metzger, M. C. Facchini, S. Decesari, E. Finessi, C. Reinnig, et al. 2008. Combined determination of the chemical composition and of health effects of secondary organic aerosols: The polysoa project. J. Aerosol Med. Pulm. Drug Deliv. 21 (1):145–54. doi:10.1089/jamp.2007.0655.
- Banerjee, S., E. Gnanamani, X. Yan, and R. N. Zare. 2017. Can all bulk-phase reactions be accelerated in microdroplets? Analyst 142 (9):1399–402. doi:10.1039/C6AN02225A.
- Barsanti, K. C., and J. F. Pankow. 2004. Thermodynamics of the formation of atmospheric organic particulate matter by accretion reactions—part 1: Aldehydes and ketones. Atmos. Environ. 38 (26):4371–82. doi:10.1016/j.atmosenv.2004.03.035.
- Barsanti, K. C., and J. F. Pankow. 2005. Thermodynamics of the formation of atmospheric organic particulate matter by accretion reactions—part 2. Dialdehydes, methylglyoxal, and diketones. Atmos. Environ. 39 (35):6597–607. doi:10.1016/j.atmosenv.2005.07.056.
- Barsanti, K. C., and J. F. Pankow. 2006. Thermodynamics of the formation of atmospheric organic particulate matter by accretion reactions—part 3: Carboxylic and dicarboxylic acids. Atmos. Environ. 40 (34):6676–86. doi:10.1016/j.atmosenv.2006.03.013.
- Bourdrel, T., M.-A. Bind, Y. Béjot, O. Morel, and J.-F. Argacha. 2017. Cardiovascular effects of air pollution. Arch. Cardiovasc. Dis. 110 (11):634–42. doi:10.1016/j.acvd.2017.05.003.
- Brown, D. M., M. R. Wilson, W. MacNee, V. Stone, and K. Donaldson. 2001. Size-dependent proinflammatory effects of ultrafine polystyrene particles: A role for surface area and oxidative stress in the enhanced activity of ultrafines. Toxicol. Appl. Pharmacol. 175 (3):191–9. doi:10.1006/taap.2001.9240.
- Canagaratna, M. R., J. L. Jimenez, J. H. Kroll, Q. Chen, S. H. Kessler, P. Massoli, L. Hildebrandt Ruiz, E. Fortner, L. R. Williams, K. R. Wilson, et al. 2015. Elemental ratio measurements of organic compounds using aerosol mass spectrometry: Characterization, improved calibration, and implications. Atmos. Chem. Phys. 15 (1):253–72. doi:10.5194/acp-15-253-2015.
- Chen, Q., C. L. Heald, J. L. Jimenez, M. R. Canagaratna, Q. Zhang, L.-Y. He, X.-F. Huang, P. Campuzano-Jost, B. B. Palm, L. Poulain, et al. 2015. Elemental composition of organic aerosol: The gap between ambient and laboratory measurements. Geophys. Res. Lett. 42 (10):4182–9. doi:10.1002/2015GL063693.
- Cho, A. K., C. Sioutas, A. H. Miguel, Y. Kumagai, D. A. Schmitz, M. Singh, A. Eiguren-Fernandez, and J. R. Froines. 2005. Redox activity of airborne particulate matter at different sites in the Los Angeles basin. Environ. Res. 99 (1):40–7. doi:10.1016/j.envres.2005.01.003.
- Corrigan, A. L., S. W. Hanley, and D. O. De Haan. 2008. Uptake of glyoxal by organic and inorganic aerosol. Environ. Sci. Technol. 42 (12):4428–33. doi:10.1021/es7032394.
- De Haan, D. O., A. L. Corrigan, M. A. Tolbert, J. L. Jimenez, S. E. Wood, and J. J. Turley. 2009. Secondary organic aerosol formation by self-reactions of methylglyoxal and glyoxal in evaporating droplets. Environ. Sci. Technol. 43 (21):8184–90. doi:10.1021/es902152t.
- DeCarlo, P. F., J. R. Kimmel, A. Trimborn, M. J. Northway, J. T. Jayne, A. C. Aiken, M. Gonin, K. Fuhrer, T. Horvath, K. S. Docherty, et al. 2006. Field-deployable, high-resolution, time-of-flight aerosol mass spectrometer. Anal. Chem. 78 (24):8281–9. doi:10.1021/ac061249n.
- Delfino, R. J., C. Sioutas, and S. Malik. 2005. Potential role of ultrafine particles in associations between airborne particle mass and cardiovascular health. Environ. Health Perspect. 113 (8):934–46. doi:10.1289/ehp.7938.
- Demokritou, P., T. Gupta, and P. Koutrakis. 2002. A high volume apparatus for the condensational growth of ultrafine particles for inhalation toxicological studies. Aerosol Sci. Technol. 36 (11):1061–72. doi:10.1080/02786820290092230.
- Docherty, K. S., M. Jaoui, E. Corse, J. L. Jimenez, J. H. Offenberg, M. Lewandowski, and T. E. Kleindienst. 2013. Collection efficiency of the aerosol mass spectrometer for chamber-generated secondary organic aerosols. Aerosol Sci. Technol. 47 (3):294–309. doi:10.1080/02786826.2012.752572.
- Docherty, K. S., E. A. Stone, I. M. Ulbrich, P. F. DeCarlo, D. C. Snyder, J. J. Schauer, R. E. Peltier, R. J. Weber, S. M. Murphy, J. H. Seinfeld, et al. 2008. Apportionment of primary and secondary organic aerosols in Southern California during the 2005 study of organic aerosols in riverside (soar-1). Environ. Sci. Technol. 42 (20):7655–62. doi:10.1021/es8008166.
- Dockery, D. W., C. A. Pope, X. Xu, J. D. Spengler, J. H. Ware, M. E. Fay, B. G. Ferris, and F. E. Speizer. 1993. An association between air pollution and mortality in six U.S. cities. N. Engl. J. Med. 329 (24):1753–9. doi:10.1056/nejm199312093292401.
- Drewnick, F., J. T. Jayne, M. Canagaratna, D. R. Worsnop, and K. L. Demerjian. 2004. Measurement of ambient aerosol composition during the PMTACS-NY 2001 using an aerosol mass spectrometer. Part II: Chemically speciated mass distributions special issue of aerosol science and technology on findings from the fine particulate matter supersites program. Aerosol Sci. Technol. 38 (sup1):104–17. doi:10.1080/02786820390229534.
- Fick, J., C. Nilsson, and B. Andersson. 2004. Formation of oxidation products in a ventilation system. Atmos. Environ. 38 (35):5895–9. doi:10.1016/j.atmosenv.2004.08.020.
- Fick, J., L. Pommer, C. Nilsson, and B. Andersson. 2003. Effect of oh radicals, relative humidity, and time on the composition of the products formed in the ozonolysis of α-pinene. Atmos. Environ. 37 (29):4087–96. doi:10.1016/S1352-2310(03)00522-3.
- Finlayson-Pitts, B. J., and J. N. Pitts. 2000. Chemistry of the upper and lower atmosphere: Theory, experiments, and applications. San Diego: Academic Press.
- Freney, E. J., M. R. Heal, R. J. Donovan, N. L. Mills, K. Donaldson, D. E. Newby, P. H. Fokkens, and F. R. Cassee. 2006. A single-particle characterization of a mobile versatile aerosol concentration enrichment system for exposure studies. Part. Fibre Toxicol. 3:8. doi:10.1186/1743-8977-3-8.
- Gao, S., M. Keywood, N. L. Ng, J. Surratt, V. Varutbangkul, R. Bahreini, R. C. Flagan, and J. H. Seinfeld. 2004. Low-molecular-weight and oligomeric components in secondary organic aerosol from the ozonolysis of cycloalkenes and α-pinene. J. Phys. Chem. A 108 (46):10147–64. doi:10.1021/jp047466e.
- Gaschen, A., D. Lang, M. Kalberer, M. Savi, T. Geiser, A. Gazdhar, C. M. Lehr, M. Bur, J. Dommen, U. Baltensperger, et al. 2010. Cellular responses after exposure of lung cell cultures to secondary organic aerosol particles. Environ. Sci. Technol. 44 (4):1424–30. doi:10.1021/es902261m.
- Gaston, C. J., P. K. Quinn, T. S. Bates, J. B. Gilman, D. M. Bon, W. C. Kuster, and K. A. Prather. 2013. The impact of shipping, agricultural, and urban emissions on single particle chemistry observed aboard the R/V Atlantis during CalNex. J. Geophys. Res. Atmos. 118 (10):5003–17. doi:10.1002/jgrd.50427.
- Ge, X., A. S. Wexler, and S. L. Clegg. 2011. Atmospheric amines – Part I. A review. Atmos. Environ. 45 (3):524–46. doi:10.1016/j.atmosenv.2010.10.012.
- Geller, M. D., S. Kim, C. Misra, C. Sioutas, B. A. Olson, and V. A. Marple. 2002. A methodology for measuring size-dependent chemical composition of ultrafine particles. Aeros. Sci. Technol. 36 (6):748–62. doi:10.1080/02786820290038447.
- Gupta, T., P. Demokritou, and P. Koutrakis. 2004. Development and performance evaluation of a high-volume ultrafine particle concentrator for inhalation toxicological studies. Inhal. Toxicol. 16 (13):851–62. doi:10.1080/08958370490506664.
- Gute, E., L. Lacher, Z. A. Kanji, R. Kohl, J. Curtius, D. Weber, H. Bingemer, H.-C. Clemen, J. Schneider, M. Gysel-Beer, et al. 2019. Field evaluation of a portable fine particle concentrator (PFPC) for ice nucleating particle measurements. Aeros. Sci. Technol. 53 (9):1067–78. doi:10.1080/02786826.2019.1626346.
- Hall, W. A., and M. V. Johnston. 2012. Oligomer formation pathways in secondary organic aerosol from MS and MS/MS measurements with high mass accuracy and resolving power. J. Am. Soc. Mass Spectrom. 23 (6):1097–108. doi:10.1007/s13361-012-0362-6.
- Hering, S. V., G. S. Lewis, S. R. Spielman, A. Eiguren-Fernandez, N. M. Kreisberg, C. Kuang, and M. Attoui. 2017. Detection near 1-nm with a laminar-flow, water-based condensation particle counter. Aerosol Sci. Technol. 51 (3):354–62. doi:10.1080/02786826.2016.1262531.
- Hering, S. V., S. R. Spielman, and G. S. Lewis. 2014. Moderated, water-based, condensational particle growth in a laminar flow. Aerosol Sci. Technol. 48 (4):401–8. doi:10.1080/02786826.2014.881460.
- Hering, S. V., and M. R. Stolzenburg. 2005. A method for particle size amplification by water condensation in a laminar, thermally diffusive flow. Aerosol Sci. Technol. 39 (5):428–36. doi:10.1080/027868290953416.
- Herman, D. A., L. M. Wingen, R. M. Johnson, A. J. Keebaugh, S. R. Renusch, I. Hasen, A. Ting, and M. T. Kleinman. 2020. Seasonal effects of ambient PM2.5 on the cardiovascular system of hyperlipidemic mice. J. Air Waste Manag. Assoc. 70 (3):307–23. doi:10.1080/10962247.2020.1717674.
- Hinds, W. C. 1999. Aerosol technology: Properties, behavior, and measurement of airborne particles. New York: Wiley.
- Hwang, B., T. Fang, R. Pham, J. Wei, S. Gronstal, B. Lopez, C. Frederickson, T. Galeazzo, X. Wang, H. Jung, et al. 2021. Environmentally persistent free radicals, reactive oxygen species generation, and oxidative potential of highway PM2.5. ACS Earth Space Chem. 5 (8):1865–75. doi:10.1021/acsearthspacechem.1c00135.
- Jimenez, J. L., M. R. Canagaratna, N. M. Donahue, A. S. H. Prevot, Q. Zhang, J. H. Kroll, P. F. DeCarlo, J. D. Allan, H. Coe, N. L. Ng, et al. 2009. Evolution of organic aerosols in the atmosphere. Science 326 (5959):1525–9. doi:10.1126/science.1180353.
- Jung, H., C. Arellanes, Y. Zhao, S. Paulson, C. Anastasio, and A. Wexler. 2010. Impact of the versatile aerosol concentration enrichment system (VACES) on gas phase species. Aerosol Sci. Technol. 44 (12):1113–21. doi:10.1080/02786826.2010.512028.
- Kangasluoma, J., and M. Attoui. 2019. Review of sub-3 nm condensation particle counters, calibrations, and cluster generation methods. Aerosol Sci. Technol. 53 (11):1277–310. doi:10.1080/02786826.2019.1654084.
- Keebaugh, A. J., C. Sioutas, P. Pakbin, J. J. Schauer, L. B. Mendez, and M. T. Kleinman. 2015. Is atherosclerotic disease associated with organic components of ambient fine particles? Sci. Total Environ. 533:69–75. doi:10.1016/j.scitotenv.2015.06.048.
- Khlystov, A., Q. Zhang, J. L. Jimenez, C. Stanier, S. N. Pandis, M. R. Canagaratna, P. Fine, C. Misra, and C. Sioutas. 2005. In situ concentration of semi-volatile aerosol using water-condensation technology. J. Aerosol Sci. 36 (7):866–80. doi:10.1016/j.jaerosci.2004.11.005.
- Kidd, C., V. Perraud, and B. J. Finlayson-Pitts. 2014. Surfactant-free latex spheres for size calibration of mobility particle sizers in atmospheric aerosol applications. Atmos. Environ. 82:56–9. doi:10.1016/j.atmosenv.2013.09.056.
- Kilian, J., and M. Kitazawa. 2018. The emerging risk of exposure to air pollution on cognitive decline and Alzheimer's disease - Evidence from epidemiological and animal studies. Biomed. J. 41 (3):141–62. doi:10.1016/j.bj.2018.06.001.
- Kim, S., P. A. Jaques, M. Chang, T. Barone, C. Xiong, S. K. Friedlander, and C. Sioutas. 2001a. Versatile aerosol concentration enrichment system (VACES) for simultaneous in vivo and in vitro evaluation of toxic effects of ultrafine, fine and coarse ambient particles part II: Field evaluation. J. Aerosol Sci. 32 (11):1299–314. doi:10.1016/S0021-8502(01)00058-1.
- Kim, S., P. A. Jaques, M. Chang, J. R. Froines, and C. Sioutas. 2001b. Versatile aerosol concentration enrichment system (VACES) for simultaneous in vivo and in vitro evaluation of toxic effects of ultrafine, fine and coarse ambient particles part I: Development and laboratory characterization. J. Aerosol Sci. 32 (11):1281–97. doi:10.1016/S0021-8502(01)00057-X.
- Kleinman, M. T., L. M. Wingen, D. A. Herman, R. Johnson, and A. Keebaugh. 2018. Can reactions between ozone and organic constituents of ambient particulate matter influence effects on the cardiovascular system? In Multiphase environmental chemistry in the atmosphere, 439–58. Washington, DC: American Chemical Society.
- Kourtchev, I., C. Giorio, A. Manninen, E. Wilson, B. Mahon, J. Aalto, M. Kajos, D. Venables, T. Ruuskanen, J. Levula, et al. 2016. Enhanced volatile organic compounds emissions and organic aerosol mass increase the oligomer content of atmospheric aerosols. Sci. Rep. 6:35038. doi:10.1038/srep35038.
- Krapf, M., L. Künzi, S. Allenbach, E. A. Bruns, I. Gavarini, I. El-Haddad, J. G. Slowik, A. S. H. Prévôt, L. Drinovec, G. Močnik, et al. 2017. Wood combustion particles induce adverse effects to normal and diseased airway epithelia. Environ. Sci. Process. Impacts. 19 (4):538–48. doi:10.1039/C6EM00586A.
- Kristensen, K., T. Cui, H. Zhang, A. Gold, M. Glasius, and J. D. Surratt. 2014. Dimers in α-pinene secondary organic aerosol: Effect of hydroxyl radical, ozone, relative humidity and aerosol acidity. Atmos. Chem. Phys. 14 (8):4201–18. doi:10.5194/acp-14-4201-2014.
- Kristensen, K., Å. K. Watne, J. Hammes, A. Lutz, T. Petäjä, M. Hallquist, M. Bilde, and M. Glasius. 2016. High-molecular weight dimer esters are major products in aerosols from α-pinene ozonolysis and the boreal forest. Environ. Sci. Technol. Lett. 3 (8):280–5. doi:10.1021/acs.estlett.6b00152.
- Krizner, H. E., D. O. De Haan, and J. Kua. 2009. Thermodynamics and kinetics of methylglyoxal dimer formation: A computational study. J. Phys. Chem. A 113 (25):6994–7001. doi:10.1021/jp903213k.
- Kroll, J. H., N. M. Donahue, J. L. Jimenez, S. H. Kessler, M. R. Canagaratna, K. R. Wilson, K. E. Altieri, L. R. Mazzoleni, A. S. Wozniak, H. Bluhm, et al. 2011. Carbon oxidation state as a metric for describing the chemistry of atmospheric organic aerosol. Nat. Chem. 3 (2):133–9. doi:10.1038/nchem.948.
- Kroll, J. H., and J. H. Seinfeld. 2008. Chemistry of secondary organic aerosol: Formation and evolution of low-volatility organics in the atmosphere. Atmos. Environ. 42 (16):3593–624. doi:10.1016/j.atmosenv.2008.01.003.
- Laden, F., J. Schwartz, F. E. Speizer, and D. W. Dockery. 2006. Reduction in fine particulate air pollution and mortality: Extended follow-up of the Harvard Six Cities study. Am. J. Respir. Crit. Care Med. 173 (6):667–72. doi:10.1164/rccm.200503-443OC.
- Lawrence, J., J. M. Wolfson, S. Ferguson, P. Koutrakis, and J. Godleski. 2004. Performance stability of the Harvard ambient particle concentrator. Aerosol Sci. Technol. 38 (3):219–27. doi:10.1080/02786820490261735.
- Lepistö, T., H. Kuuluvainen, P. Juuti, A. Järvinen, A. Arffman, and T. Rönkkö. 2020. Measurement of the human respiratory tract deposited surface area of particles with an electrical low pressure impactor. Aerosol Sci. Technol. 54 (8):958–71. doi:10.1080/02786826.2020.1745141.
- Li, N., C. Sioutas, A. Cho, D. Schmitz, C. Misra, J. Sempf, M. Wang, T. Oberley, J. Froines, and A. Nel. 2003. Ultrafine particulate pollutants induce oxidative stress and mitochondrial damage. Environ. Health Perspect. 111 (4):455–60. doi:10.1289/ehp.6000.
- Lippmann, M., and L.-C. Chen. 2009. Health effects of concentrated ambient air particulate matter (caps) and its components. Crit. Rev. Toxicol. 39 (10):865–913. doi:10.3109/10408440903300080.
- Loeffler, K. W., C. A. Koehler, N. M. Paul, and D. O. De Haan. 2006. Oligomer formation in evaporating aqueous glyoxal and methyl glyoxal solutions. Environ. Sci. Technol. 40 (20):6318–23. doi:10.1021/es060810w.
- Maciejczyk, P., M. Zhong, Q. Li, J. Xiong, C. Nadziejko, and L. C. Chen. 2005. Effects of subchronic exposures to concentrated ambient particles (caps) in mice. II. The design of a caps exposure system for biometric telemetry monitoring. Inhal. Toxicol. 17 (4–5):189–97. doi:10.1080/08958370590912743.
- Matthew, B. M., A. M. Middlebrook, and T. B. Onasch. 2008. Collection efficiencies in an aerodyne aerosol mass spectrometer as a function of particle phase for laboratory generated aerosols. Aerosol Sci. Technol. 42 (11):884–98. doi:10.1080/02786820802356797.
- McFiggans, G., M. R. Alfarra, J. Allan, K. Bower, H. Coe, M. Cubison, D. Topping, P. Williams, S. Decesari, C. Facchini, et al. 2005. Simplification of the representation of the organic component of atmospheric particulates. Faraday Discuss. 130:341–62. doi:10.1039/B419435G.
- McGraw, R., J. Wang, and C. Kuang. 2012. Kinetics of heterogeneous nucleation in supersaturated vapor: Fundamental limits to neutral particle detection revisited. Aerosol Sci. Technol. 46 (9):1053–64. doi:10.1080/02786826.2012.687844.
- McWhinney, R. D., N. Rastogi, B. Urch, F. Silverman, J. R. Brook, G. J. Evans, and J. P. D. Abbatt. 2012. Characterization of the University of Toronto Concentrated Aerosol Particle Exposure Facility (CAPEF)—Effects on fine and ultrafine nonrefractory aerosol composition. Aerosol Sci. Technol. 46 (6):697–707. doi:10.1080/02786826.2012.656769.
- Mesquita, S. R., B. L. van Drooge, M. Dall'Osto, J. O. Grimalt, C. Barata, N. Vieira, L. Guimarães, and B. Piña. 2017. Toxic potential of organic constituents of submicron particulate matter (PM1) in an urban road site (Barcelona). Environ. Sci. Pollut. Res. Int. 24 (18):15406–15. doi:10.1007/s11356-017-9201-4.
- Middlebrook, A. M., R. Bahreini, J. L. Jimenez, and M. R. Canagaratna. 2012. Evaluation of composition-dependent collection efficiencies for the aerodyne aerosol mass spectrometer using field data. Aerosol Sci. Technol. 46 (3):258–71. doi:10.1080/02786826.2011.620041.
- Miller, K. A., D. S. Siscovick, L. Sheppard, K. Shepherd, J. H. Sullivan, G. L. Anderson, and J. D. Kaufman. 2007. Long-term exposure to air pollution and incidence of cardiovascular events in women. N. Engl. J. Med. 356 (5):447–58. doi:10.1056/NEJMoa054409.
- Misra, C., P. M. Fine, M. Singh, and C. Sioutas. 2004. Development and evaluation of a compact facility for exposing humans to concentrated ambient ultrafine particles. Aerosol Sci. Technol. 38 (1):27–35. doi:10.1080/02786820490247605.
- Misra, C., S. Kim, S. Shen, and C. Sioutas. 2002. A high flow rate, very low pressure drop impactor for inertial separation of ultrafine from accumulation mode particles. J. Aerosol Sci. 33 (5):735–52. doi:10.1016/S0021-8502(01)00210-5.
- Moffet, R. C., L. G. Shields, J. Berntsen, R. B. Devlin, and K. A. Prather. 2004. Characterization of an ambient coarse particle concentrator used for human exposure studies: Aerosol size distributions, chemical composition, and concentration enrichment. Aerosol Sci. Technol. 38 (11):1123–37. doi:10.1080/027868290890344.
- Molteni, U., M. Simon, M. Heinritzi, C. R. Hoyle, A.-K. Bernhammer, F. Bianchi, M. Breitenlechner, S. Brilke, A. Dias, J. Duplissy, et al. 2019. Formation of highly oxygenated organic molecules from α-pinene ozonolysis: Chemical characteristics, mechanism, and kinetic model development. ACS Earth Space Chem. 3 (5):873–83. doi:10.1021/acsearthspacechem.9b00035.
- Nel, A. 2005. Atmosphere. Air pollution-related illness: Effects of particles. Erratum in Science, 2005 Aug 2026; 2309 (5739):1326. Science 308 (5723):804–6. doi:10.1126/science.1108752.
- Nemmar, A., P. H. Hoet, B. Vanquickenborne, D. Dinsdale, M. Thomeer, M. F. Hoylaerts, H. Vanbilloen, L. Mortelmans, and B. Nemery. 2002. Passage of inhaled particles into the blood circulation in humans. Circulation 105 (4):411–4. doi:10.1161/hc0402.104118.
- NIST. 2021. NIST chemistry webbook, NIST standard reference database number 69, ed. P. J. Linstrom and W. G. Mallard, Gaithersburg, MD: National Institute of Standards and Technology Mass Spectrometry Data Center.
- Ntziachristos, L., J. R. Froines, A. K. Cho, and C. Sioutas. 2007. Relationship between redox activity and chemical speciation of size-fractionated particulate matter. Part. Fibre Toxicol. 4 (5). doi:10.1186/1743-8977-4-5.
- Nunes, F. M. N., M. C. C. Veloso, P. A. d. P. Pereira, and J. B. de Andrade. 2005. Gas-phase ozonolysis of the monoterpenoids (s)-(+)-carvone, (r)-(−)-carvone, (−)-carveol, geraniol and citral. Atmos. Environ. 39 (40):7715–30. doi:10.1016/j.atmosenv.2005.04.009.
- Oberdörster, G. 2001. Pulmonary effects of inhaled ultrafine particles. Int. Arch. Occup. Environ. Health 74:1–8. doi:10.1007/s004200000185.
- Oberdörster, G., E. Oberdörster, and J. Oberdörster. 2005. Nanotoxicology: An emerging discipline evolving from studies of ultrafine particles. Environ. Health Perspect. 113 (7):823–39. doi:10.1289/ehp.7339.
- Oberdörster, G., Z. Sharp, V. Atudorei, A. Elder, R. Gelein, W. Kreyling, and C. Cox. 2004. Translocation of inhaled ultrafine particles to the brain. Inhal. Toxicol. 16 (6–7):437–45. doi:10.1080/08958370490439597.
- Oberdörster, G., and M. J. Utell. 2002. Ultrafine particles in the urban air: To the respiratory tract-and beyond? Environ. Health Perspect. 110 (8):A440–441. doi:10.1289/ehp.110-1240959.
- Petäjä, T., G. Mordas, H. Manninen, P. P. Aalto, K. Hämeri, and M. Kulmala. 2006. Detection efficiency of a water-based TSI condensation particle counter 3785. Aerosol Sci. Technol. 40 (12):1090–7. doi:10.1080/02786820600979139.
- Petters, S. S., T. G. Hilditch, S. Tomaz, R. E. H. Miles, J. P. Reid, and B. J. Turpin. 2020. Volatility change during droplet evaporation of pyruvic acid. ACS Earth Space Chem. 4 (5):741–9. doi:10.1021/acsearthspacechem.0c00044.
- Pope, C. A. III, R. T. Burnett, G. D. Thurston, M. J. Thun, E. E. Calle, D. Krewski, and J. J. Godleski. 2004. Cardiovascular mortality and long-term exposure to particulate air pollution: Epidemiological evidence of general pathophysiological pathways of disease. Circulation 109 (1):71–7. doi:10.1161/01.cir.0000108927.80044.7f.
- Pope, C. A., and D. W. Dockery. 2006. Health effects of fine particulate air pollution: Lines that connect. J. Air Waste Manag. Assoc. 56 (6):709–42. doi:10.1080/10473289.2006.10464485.
- Pope, C. A., J. S. Lefler, M. Ezzati, J. D. Higbee, J. D. Marshall, S.-Y. Kim, M. Bechle, K. S. Gilliat, S. E. Vernon, A. L. Robinson, et al. 2019. Mortality risk and fine particulate air pollution in a large, representative cohort of U.S. Adults. Environ. Health Perspect. 127 (7):77007. doi:10.1289/EHP4438.
- Poudel, B. K., J. Choi, J. H. Park, K.-O. Doh, and J. H. Byeon. 2017. In vitro exposure of simulated meat-cooking fumes to assess adverse biological effects. Sci. Rep. 7 (1):10841. doi:10.1038/s41598-017-11502-8.
- Qi, L., S. Nakao, Q. Malloy, B. Warren, and D. R. Cocker. 2010. Can secondary organic aerosol formed in an atmospheric simulation chamber continuously age? Atmos. Environ. 44 (25):2990–6. doi:10.1016/j.atmosenv.2010.05.020.
- Qin, Y., J. Ye, P. E. Ohno, Y. Lei, J. Wang, P. Liu, R. J. Thomson, and S. T. Martin. 2020. Synergistic uptake by acidic sulfate particles of gaseous mixtures of glyoxal and pinanediol. Environ. Sci. Technol. 54 (19):11762–70. doi:10.1021/acs.est.0c02062.
- Rastogi, N., R. D. McWhinney, U. S. Akhtar, B. Urch, M. Fila, J. P. D. Abbatt, J. A. Scott, F. S. Silverman, J. R. Brook, and G. J. Evans. 2012. Physical characterization of the University of Toronto coarse, fine, and ultrafine high-volume particle concentrator systems. Aerosol Sci. Technol. 46 (9):1015–24. doi:10.1080/02786826.2012.686674.
- Ridley, D. A., C. L. Heald, K. J. Ridley, and J. H. Kroll. 2018. Causes and consequences of decreasing atmospheric organic aerosol in the United States. Proc. Natl. Acad. Sci. U S A 115 (2):290–5. doi:10.1073/pnas.1700387115.
- Rohr, A., and J. McDonald. 2016. Health effects of carbon-containing particulate matter: Focus on sources and recent research program results. Crit. Rev. Toxicol. 46 (2):97–137. doi:10.3109/10408444.2015.1107024.
- Saarikoski, S., S. Carbone, M. J. Cubison, R. Hillamo, P. Keronen, C. Sioutas, D. R. Worsnop, and J. L. Jimenez. 2014. Evaluation of the performance of a particle concentrator for online instrumentation. Atmos. Meas. Tech. 7 (7):2121–35. doi:10.5194/amt-7-2121-2014.
- Salcedo, D., T. B. Onasch, A. C. Aiken, L. R. Williams, B. de Foy, M. J. Cubison, D. R. Worsnop, L. T. Molina, and J. L. Jimenez. 2010. Determination of particulate lead using aerosol mass spectrometry: MILAGRO/MCMA-2006 observations. Atmos. Chem. Phys. 10 (12):5371–89. doi:10.5194/acp-10-5371-2010.
- Shang, X., H. Kang, Y. Chen, M. Abdumutallip, L. Li, X. Li, H. Fu, X. Wang, L. Wang, X. Wang, et al. 2021a. PM1.0-nitrite heterogeneous formation demonstrated via a modified versatile aerosol concentration enrichment system coupled with ion chromatography. Environ. Sci. Technol. 55 (14):9794–804. doi:10.1021/acs.est.1c02373.
- Shang, X., L. Li, X. Zhang, H. Kang, G. Sui, G. Wang, X. Ye, H. Xiao, and J. Chen. 2021b. A semicontinuous study on the ecotoxicity of atmospheric particles using a versatile aerosol concentration enrichment system (VACES): Development and field characterization. Atmos. Meas. Tech. 14 (2):1037–45. doi:10.5194/amt-14-1037-2021.
- Shilling, J. E., R. A. Zaveri, J. D. Fast, L. Kleinman, M. L. Alexander, M. R. Canagaratna, E. Fortner, J. M. Hubbe, J. T. Jayne, A. Sedlacek, et al. 2013. Enhanced SOA formation from mixed anthropogenic and biogenic emissions during the CARES campaign. Atmos. Chem. Phys. 13 (4):2091–113. doi:10.5194/acp-13-2091-2013.
- Simkhovich, B. Z., M. T. Kleinman, and R. A. Kloner. 2008. Air pollution and cardiovascular injury epidemiology, toxicology, and mechanisms. J. Am. Coll. Cardiol. 52 (9):719–26. doi:10.1016/j.jacc.2008.05.029.
- Sintermann, J., and A. Neftel. 2015. Ideas and perspectives: On the emission of amines from terrestrial vegetation in the context of new atmospheric particle formation. Biogeosciences 12 (11):3225–40. doi:10.5194/bg-12-3225-2015.
- Sioutas, C., S. Kim, and M. Chang. 1999. Development and evaluation of a prototype ultrafine particle concentrator. J. Aerosol Sci. 30 (8):1001–17. doi:10.1016/S0021-8502(98)00769-1.
- Sioutas, C., P. Koutrakis, J. J. Godleski, S. T. Ferguson, C. S. Kim, and R. M. Burton. 1997. Fine particle concentrators for inhalation exposures—effect of particle size and composition. J. Aerosol Sci. 28 (6):1057–71. doi:10.1016/S0021-8502(96)00493-4.
- Soleimanian, E., S. Taghvaee, and C. Sioutas. 2020. Characterization of organic compounds and oxidative potential of aqueous PM2.5 suspensions collected via an aerosol-into-liquid collector for use in toxicology studies. Atmos. Environ. 241:117839. doi:10.1016/j.atmosenv.2020.117839.
- Steenhof, M., I. Gosens, M. Strak, K. J. Godri, G. Hoek, F. R. Cassee, I. S. Mudway, F. J. Kelly, R. M. Harrison, E. Lebret, et al. 2011. In vitro toxicity of particulate matter (PM) collected at different sites in the Netherlands is associated with PM composition, size fraction and oxidative potential - The RAPTES project. Part. Fibre Toxicol. 8:26. doi:10.1186/1743-8977-8-26.
- Stone, V., M. R. Miller, M. J. D. Clift, A. Elder, N. L. Mills, P. Møller, R. P. F. Schins, U. Vogel, W. G. Kreyling, K. A. Jensen, et al. 2017. Nanomaterials versus ambient ultrafine particles: An opportunity to exchange toxicology knowledge. Environ. Health Perspect. 125 (10):106002. doi:10.1289/EHP424.
- Su, Y., M. F. Sipin, M. T. Spencer, X. Qin, R. C. Moffet, L. G. Shields, K. A. Prather, P. Venkatachari, C.-H. Jeong, E. Kim, et al. 2006. Real-time characterization of the composition of individual particles emitted from ultrafine particle concentrators. Aerosol Sci. Technol. 40 (6):437–55. doi:10.1080/02786820600660887.
- Sun, J., Q. Zhang, M. R. Canagaratna, Y. Zhang, N. L. Ng, Y. Sun, J. T. Jayne, X. Zhang, X. Zhang, and D. R. Worsnop. 2010. Highly time- and size-resolved characterization of submicron aerosol particles in Beijing using an Aerodyne Aerosol Mass Spectrometer. Atmos. Environ. 44 (1):131–40. doi:10.1016/j.atmosenv.2009.03.020.
- Sun, Y., Q. Zhang, A. M. Macdonald, K. Hayden, S. M. Li, J. Liggio, P. S. K. Liu, K. G. Anlauf, W. R. Leaitch, A. Steffen, et al. 2009. Size-resolved aerosol chemistry on Whistler Mountain, Canada with a high-resolution aerosol mass spectrometer during INTEX-B. Atmos. Chem. Phys. 9 (9):3095–111. doi:10.5194/acp-9-3095-2009.
- Taghvaee, S., A. Mousavi, M. H. Sowlat, and C. Sioutas. 2019. Development of a novel aerosol generation system for conducting inhalation exposures to ambient particulate matter (PM). Sci. Total Environ. 665:1035–45. doi:10.1016/j.scitotenv.2019.02.214.
- Thompson, J. E. 2018. Airborne particulate matter: Human exposure and health effects. J. Occup. Environ. Med. 60 (5):392–423. doi:10.1097/jom.0000000000001277.
- Tolocka, M. P., M. Jang, J. M. Ginter, F. J. Cox, R. M. Kamens, and M. V. Johnston. 2004. Formation of oligomers in secondary organic aerosol. Environ. Sci. Technol. 38 (5):1428–34. doi:10.1021/es035030r.
- Tong, H., A. M. Arangio, P. S. J. Lakey, T. Berkemeier, F. Liu, C. J. Kampf, W. H. Brune, U. Pöschl, and M. Shiraiwa. 2016. Hydroxyl radicals from secondary organic aerosol decomposition in water. Atmos. Chem. Phys. 16 (3):1761–71. doi:10.5194/acp-16-1761-2016.
- Tong, H., P. S. J. Lakey, A. M. Arangio, J. Socorro, F. Shen, K. Lucas, W. H. Brune, U. Pöschl, and M. Shiraiwa. 2018. Reactive oxygen species formed by secondary organic aerosols in water and surrogate lung fluid. Environ. Sci. Technol. 52 (20):11642–51. doi:10.1021/acs.est.8b03695.
- U.S. EPA. 2019. Integrated science assessment for particulate matter, 1967. Center for Public Health and Environmental Assessment, Office of Research and Development, U.S. Environmental Protection Agency, Research Triangle Park, NC. December.
- Verma, V., P. Pakbin, K. L. Cheung, A. K. Cho, J. J. Schauer, M. M. Shafer, M. T. Kleinman, and C. Sioutas. 2011. Physicochemical and oxidative characteristics of semi-volatile components of quasi-ultrafine particles in an urban atmosphere. Atmos. Environ. 45 (4):1025–33. doi:10.1016/j.atmosenv.2010.10.044.
- Villeneuve, P. J., M. S. Goldberg, D. Krewski, R. T. Burnett, and Y. Chen. 2002. Fine particulate air pollution and all-cause mortality within the Harvard Six-Cities Study: Variations in risk by period of exposure. Ann. Epidem. 12 (8):568–76. doi:10.1016/S1047-2797(01)00292-7.
- Wei, J., T. Fang, C. Wong, P. S. J. Lakey, S. A. Nizkorodov, and M. Shiraiwa. 2020a. Superoxide formation from aqueous reactions of biogenic secondary organic aerosols. Environ. Sci. Technol. 55 (1):260–70. doi:10.1021/acs.est.0c07789.
- Wei, Z., Y. Li, R. G. Cooks, and X. Yan. 2020b. Accelerated reaction kinetics in microdroplets: Overview and recent developments. Annu. Rev. Phys. Chem. 71:31–51. doi:10.1146/annurev-physchem-121319-110654.
- Wlasits, P. J., D. Stolzenburg, C. Tauber, S. Brilke, S. H. Schmitt, P. M. Winkler, and D. Wimmer. 2020. Counting on chemistry: Laboratory evaluation of seed-material-dependent detection efficiencies of ultrafine condensation particle counters. Atmos. Meas. Tech. 13 (7):3787–98. doi:10.5194/amt-13-3787-2020.
- Yan, X., R. M. Bain, and R. G. Cooks. 2016. Organic reactions in microdroplets: Reaction acceleration revealed by mass spectrometry. Angew. Chem. Int. Ed. Engl. 55 (42):12960–72. doi:10.1002/anie.201602270.
- Yasmeen, F., N. Sauret, J. F. Gal, P. C. Maria, L. Massi, W. Maenhaut, and M. Claeys. 2010. Characterization of oligomers from methylglyoxal under dark conditions: A pathway to produce secondary organic aerosol through cloud processing during nighttime. Atmos. Chem. Phys. 10 (8):3803–12. doi:10.5194/acp-10-3803-2010.
- Yu, J., R. C. Flagan, and J. H. Seinfeld. 1998. Identification of products containing − cooh, −oh, and − co in atmospheric oxidation of hydrocarbons. Environ. Sci. Technol. 32 (16):2357–70. doi:10.1021/es980129x.
- Zhang, Q., M. R. Alfarra, D. R. Worsnop, J. D. Allan, H. Coe, M. R. Canagaratna, and J. L. Jimenez. 2005a. Deconvolution and quantification of hydrocarbon-like and oxygenated organic aerosols based on aerosol mass spectrometry. Environ. Sci. Technol. 39 (13):4938–52. doi:10.1021/es048568l.
- Zhang, Q., M. R. Canagaratna, J. T. Jayne, D. R. Worsnop, and J.-L. Jimenez. 2005b. Time- and size-resolved chemical composition of submicron particles in Pittsburgh: Implications for aerosol sources and processes. J. Geophys. Res.: Atmos. 110:D07S09. doi:10.1029/2004JD004649.
- Zhang, Q., J. L. Jimenez, M. R. Canagaratna, J. D. Allan, H. Coe, I. Ulbrich, M. R. Alfarra, A. Takami, A. M. Middlebrook, Y. L. Sun, et al. 2007. Ubiquity and dominance of oxygenated species in organic aerosols in anthropogenically-influenced northern hemisphere midlatitudes. Geophys. Res. Lett. 34 (13):L13801. doi:10.1029/2007GL029979.
- Zhang, Q., C. O. Stanier, M. R. Canagaratna, J. T. Jayne, D. R. Worsnop, S. N. Pandis, and J. L. Jimenez. 2004. Insights into the chemistry of new particle formation and growth events in Pittsburgh based on aerosol mass spectrometry. Environ. Sci. Technol. 38 (18):4797–809. doi:10.1021/es035417u.
- Zhao, Y., K. J. Bein, A. S. Wexler, C. Misra, P. M. Fine, and C. Sioutas. 2005. Field evaluation of the versatile aerosol concentration enrichment system (VACES) particle concentrator coupled to the rapid single-particle mass spectrometer (RSMS-3). J. Geophys. Res.: Atmos. 110:D07S02. doi:10.1029/2004JD004644.
- Zhao, Y., C. J. Hennigan, A. A. May, D. S. Tkacik, J. A. de Gouw, J. B. Gilman, W. C. Kuster, A. Borbon, and A. L. Robinson. 2014. Intermediate-volatility organic compounds: A large source of secondary organic aerosol. Environ. Sci. Technol. 48 (23):13743–50. doi:10.1021/es5035188.