
 ?Mathematical formulae have been encoded as MathML and are displayed in this HTML version using MathJax in order to improve their display. Uncheck the box to turn MathJax off. This feature requires Javascript. Click on a formula to zoom.
Abstract
Measurements of sub-3 nm particles are technically challenging and characterized with significant uncertainties. This study selected two types of widely used commercial instruments: an Airmodus® Particle Size Magnifier (PSM) and a TSI® diethylene glycol-based Scanning Mobility Particle Sizer (DEG–SMPS), and examined factors that govern their abilities on measurements of sub-3 nm particles. Monodisperse standard particles used in the experiments include positively and negatively charged tungsten oxide particles and nickel–chromium (Ni/Cr) oxide particles, positive and negative ions produced in a soft X-ray neutralizer, and positively charged organic particles including tetraheptylammonium bromide (THABr), tetrabutylammonium bromide (TBABr), and polyethylene glycol (PEG) particles. Our results show that both PSM and DEG–SMPS are subject to the influence of particle composition. Negatively charged tungsten oxide particles were detected at higher efficiencies than positively charged ones, whereas opposite results were observed for Ni/Cr particles and background ions produced in the soft X-ray neutralizer. In addition, the concentration accuracy of PSM and DEG–SMPS are explored after calibration using Ni/Cr particles. The inverted total concentrations by DEG–SMPS are usually underestimated because of the overestimation of penetration efficiency through different modules, whereas the inverted total concentrations by PSM can be either overestimated or underestimated, when the properties of analyte particles are significantly different from the calibration particles. A better understanding on the effects of particle chemical composition and charging state, and their diffusion losses in the instruments will help to diminish the uncertainties in the measurements.
Copyright © 2022 American Association for Aerosol Research.
EDITOR:
1. Introduction
Sub-3 nm is the critical size region in nucleation studies, in which vapor precursors undergo clustering and further grow into nanoparticles via vapor condensation and coagulation. Direct measurements of sub-3 nm particles are essential for a better understanding of a variety of nucleation processes, including atmospheric new particle formation, soot generation, nanomaterial synthesis, etc. (Spracklen et al. Citation2010; Kulmala et al. Citation2012; Wang et al. 2014; Maisser et al. Citation2015; Carbone, Attoui, and Gomez Citation2016; Yao et al. Citation2018; Kangasluoma and Attoui Citation2019; Kangasluoma et al. Citation2020; Lu et al. 2020; Kong et al. Citation2021; Qiao et al. Citation2022).
Due to fast and significant diffusion losses during particle transport and low activation efficiencies by conventional supersaturated working fluids, sub-3 nm particle measurements are technically challenging. Instruments for sub-3 nm particle measurements can be found in a recent review by Kangasluoma et al. (Citation2020). Because of its low vapor pressure and high surface tension, diethylene glycol (DEG) is able to activate microscopic particles and becomes a widely used working fluid for sub-3 nm particle measurements (Iida, Stolzenburg, and McMurry Citation2009). On the other hand, DEG-based instruments can be divided into two groups according to the technique used for particle sizing. One is to size particles according to the so-called Kelvin equivalent diameters, i.e., different sized particles are activated under different supersaturation levels of the working fluid. The other is to separate particles in an electric field according to their electrical mobilities. Airmodus® Particle Size Magnifier (PSM) and TSI® DEG-based Scanning Mobility Particle Sizer (DEG–SMPS) are representative instruments (Jiang et al. Citation2011; Vanhanen et al. Citation2011; Kong et al. Citation2021), respectively, for each category.
PSM is widely used as a sizer and a counter in the sub-3 nm range. Increasing the flow rate through the DEG saturator will enhance its supersaturation ratio and alter the cutoff size (i.e., the diameter corresponding to a detection efficiency of 50%) of detected nanoparticles (Kulmala et al. Citation2007). Supersaturated DEG vapors can grow nanoparticles to sizes up to ∼90 nm (Vanhanen et al. Citation2011), after which a butanol-based CPC is used to further grow the particles to an optically detectable size. Particle size distributions can only be obtained through proper data inversion. Effects of different inversion methods for PSM have been discussed in previous studies (Cai et al. Citation2018b; Chan et al. Citation2020). It should be noted that the supersaturation of DEG and the cutoff size do not collapse into a one-to-one corresponding relationship, and their relationship is influenced by particle properties and environmental conditions (Kangasluoma et al. Citation2013; Kangasluoma et al. Citation2016; Liu et al. Citation2021a,Citationb).
In DEG–SMPS, particles are brought to a charge equilibrium state in a neutralizer (Model 3088, TSI Inc., USA). The charged particles are then classified by a differential mobility analyzer (Model 3086, TSI Inc., USA), and lastly counted by a DEG–CPC (Model 3757-50, TSI Inc., USA) (Iida, Stolzenburg, and McMurry Citation2009). DEG–CPC is a two-stage CPC that contains a DEG booster and a butanol-based CPC. Unlike PSM, the DEG booster is operated under a constant DEG supersaturation. The penetration efficiency through each module of the DEG–SMPS, the charging efficiency in the neutralizer, and the size-resolved detection efficiency by the DEG–CPC are essential for the data inversion (Flagan Citation1990). In the current design of DEG–SMPS, the charging process accounts for a significant fraction of the measurement uncertainties (Tigges et al. Citation2015; Kangasluoma et al. Citation2020). The regression-based charge distribution calculated by Wiedensohler et al. (Citation1986) is used as default by most commercial neutralizers. Many steady-state charge distribution measurements in the diameter ranges of 5–100 nm (Kousaka, Okuyama, and Adachi Citation1984; Wiedensohler et al. Citation1986; Reischl et al. Citation1996; Liu et al. Citation2021a) do agree well with the Wiedensohler prediction. However, its accuracy for sub-3 nm particles remains to be elucidated (Hoppel and Frick Citation1986; Wiedensohler and Fissan Citation1988; Liu et al. Citation2020).
In general, activation of sub-3 nm particles is affected by factors including particle chemical composition, charging state, relative humidity, etc. (Kulmala et al. Citation2007; Jiang et al. Citation2011; Kangasluoma et al. Citation2013, Citation2016; Kangasluoma and Kontkanen Citation2017; Tauber et al. Citation2019; Wlasits et al. Citation2020). Kangasluoma et al. (Citation2014) characterized a PSM and several types of CPCs with laboratory particles of varied chemical composition and reported that salt particles including NaCl, NaNO3, (NH4)2SO4 showed similar detection efficiencies as metal particles (tungsten oxide particles). However, this study, together with a number of other studies, also show that hydrocarbon particles are detected with much lower efficiencies (Vanhanen et al. Citation2011; Kuang et al. Citation2012; Kangasluoma et al. Citation2014). The cutoff size for particles of different chemical compositions could differ as large as 2 nm (Kangasluoma et al. Citation2020). Besides, sub-3 nm particle activation is affected by the charging state. For PSM and CPCs using different working fluids, both positively and negatively charged particles were activated at higher efficiencies than the neutral ones (Kangasluoma et al. Citation2016). Liu et al. (Citation2021a) reported a higher detection efficiency for multiply charged particles than singly charged ones for a butanol-based CPC. In addition, changes in relative humidity could also change the cutoff size of the instruments, hinting that there exists an enhancement on DEG supersaturation due to the water–DEG interaction (Kangasluoma et al. Citation2013). Nevertheless, the significance of these factors has not been uncovered unambiguously (Iida, Stolzenburg, and McMurry Citation2009; Jiang et al. Citation2011; Hering et al. Citation2017). Further experimental studies are worthwhile to characterize and compare the performance of different instruments with particles of identical chemical composition.
PSM and DEG–SMPS have been used for different atmospheric or industrial applications, where both the particle properties and the environmental conditions vary a lot. Understanding of their performance for accurate measurements of sub-3 nm particles is essential and significant. But up till now, intercomparison between PSM and DEG–SMPS is sparse. To the best of our knowledge, only a few studies present PSM data together with butanol- or water-based SMPS measurements (Alanen et al. Citation2015; Rönkkö et al. Citation2017; Kangasluoma et al. Citation2020), in which PSM typically reported higher particle concentrations than SMPS did. Yet the disagreements could originate from uncertainties in particle charging, diffusion losses, or particle detection, which remain to be addressed (Kulmala et al. Citation2007; Jiang et al. Citation2011; Kangasluoma et al. Citation2016; Tauber et al. Citation2019).
In this study, we produced a series of monodisperse particles of known charging state and chemical composition in the lab, and investigated their effects on sub-3 nm particle measurements by PSM and DEG–SMPS.
2. Methods
Figure S1 displays the instrumental setup for this study, which is identical to that in a previous study (Liu et al. Citation2021b). We used a wire generator to heat a tungsten or Ni/Cr wire (purity above 99.99%) and generate metal oxide particles, some of which were self-charged. An electrospray source was used to generate charged THABr, TBABr, and PEG particles. A radioactive neutralizer (Kr-85, Model 3077A, TSI Inc., USA) was placed downstream to diminish the multiple charges on particles. The mobility spectra of produced particles can be found in previous studies (Liu et al. Citation2021a; Kangasluoma et al. Citation2013). In addition, bipolar ions produced by a soft X-ray neutralizer (Model 3087, TSI Inc., USA) were used as tested particles, too. Note that the ions generated by the X-ray neutralizer are affected by the impurities in the carrier gas (Kallinger, Steiner, and Szymanski Citation2012; Steiner and Reischl Citation2012). Hence, ion properties could vary significantly when using different devices or carrier gases (Liu et al. Citation2020).
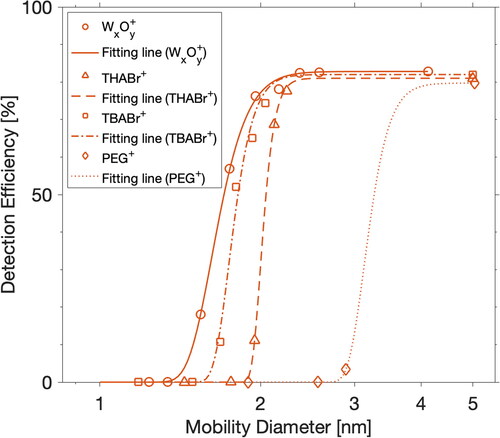
Figure 1. Detection efficiencies for different types of positively charged particles by PSM (at a DEG saturator flow rate of 1.3 L min−1) operated under a moderate temperature setting (saturator at 80 °C, inlet 35 at °C, and growth tube at 7 °C). The fitting lines are used to guide the eye.
A high-resolution DMA (half-mini DMA, SEADM Inc., Spain) was used to classify ions/particles according to their electrical mobilities (Liu et al. Citation2021b; Cai et al. Citation2018a). The electrical mobilities and the equivalent diameters for nanoparticles produced through an electrospray source are listed in Table S1. The mobility equivalent diameter is calculated from electrical mobility using the Stokes–Cunningham relationship (see the online supplementary information) (Ude and Fernández de la Mora Citation2005). All the diameters mentioned in this study are electrical mobility equivalent diameters. Classified monodisperse ions/particles for instrument measurements included positively and negatively self-charged metal oxide particles in the size range of 0.9–4.0 nm, with concentrations of 1500–6000 cm−3. Positively charged Ni/Cr particles were also used to calibrate PSM and DEG–CPC (Figure S2), with a method provided in previous studies (Kangasluoma et al. Citation2013, Citation2015; Liu et al. Citation2021b). Other monodisperse particles used in this study included positively charged THABr particles ((THABr)nTHA+, n = 0, 1, 2, 4) of 1.4, 1.8, 2.0, and 2.2 nm, positively charged TBABr particles ((TBABr)nTBA+, n = 0, 1, 2, 3, 4, 5) of 1.2, 1.5, 1.7, 1.8, 1.9, and 2.0 nm, and positively charged PEG particles of 1.9, 2.6, 2.9, and 5.1 nm, corresponding to average molecular weights (MW) of 1500, 4000, 6000, and 40,000 Da, respectively.
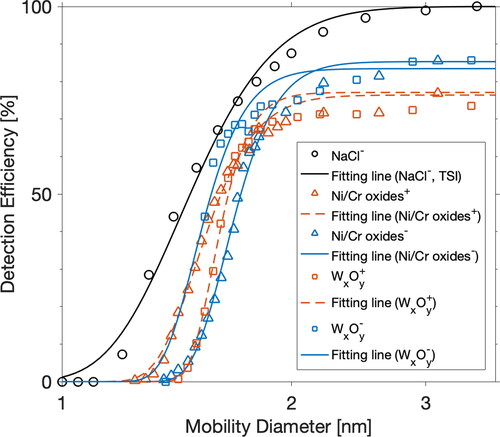
Figure 2. Detection efficiencies for different types of metal particles by DEG–CPC operated under the default temperature setting (DEG saturator at 62 °C and condenser at 12 °C). The calibration results were further compared with the curve provided by the instrument manufacturer. The fitting lines are used to guide the eye.
Downstream of the DMA, the sample flow was split to a PSM, a DEG–SMPS, and an aerosol electrometer, and the rest was vented. The inlet flow rates for both the PSM and the aerosol electrometer were 2.5 L min−1. The PSM was operated in the scanning mode, with the saturator flow rate being automatically and continuously regulated between 0.1 and 1.3 L min−1. Two temperature settings were used. A moderate temperature setting included saturator at 80 °C, inlet at 35 °C, and growth tube at 7 °C, respectively. A boosted temperature setting included saturator at 81 °C, inlet at 35 °C, and growth tube at 4 °C, respectively. The moderate temperature setting corresponded to an extremely low background concentration (<0.01 cm−3), granted under high relative humidity (RH = 90%). The boosted temperature setting corresponded to the brink of DEG homogeneous nucleation (1–2 cm−3 under RH = 0%) (Liu et al. Citation2021a). When the PSM is operated under the moderate temperature setting, it can act as the detector of SMPS. On the other hand, the boosted temperature setting is used only when the PSM directly samples the atmospheric aerosol particles. The particle size distributions are calculated using the step inversion method (Lehtipalo et al. Citation2014).
In order to reduce particle diffusion losses, the DEG–SMPS was operated at a relatively high inlet flow rate of 4.5 L min−1, from which 2.0 L min−1 bypass flow was extracted, and the rest 2.5 L min−1 was directed into a 1-nm DMA. The sheath flow rate of the 1-nm DMA was 25.0 L min−1. The DMA can be operated under either positive or negative voltage mode, with voltage scanning from low to high values. Note that the soft X-ray neutralizer was powered off during all the experiments. Hence the charging probability of particles was not investigated in this study. DEG–CPC was operated under a default temperature setting: DEG saturator at 62 °C and condenser at 12 °C. The raw particle counts accumulated in each size bin are used to calculate the particle number concentration. The penetration efficiencies through each module of the DEG–SMPS, including the neutralizer, DMA, and sampling tube, and the size-resolved detection efficiency by DEG–CPC are provided by the instrument manufacturer (Stolzenburg and McMurry Citation2008; Jiang et al. Citation2011). The total penetration through the DEG–SMPS is the product of the individual penetration values of each module (Figure S3). The concentrations of charged particles measured by the aerosol electrometer were used as the concentration reference.
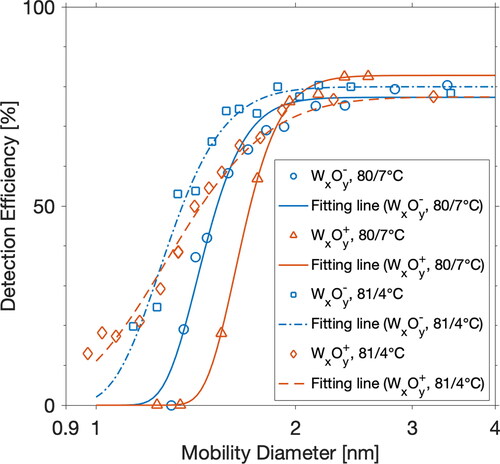
Figure 3. Detection efficiencies for positively and negatively charged tungsten oxide particles as a function of particle mobility diameter. The PSM (with a DEG saturator flow rate of 1.3 L min−1) was operated under moderate (saturator at 80 °C, inlet at 35 °C, and growth tube at 7 °C) or boosted (saturator at 81 °C, inlet at 35 °C, and growth tube at 4 °C) temperature settings. Fitting lines are used to guide the eye.
Experiments that were performed can be grouped into two categories. In the first set of experiments, effects of particle chemical composition on measurements of sub-3 nm particles were investigated. Bipolar tungsten oxide particles and bipolar neutralizer ions were used to investigate the sign preference on particle activation. The particle detection efficiency (DE) is defined by the ratio of the concentrations (C) measured by the detector (DEG–CPC or PSM under fixed DEG saturator flow rate) and the AEM:
(1)
(1)
(2)
(2)
In the second set of experiments, total particle concentrations measured by PSM/DEG–SMPS were compared with AEM. The sizing and concentration accuracy of PSM and DEG–SMPS are evaluated. The concentration ratio (CR) is the ratio of the inverted total concentrations (ITC) by the instrument (DEG–SMPS or scan mode PSM) and the AEM,
(3)
(3)
(4)
(4)
3. Results and discussion
3.1. Effects of particle chemical composition on detection efficiency
displays the detection efficiencies for different particles by PSM. Similarly to a previous study (Kulmala et al. Citation2007), our results show the particle activation was strongly dependent on its chemical composition, as evidenced by the fact that positively charged tungsten oxide particles were detected at higher efficiencies than positively charged TBABr, THABr, and PEG particles. The cutoff sizes for tungsten oxide, TBABr, THABr, and PEG particles were 1.66, 1.76, 2.03, and 3.02 nm, respectively. The sizing accuracy of PSM is composition-dependent. Furthermore, it will affect concentration accuracy through data inversion because size-resolved detection efficiency for sub-3 nm particles changes significantly over the size range.
DEG–SMPS uses DEG–CPC as the detector, whose performance is also affected by the particle chemical composition. presents the detection efficiency curves for different metal particles by DEG–CPC. The result for NaCl particles is also displayed, which is provided by the instrument manufacturer. All the metal particles showed lower detection efficiencies than NaCl particles. The plateau of detection efficiencies for NaCl particles reached 100% at 3 nm, while a value of 75–85% is evidence for metal particles. It suggests that the particle detection efficiency by DEG–CPC is strongly composition dependent. In practice, both PSM and DEG–SMPS are normally calibrated using one species of standard particles, neglecting particle composition effects. Specifically, positively charged nickel–chromium oxide particles are used to calibrate PSM by Airmodus (Vanhanen et al. Citation2011), whereas negatively charged NaCl particles are used to adjust DEG–CPC by TSI. DEG vapors activate salt or metal particles at higher efficiencies than organic particles. As a result, if other factors, such as relative humidity and charging state, are identical, the pre-set detection efficiencies used for DEG–SMPS data inversion are probably their upper values.
Nanoparticle–vapor interaction is vital to interpreting the effects of particle chemical composition on their activation. It is assumed that at the very beginning of particle activation, nanoparticles of different compositions attach a different number of molecules through nanoparticle–vapor interaction, and this process is both particle size and composition-dependent. Winkler et al. (Citation2008) concluded that the contact angle between a particle’s surface and the condensing vapor could be used to describe the effects of the nanoparticle–vapor interaction. A smaller contact angle means particles tend to combine more vapor molecules through hydrogen bonding, chemical bonding, or dipole interaction. As a result, TBABr particles are activated at higher efficiencies than THABr since TBABr shows a higher affinity with DEG vapors. In addition, metal oxide particles show a high affinity with DEG vapors on a nano-scale and thus are activated at high efficiency.
3.2. Effects of charging sign on particle activation
displays the detection efficiencies for positively and negatively charged tungsten oxide particles when PSM was operated under the highest DEG supersaturation. For tungsten oxide particles larger than 2 nm, the detection efficiencies reached a plateau and were less influenced by the charging state. In the size range of sub-2 nm, negatively charged tungsten oxide particles were generally activated at higher efficiencies than the positively charged ones. As a result, when using positively or negatively charged tungsten oxide particles for PSM calibration, obtained calibration curve will differ, which will potentially affect the measured particle size distribution through data inversion.
A similar tendency appears for DEG–CPC, i.e., Negatively charged tungsten oxide particles were activated at higher detection efficiencies than positively charged ones (). However, opposite sign preference appears for Ni/Cr particles, possibly due to different impurities attached at the particle surface. Tungsten wire is heated at high power to get sufficient particle concentrations. In comparison, Ni/Cr wire is heated at a lower temperature to prevent melting. Different heating power would change the chemical identity of impurities or their amounts that are attached to the particle surface (Kangasluoma et al. Citation2016). When the DEG–CPC measures particles that contain organic components, the measured concentrations could be underestimated.
Under the boosted temperature setting of PSM (saturator at 81 °C, inlet at 35 °C, and growth tube at 4 °C), the discrepancy in the detection efficiencies between positively and negatively charged particles decreased when particle sizes decreased, and comparable efficiencies were observed for bipolar particles at ∼1 nm. The exact reason for this observation is not clear for the lack of the exact particle composition, as explained in the “Methods” section. The effects of charging state and chemical composition of particles cannot be well separated in this case, unless a direct mass spectrometric measurement of the ions is available (Kangasluoma et al. Citation2016). Hence, it is hard to judge whether the difference between the detection efficiencies of bipolar particles originated from the polarity, or the particle compositions, or both.
Under the boosted temperature setting, PSM was able to detect sub-nanometer particles. Our data show that with a decreasing particle size, particle activation is less dependent on particle size, as evidenced by that positively charged tungsten particles sized 0.97, 1.02, 1.07, and 1.16 nm are detected at comparable efficiencies (). This result contrasts with the prediction of the Kelvin effect that when particle size decreases, the supersaturation needed for particle activation would increase significantly. It suggests that the Kelvin effect alone is insufficient to explain the observed results in the nano-size range. Nanoparticle–vapor interaction could also play an important role in particle activation. The results observed in this study are consistent with previous studies that electrically charged particles can be activated regardless of particle sizes when the saturation ratio of condensing vapor is above a critical limit, given that the particle surface is perfectly wetted with the vapor (Seto et al. Citation1997; de la Mora Citation2011). As a result, the uncertainties for PSM in measuring particle size and concentration will be more significant for particles close to 1 nm.
Similar electrical mobility spectra for bipolar ions produced from an X-ray source were observed, as shown in Figure S4. Dominant mobility peaks corresponding to the positive and negative ions were characterized with comparable mobility diameters of ∼1.2 nm (Liu et al. Citation2020), whose detection efficiencies are also measured. Neither polar ions can be activated by DEG–SMPS or PSM when operated under a moderate temperature setting. When PSM was operated under a boosted temperature setting, positive ions were activated at an efficiency of 2.5%, whereas negative ions were still hardly detected. The sign preference obtained in this experiment is contrary to the result shown in that negative tungsten oxide particles were activated at higher detection efficiencies than the positive ones. It suggests that particle activation does not show a specific sign preference. Instead, particle chemical composition is a more significant factor that determines their detection efficiency (Kangasluoma et al. Citation2013).
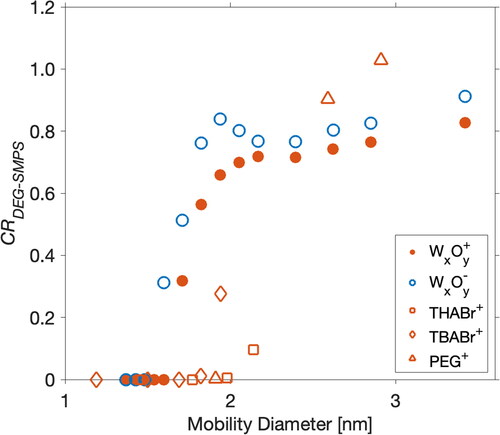
Figure 4. The ratios of the inverted total particle concentrations (CR) between DEG–SMPS and AEM. The DEG–CPC was calibrated using positively charged Ni/Cr particles. The routine inversion method by the manufacturer was used for data inversion.
Even though both PSM and DEG–SMPS use DEG as the working fluid, the minimum detectable sizes of these two instruments are distinct, whose prime reason is the different temperature settings. DEG–CPC uses a relatively moderate temperature setting to eliminate the interference of the background ions (neutralizer ions), which weakens the detection limit of DEG–CPC. Hence, commercialized DEG–SMPS is only able to measure tungsten oxide particles larger than 1.4 nm. In contrast, PSM is able to detect 1 nm particles when operated under a boosted temperature setting. Thus, an enlarged temperature difference between the saturator and condenser temperature is suggested for DEG–SMPS. Meanwhile, to get a lower size detection limit, a better choice is to operate DEG–SMPS under the negative ion mode (i.e., positive DMA voltage) since the counts of negative background ions under the boosted temperature setting would cause a concentration overestimation or even errors through data inversion.
3.3. The accuracy of the inverted particle number concentration
In the few available studies that present PSM and SMPS intercomparison, PSM typically reported higher concentrations (Alanen et al. Citation2015; Rönkkö et al. Citation2017; Kangasluoma et al. Citation2020). Since PSM and SMPS are typically calibrated with different particles, the observed discrepancy in the total particle concentration could originate from instrument calibration. This study calibrated PSM and DEG–CPC with the same particles, i.e., positively charged Ni/Cr particles, and then applied the two instruments for measuring particles classified by a half-mini DMA. The inverted total particle concentrations are further compared with those measured by AEM.
displays the measured total particle concentration ratio of DEG–SMPS to AEM. The concentration accuracy of DEG–SMPS is both particle chemical composition-dependent and size-dependent. This study, together with many previous studies (Jiang et al. Citation2011; Kangasluoma et al. Citation2015), shows that the chemical composition difference between the sample particles and calibration particles would affect their measured concentration. Organic particles are characterized with a lower detection efficiency in DEG–CPC. Hence, the concentrations of organic particles are significantly underestimated. The negative tungsten particles have higher detection efficiencies than the positive ones, making the inverted total concentration of negative tungsten particles larger than the positive. In addition, when metal particle size decreases, the concentration discrepancy between DEG–SMPS and AEM enlarged, i.e., the concentrations measured by DEG–SMPS are further underestimated. Because the DEG–CPC has been calibrated using positive Ni/Cr particles, the underestimation in the sample particle concentrations probably originates from the errors in penetration. For the routine inversion method provided by the manufacturer and used in this study, each module of DEG–SMPS is characterized by its equivalent length. This equivalent length is then substituted into Gormley and Kennedy’s equations to calculate the penetration. Any deviations from the laminar flow profile, i.e., bends of the tube, connections between modules, etc., cause local distortions to the flow and add additional diffusion losses. As a result, the inverted concentrations are underestimated in this study. The underestimation for particles larger than 2 nm is within 30%, whereas with a further decreasing size, the underestimation enlarged significantly. Besides, because of the finite resolution of 1-nm DMA and the diffusion effect of nanoparticles (Stolzenburg and McMurry Citation2008), the monodisperse particles classified by the half-mini DMA were distributed into different size bins by DEG–SMPS, which would bring additional uncertainties to the inverted size distribution.
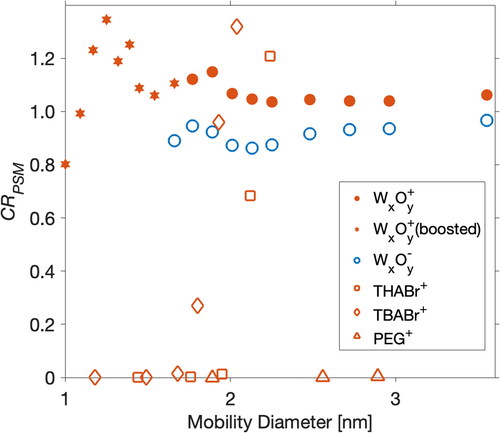
Due to variation in chemical composition between the calibration and sample particles, PSM is inferior to SMPS in terms of sizing. The systematic error in sizing leads to the error in the inverted particle number concentration. As shown in , small THABr, TBABr, and PEG particles cannot be activated even under the highest DEG saturation flowrate. Their concentrations would be measured to be 0 cm−3. On the other hand, 2.0 nm TBABr particles and 2.2 nm THABr particles are activated at a higher supersaturation than metal particles of the same size. Though their sizes are underestimated (), the corresponding concentrations are overestimated through data inversion since the smaller-sized particles correspond to lower detection efficiencies in the data inversion. Similar conditions are found for tungsten particles. For bipolar tungsten particles of the same size, positive tungsten particles need a higher supersaturation of DEG to be activated. Thereby, while their size is underestimated, the concentrations of bipolar tungsten particles are overestimated. This study urges a better understanding of nanoparticle–vapor interaction at nano-scale which would help to diminish the measurement uncertainties caused by particle composition.
Figure 5. The ratios of the inverted total particle concentrations (CR) between PSM and AEM. Hexagram represents the data when PSM was operated under a boosted temperature setting. Other data points were measured when PSM was operated under a moderate temperature setting. The particle sizes displayed on the x axis are the values measured by half-mini DMA.
4. Conclusion
PSM and DEG–SMPS are popular choices for sub-3 nm particle measurements, whose performances are influenced by particle chemical composition and charging state. Metal particles were generally activated at higher efficiencies than organic particles. Our results also attribute the different detection efficiencies of positively and negatively charged particles to the chemical composition of the attached impurity, instead of their polarity. The effects of particle composition on particle activation become even more significant with a decreasing particle size. The minimum detectable particle sizes of the two instruments are compared using metal oxide particles. DEG–SMPS has a high detection limit at ∼1.4 nm, while PSM has a lower detection limit to sub-1 nm particles under boosted temperature settings. The positive tungsten oxide particles in the size range of sub-1.2 nm were activated at comparable detection efficiencies by PSM, hinting that the effect of particle composition overweighs that of particle size (Gamero-Castaño and de la Mora Citation2000). In general, DEG–SMPS shows good sizing accuracy, but the inverted concentration is typically underestimated because of the overestimation of penetration efficiency through different modules. For PSM, both the sizing accuracy and the concentration accuracy are dependent on particle properties.
In summary, this study gives new insights into the source of uncertainties in measurements of sub-3 nm particles by PSM and DEG–SMPS, which helps to understand the inconsistence in the measurement results from the two instruments.
Supplemental Material
Download MS Word (504 KB)Acknowledgments
This work was financially supported by the National Natural Science Foundation of China (21925601, 92044301, and 22127811). M. A. thanks the support from Fudan University as a visiting professor.
Additional information
Funding
Related Research Data
References
- Alanen, J., E. Saukko, K. Lehtoranta, T. Murtonen, H. Timonen, R. Hillamo, P. Karjalainen, H. Kuuluvainen, J. Harra, J. Keskinen, et al. 2015. The formation and physical properties of the particle emissions from a natural gas engine. Fuel 162:155–61. doi:10.1016/j.fuel.2015.09.003.
- Cai, R., M. Attoui, J. Jiang, F. Korhonen, J. Hao, T. Petäjä, and J. Kangasluoma. 2018a. Characterization of a high-resolution supercritical differential mobility analyzer at reduced flow rates. Aerosol Sci. Technol. 52 (11):1332–43. doi:10.1080/02786826.2018.1520964.
- Cai, R., D. Yang, L. R. Ahonen, L. Shi, F. Korhonen, Y. Ma, J. Hao, T. Petäjä, J. Zheng, J. Kangasluoma, et al. 2018b. Data inversion methods to determine sub-3& nm aerosol size distributions using the particle size magnifier. Atmos. Meas. Tech. 11 (7):4477–91. doi:10.5194/amt-11-4477-2018.
- Carbone, F., M. Attoui, and A. Gomez. 2016. Challenges of measuring nascent soot in flames as evidenced by high-resolution differential mobility analysis. Aerosol Sci. Technol. 50 (7):740–57. doi:10.1080/02786826.2016.1179715.
- Chan, T., R. Cai, L. R. Ahonen, Y. Liu, Y. Zhou, J. Vanhanen, L. Dada, Y. Chao, Y. Liu, L. Wang, et al. 2020. Assessment of particle size magnifier inversion methods to obtain the particle size distribution from atmospheric measurements. Atmos. Meas. Technol. 13 (9):4885–98. doi:10.5194/amt-13-4885-2020.
- de la Mora, J. F. 2011. Heterogeneous nucleation with finite activation energy and perfect wetting: Capillary theory versus experiments with nanometer particles, and extrapolations on the smallest detectable nucleus. Aerosol. Sci. Technol. 45 (4):543–54. doi:10.1080/02786826.2010.550341.
- Flagan, R. C. 1990. Scanning electrical mobility spectrometer. Aerosol Sci. Technol. 13 (8):230.
- Gamero-Castaño, M., and J. F. de la Mora. 2000. A condensation nucleus counter (CNC) sensitive to singly charged sub-nanometer particles. J. Aerosol. Sci. 31 (7):757–72. doi:10.1016/S0021-8502(99)00555-8.
- Hering, S. V., G. S. Lewis, S. R. Spielman, A. Eiguren-Fernandez, N. M. Kreisberg, C. Kuang, and M. Attoui. 2017. Detection near 1-nm with a laminar-flow, water-based condensation particle counter. Aerosol Sci. Technol. 51 (3):354–62. doi:10.1080/02786826.2016.1262531.
- Hoppel, W. A., and G. M. Frick. 1986. Ion–aerosol attachment coefficients and the steady-state charge distribution on aerosols in a bipolar ion environment. Aerosol. Sci. Technol. 5 (1):1–21. doi:10.1080/02786828608959073.
- Iida, K., M. R. Stolzenburg, and P. H. McMurry. 2009. Effect of working fluid on sub-2 nm particle detection with a laminar flow ultrafine condensation particle counter. Aerosol Sci. Technol. 43 (1):81–96. doi:10.1080/02786820802488194.
- Jiang, J., M. Chen, C. Kuang, M. Attoui, and P. H. McMurry. 2011. Electrical mobility spectrometer using a diethylene glycol condensation particle counter for measurement of aerosol size distributions down to 1 nm. Aerosol Sci. Technol. 45 (4):510–21. doi:10.1080/02786826.2010.547538.
- Kallinger, P., G. Steiner, and W. W. Szymanski. 2012. Characterization of four different bipolar charging devices for nanoparticle charge conditioning. J. Nanoparticle Res. 14 (6):1–8.
- Kangasluoma, J., and M. Attoui. 2019. Review of sub-3 nm condensation particle counters, calibrations, and cluster generation methods. Aerosol Sci. Technol. 53 (11):1–45. doi:10.1080/02786826.2019.1654084.
- Kangasluoma, J., M. Attoui, H. Junninen, K. Lehtipalo, A. Samodurov, F. Korhonen, N. Sarnela, A. Schmidt-Ott, D. Worsnop, M. Kulmala, et al. 2015. Sizing of neutral sub 3nm tungsten oxide clusters using Airmodus particle size magnifier. J. Aerosol Sci. 87:53–62. doi:10.1016/j.jaerosci.2015.05.007.
- Kangasluoma, J., R. Cai, J. Jiang, C. Deng, D. Stolzenburg, L. R. Ahonen, T. Chan, Y. Fu, C. Kim, T. M. Laurila, et al. 2020. Overview of measurements and current instrumentation for 1–10 nm aerosol particle number size distributions. J. Aerosol. Sci. 148:1–29.
- Kangasluoma, J., H. Junninen, K. Lehtipalo, J. Mikkilä, J. Vanhanen, M. Attoui, M. Sipilä, D. Worsnop, M. Kulmala, and T. Petäjä. 2013. Remarks on ion generation for CPC detection efficiency studies in sub-3 nm size range. Aerosol Sci. Technol. 47 (5):556–63. doi:10.1080/02786826.2013.773393.
- Kangasluoma, J., and J. Kontkanen. 2017. On the sources of uncertainty in the sub-3nm particle concentration measurement. J. Aerosol Sci. 112:34–51. doi:10.1016/j.jaerosci.2017.07.002.
- Kangasluoma, J., C. Kuang, D. Wimmer, M. P. Rissanen, K. Lehtipalo, M. Ehn, D. R. Worsnop, J. Wang, M. Kulmala, and T. Petäjä. 2014. Sub-3 nm particle size and composition dependent response of a nano-CPC battery. Atmos. Meas. Tech. 7 (3):689–700. doi:10.5194/amt-7-689-2014.
- Kangasluoma, J., A. Samodurov, M. Attoui, A. Franchin, H. Junninen, F. Korhonen, T. Kurtén, H. Vehkamäki, M. Sipilä, K. Lehtipalo, et al. 2016. Heterogeneous nucleation onto ions and neutralized ions: insights into sign-preference. J. Phys. Chem. C 120 (13):7444–50. doi:10.1021/acs.jpcc.6b01779.
- Kong, W., S. Amanatidis, H. Mai, C. Kim, B. C. Schulze, Y. Huang, G. S. Lewis, S. V. Hering, J. H. Seinfeld, and R. C. Flagan. 2021. The nano-scanning electrical mobility spectrometer (nSEMS) and its application to size distribution measurements of 1.5–25 nm particles. Atmos. Meas. Tech. Discuss. 2021:1–26.
- Kousaka, Y., K. Okuyama, and M. Adachi. 1984. Bipolar and unipolar diffusion charging of ultrafine aerosol particles. J. Aerosol Sci. 15 (3):261–2. doi:10.1016/0021-8502(84)90084-3.
- Kuang, C., M. Chen, P. H. McMurry, and J. Wang. 2012. Modification of laminar flow ultrafine condensation particle counters for the enhanced detection of 1 nm condensation nuclei. Aerosol Sci. Technol. 46 (3):309–15. doi:10.1080/02786826.2011.626815.
- Kulmala, M., G. Mordas, T. Petäjä, T. Grönholm, P. P. Aalto, H. Vehkamäki, A. I. Hienola, E. Herrmann, M. Sipilä, I. Riipinen, et al. 2007. The condensation particle counter battery (CPCB): A new tool to investigate the activation properties of nanoparticles. J. Aerosol Sci. 38 (3):289–304. doi:10.1016/j.jaerosci.2006.11.008.
- Kulmala, M., T. Petäjä, T. Nieminen, M. Sipilä, H. E. Manninen, K. Lehtipalo, M. Dal Maso, P. P. Aalto, H. Junninen, P. Paasonen, et al. 2012. Measurement of the nucleation of atmospheric aerosol particles. Nat. Protoc. 7 (9):1651–67. doi:10.1038/nprot.2012.091.
- Lehtipalo, K., J. Kontkanen, J. Kangasluoma, A. Franchin, D. Wimmer, S. Schobesberger, H. Junninen, T. Petäjä, M. Sipilä, D. R. Worsnop, et al. 2014. Methods for determining particle size distribution and growth rates between 1 and 3 nm using the particle size magnifier. Boreal Environ. Res. 19 (September):215–36.
- Liu, Y., M. Attoui, J. Chen, Q. Li, and L. Wang. 2021a. Performance comparison of SMPSs with soft X-ray and Kr-85 neutralizers in a humid atmosphere. J. Aerosol Sci. 154:105756. doi:10.1016/j.jaerosci.2021.105756.
- Liu, Y., M. Attoui, Y. Li, J. Chen, Q. Li, and L. Wang. 2021b. Characterization of a Kanomax® fast condensation particle counter in the sub-10 nm range. J. Aerosol Sci. 155:105772. doi:10.1016/j.jaerosci.2021.105772.
- Liu, Y., M. Attoui, K. Yang, J. Chen, Q. Li, and L. Wang. 2020. Size-resolved chemical composition analysis of ions produced by a commercial soft X-ray aerosol neutralizer. J. Aerosol Sci 147 (105586):105586. doi:10.1016/j.jaerosci.2020.105586.
- Lu, Y., L. Liu, A. Ning, G. Yang, Y. Liu, T. Kurtén, H. Vehkamäki, X. Zhang, and L. Wang. 2020. Atmospheric sulfuric acid-dimethylamine nucleation enhanced by trifluoroacetic acid. Geophys. Res. Lett. 47 (2):e2019GL085627. doi:10.1029/2019GL085627.
- Maisser, A., K. Barmpounis, M. B. Attoui, G. Biskos, and A. Schmidt-Ott. 2015. Atomic cluster generation with an atmospheric pressure spark discharge generator. Aerosol. Sci. Technol. 49 (10):886–94. doi:10.1080/02786826.2015.1080812.
- Qiao, Y., L. Li, J. Chen, S. Yang, and C. J. Hogan. 2022. Mobility analysis of nanocluster formation and growth from titanium tetraisopropoxide in a flow tube reactor. J. Aerosol Sci. 163 (105981):105981. doi:10.1016/j.jaerosci.2022.105981.
- Reischl, G. P., J. M. Mäkelä, R. Karch, and J. Necid. 1996. Bipolar charging of ultrafine particles in the size range below 10 nm. J. Aerosol Sci. 27 (6):931–49. doi:10.1016/0021-8502(96)00026-2.
- Rönkkö, T., H. Kuuluvainen, P. Karjalainen, J. Keskinen, R. Hillamo, J. V. Niemi, L. Pirjola, H. J. Timonen, S. Saarikoski, E. Saukko, et al. 2017. Traffic is a major source of atmospheric nanocluster aerosol. Proc. Natl. Acad. Sci. USA 114 (29):7549–54.
- Seto, T., Okuyama, K. Juan, L. F, and de la Mora, J. 1997. Condensation of supersaturated vapors on monovalent and divalent ions of varying size. J. Chem. Phys. 107 (5):1576–85. doi:10.1063/1.474510.
- Spracklen, D. V., K. S. Carslaw, J. Merikanto, G. W. Mann, C. L. Reddington, S. Pickering, J. A. Ogren, E. Andrews, U. Baltensperger, E. Weingartner, et al. 2010. Explaining global surface aerosol number concentrations in terms of primary emissions and particle formation. Atmos. Chem. Phys. 10 (10):4775–93. doi:10.5194/acp-10-4775-2010.
- Steiner, G., and G. P. Reischl. 2012. The effect of carrier gas contaminants on the charging probability of aerosols under bipolar charging conditions. J. Aerosol Sci. 54 (7):21–31.
- Stolzenburg, M. R., and P. H. McMurry. 2008. Equations governing single and tandem DMA configurations and a new lognormal approximation to the transfer function. Aerosol Sci. Technol. 42 (6):421–32. doi:10.1080/02786820802157823.
- Tauber, C., S. Brilke, P. J. Wlasits, P. S. Bauer, G. Köberl, G. Steiner, and P. M. Winkler. 2019. Humidity effects on the detection of soluble and insoluble nanoparticles in butanol operated condensation particle counters. Atmos. Meas. Tech. 12 (7):3659–71. doi:10.5194/amt-12-3659-2019.
- Tigges, L., A. Wiedensohler, K. Weinhold, J. Gandhi, and H. J. Schmid. 2015. Bipolar charge distribution of a soft X-ray diffusion charger. J. Aerosol Sci. 90:77–86. doi:10.1016/j.jaerosci.2015.07.002.
- TSI. 2015. https://www.tsi.com/getmedia/d0b7d247-37bc-4584-93be-d3a0b2a7141a/1nm-SMPS-3938E57_US_5002241_RevA_WEB?ext=.pdf.
- Ude, S., and J. Fernández de la Mora. 2005. Molecular monodisperse mobility and mass standards from electrosprays of tetra-alkyl ammonium halides. J. Aerosol Sci. 36 (10):1224–37. doi:10.1016/j.jaerosci.2005.02.009.
- Vanhanen, J., J. Mikkilä, K. Lehtipalo, M. Sipilä, H. E. Manninen, E. Siivola, T. Petäjä, and M. Kulmala. 2011. Particle size magnifier for nano-CN detection. Aerosol Sci. Technol. 45 (4):533–42. doi:10.1080/02786826.2010.547889.
- Wang, Y., P. Liu, J. Fang, W.-N. Wang, and P. Biswas. 2015. Kinetics of sub-2 nm TiO2 particle formation in an aerosol reactor during thermal decomposition of titanium tetraisopropoxide. J. Nanoparticle Res. 17 (3):147.
- Wiedensohler, A., and H. J. Fissan. 1988. Aerosol charging in high purity gases. J. Aerosol. Sci. 19 (7):867–70. doi:10.1016/0021-8502(88)90054-7.
- Wiedensohler, A., E. Lütkemeier, M. Feldpausch, and C. Helsper. 1986. Investigation of the bipolar charge distribution at various gas conditions. J. Aerosol. Sci. 17 (3):413–6. doi:10.1016/0021-8502(86)90118-7.
- Winkler, P. M., G. Steiner, A. Vrtala, H. Vehkamäki, M. Noppel, K. E. J. Lehtinen, G. P. Reischl, P. E. Wagner, and M. Kulmala. 2008. Heterogeneous nucleation experiments bridging the scale from molecular ion clusters to nanoparticles. Science 319 (5868):1374–7. doi:10.1126/science.1149034.
- Wlasits, P. J., D. Stolzenburg, C. Tauber, S. Brilke, S. H. Schmitt, P. M. Winkler, and D. Wimmer. 2020. Counting on chemistry: Laboratory evaluation of seed-material-dependent detection efficiencies of ultrafine condensation particle counters. Atmos. Meas. Tech. 13 (7):3787–98. doi:10.5194/amt-13-3787-2020.
- Yao, L., O. Garmash, F. Bianchi, J. Zheng, C. Yan, J. Kontkanen, H. Junninen, S. B. Mazon, M. Ehn, P. Paasonen, et al. 2018. Atmospheric new particle formation from sulfuric acid and amines in a Chinese megacity. Science 361 (6399):278–81. doi:10.1126/science.aao4839.