
 ?Mathematical formulae have been encoded as MathML and are displayed in this HTML version using MathJax in order to improve their display. Uncheck the box to turn MathJax off. This feature requires Javascript. Click on a formula to zoom.
Abstract
Here, we used a modified single-particle soot photometer (SP2) coupled with a concentric pneumatic nebulizer to measure the size-resolved number and mass concentrations of light-absorbing iron oxide aerosols (FeOx) in liquid water (CNFeOx and CMFeOx, respectively). The SP2 could selectively detect individual FeOx particles in mixed wüstite–fullerene soot laboratory samples and melted Arctic snow samples. The nebulizer efficiency for FeOx particles was about 50% within the 70–650 nm diameter range, as derived from the ratio of the volume of ammonium sulfate before and after extraction by the nebulizer and the size-resolved transmission efficiency in the nebulizer–SP2 sampling line. Uncertainty from the boundary lines empirically drawn to discriminate the scatterplots of FeOx and black carbon in the mixed wüstite–fullerene soot suspensions and snow samples was approximately 3.0% and 10%, respectively. Overall uncertainty in total CNFeOx and CMFeOx (220–1400 nm) was approximately 19% and 18%, respectively. After storage at 4 °C for 16 months, the FeOx particle size distributions in melted Arctic snow had remained stable, and CNFeOx and CMFeOx had changed by less than 19% and 1.0%, on average, respectively. Most of the FeOx on dust particles measured by this system was estimated to be in the diameter range smaller than 1000 nm, considering the nebulizer efficiency for dust particles. The high accuracy of the CNFeOx and CMFeOx measurements will help to improve our quantitative understanding of the wet deposition of FeOx and provide more accurate estimates of the effects of FeOx on snow surface albedo.
EDITOR:
1. Introduction
Iron oxide aerosols (FeOx) absorb solar radiation and heat the atmosphere. Absorption of solar radiation by FeOx particles deposited onto high- and mid-latitude snow can decrease the albedo of snow surfaces and accelerate snowmelt (Ito, Lin, and Penner Citation2018; Matsui et al. Citation2018; Moteki et al. Citation2017), which may contribute to the acceleration of global warming. However, deposition of FeOx-containing particles to the ocean where iron is limited can also influence ocean primary productivity and marine ecosystems, increasing carbon dioxide uptake into the ocean (Jickells et al. Citation2005; Matsui et al. Citation2018).
FeOx particles are emitted both from anthropogenic and natural sources. Anthropogenic sources are mainly blast furnaces of iron manufacturing facilities, coal and heavy oil combustion, and the brakes of motor vehicles (Fu et al. Citation2012; Machemer Citation2004; Sanderson et al. Citation2016). Natural sources include emissions of mineral dust particles from desert soils (Nowak et al. Citation2018). Emitted FeOx particles would become hydrophilic while aging during transport; therefore, it is likely that FeOx-containing particles with diameters of less than a few micrometers are removed from the atmosphere mainly by precipitation. To improve our understanding of the wet deposition of FeOx, accurate measurements of the number and mass size distributions of FeOx in hydrometeor samples are needed.
Generally, Fe concentrations are measured in water samples by means of bulk chemical analyses using inductively coupled plasma mass spectrometry or energy dispersive X-ray fluorescence (Bhatia et al. Citation2013; Iwamoto et al. Citation2009); however, these approaches provide no data on the size distributions of Fe-containing particles in the samples. To address this issue, Yoshida et al. (Citation2016) used a modified single-particle soot photometer, based on a laser-induced incandescence technique (Moteki and Kondo Citation2010), to selectively detect individual FeOx and black carbon (BC) particles and measure their size distributions in the atmosphere. This technique has also been used by others to measure the number and mass size distributions of FeOx particles in the atmosphere (Moteki et al. Citation2017; Ohata et al. Citation2018; Yoshida et al. Citation2018; Yoshida et al. Citation2020). Lamb et al. (Citation2021) have also measured the size distributions of FeOx in the atmosphere using their own modified SP2 (Lamb Citation2019; Schwarz et al. Citation2010).
Mori et al. (Citation2016) used a differently modified SP2 with a concentric pneumatic nebulizer (Marin-5; CETAC Technologies, Inc., USA) to measure the size-resolved number and mass concentrations of BC in liquid water with an accuracy of approximately 16%. In the present study, for the first time, we used the same nebulizer–SP2 system to measure the size-resolved number and mass concentrations of FeOx in liquid water (CNFeOx and CMFeOx, respectively). Here, we describe our methodologies for measuring the size distributions and associated uncertainties of FeOx in water, and then apply our approach to examining the stability of FeOx in water during long-term storage.
2. Methods
To determine the masses of the BC and FeOx particles in the study samples, we used a nebulizer–SP2 system, as reported previously (Katich, Perring, and Schwarz Citation2017; Mori et al. Citation2016; Schnaiter et al. Citation2019). In brief, water samples were agitated by an ultrasonic bath for 15 min to remove any particles from the walls of the glass container (Mori et al. Citation2014) and then injected into the nebulizer at a constant flow rate (3.0 or 6.0 μL s−1) by a peristaltic pump (Reglo Digital, Ismatec, Switzerland). Nebulization of the samples generated droplets with a majority size of 2–3 µm, which were then evaporated at 140 °C in the nebulizer’s heated spray chamber. A portion of the BC and/or FeOx particles was extracted by the nebulizer at a constant flow rate (16 cm3 s−1 at standard temperature and pressure) and introduced into the SP2 for measurement of the masses of the individual particles in the carrier gas. To quantify the number and mass size distributions of FeOx in the water samples, we determined the size-resolved number and mass concentrations of FeOx in the carrier gas (Sections 2.1 and 2.2) and the nebulizer extraction efficiency for FeOx particles (Section 2.3).
2.1. Using the SP2 for the detection of airborne FeOx
SP2 instruments have been used previously to measure the masses of individual airborne FeOx (e.g., magnetite) and BC particles (Moteki et al. Citation2017; Yoshida et al. Citation2016). Inside an SP2, the airborne sample is passed through a Nd:YAG laser beam (λ = 1064 nm) and particles contained in the sample absorb energy from the laser, heat up to their evaporation temperature (e.g., of 3300 K for FeOx and 4100 K for BC), and incandesce (Yoshida et al. Citation2016). In the modified SP2 of Yoshida et al. (Citation2016), the incandescence signal (Si) is detected using two photomultiplier tubes, one sensitive to the blue band range (λ = 300–550 nm) and one sensitive to the red band range (λ = 580–710 nm), and the ratio of the peak Si of the blue band to that of the red band, which is hereafter referred to as the color ratio, is then determined (Moteki and Kondo Citation2010). This color ratio is a key parameter to discriminate between FeOx and BC particles because its value strongly depends on the blackbody temperature of individual light-absorbing aerosols. After discriminating FeOx and BC particles by color ratio, the masses of individual FeOx particles are derived from the experimentally determined relationship between peak Si of the blue band and the masses of laboratory samples of FeOx (e.g., magnetite and wüstite) (Yoshida et al. Citation2016). Note that although the SP2 can detect FeOx particles such as magnetite and hematite, the detection of other FeOx particles, such as ferrihydrite, is difficult due to their weaker light-absorption efficiency (Yoshida et al. Citation2016).
2.2. Discrimination of FeOx from BC
Commercial SP2 instruments are generally able to measure the individual masses of BC particles within a mass equivalent diameter (Dm) range of 70–600 nm. However, our modified SP2 can measure the individual masses of BC particles within a Dm range of 70–4170 nm, assuming a void-free density of 1.80 g cm−3 (Mori et al. Citation2016; Moteki and Kondo Citation2010). The extended Dm range of our SP2 is accomplished by replacing a position-sensitive Si-avalanche photodiode with a H6779 photomultiplier tube and by lowering the sensitivity of the photomultiplier tube. Hereafter, our wide-range SP2 is referred to as wSP2.
To confirm that FeOx particles could be discriminated from BC particles by the wSP2, we measured the relationship between peak Si of the blue band and color ratio by using laboratory samples of a finely powdered wüstite (Kojundo Chemical Laboratory Co., Ltd., Tokyo, Japan) and fullerene soot (Alfa Aesar, Inc., Ward Hill, MA, USA) (Section 2.2.1), which were used as standard materials for FeOx and BC, respectively (Yoshida et al. Citation2016), and by using environmental samples (Section 2.2.2). Yoshida et al. (Citation2016) have previously demonstrated that the color ratios for finely powdered magnetite and wüstite samples are comparable.
2.2.1. Laboratory samples
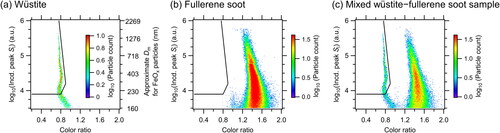
The wüstite and fullerene soot laboratory samples were dispersed separately into ultrapure water and then aerosolized using an aerosol generator (AG-100, Droplet Measurement Technologies, Longmont, CO, USA). After passing through a diffusion dryer (Model 3062, TSI Inc., Minnesota, USA) and a neutralizer (Model 1090, TSI Inc., Minnesota, USA), the aerosolized particles were mass sorted in an aerosol particle mass analyzer (APM model 3601, Kanomax, Japan) and introduced into the wSP2. The shapes of the scatterplots of the peak Si of the blue band and color ratio were very different and the color ratios were mainly in the ranges of 0.7–0.9 for wüstite and 1.2–1.8 for fullerene soot (). The results indicate that the two laboratory samples could be separated by a boundary line (i.e., solid lines in ).
Figure 1. Relationship between peak incandescence (Incd.) signals (Si) and color ratios for laboratory samples of (a) wüstite, (b) fullerene soot, and (c) mixed wüstite–fullerene soot; snowpack, surface snow, and subsurface snow samples from (d) Alaska, (e) Finland, (f) North Siberia, (g) Greenland, and (h) Ny-Ålesund; and (i) precipitation samples from Ny-Ålesund during 2016–2021. Empirically determined boundary lines discriminating FeOx and BC scatterplots are shown as black lines in each panel. The color code indicates particle counts on a logarithmic scale. The right axis in (a) shows the approximate mass equivalent diameter (Dm) of magnetite particles.
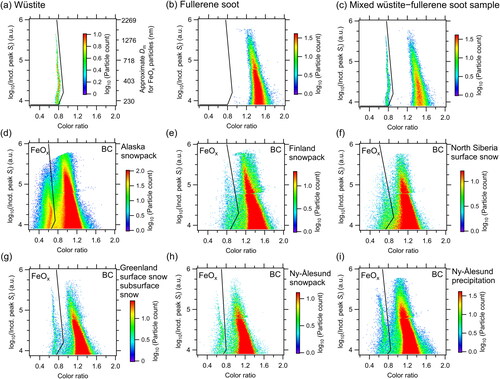
A similar scatterplot was also obtained for mixed wüstite–fullerene soot suspensions (; sample preparation is described in Appendix A). The scatterplots for wüstite and fullerene soot particles could be clearly discriminated; however, there was an area where the scatterplots overlapped (log10(Incd. peak Si) value range, 3.5–3.9 [i.e., 160 nm < Dm < 220 nm for the FeOx particles]; color ratio range, 1.0–1.2; ). Increasing the lower threshold used for the log10(Incd. peak Si) value from 3.9 (Dm = 220 nm) to 4.25 (Dm = 320 nm) reduced the overlap, decreasing the uncertainties in the CNFeOx and CMFeOx values. Although the CMFeOx (Dm > 320 nm)/CMFeOx (Dm > 220 nm) ratio was close to unity, the average CNFeOx (Dm > 320 nm)/CNFeOx (Dm > 220 nm) ratio was 0.60 ± 0.08 in our precipitation and snowpack samples. Therefore, to obtain statistically reliable dataset and minimize the overall measurement uncertainty, we used the FeOx data with Dm > 220 nm.
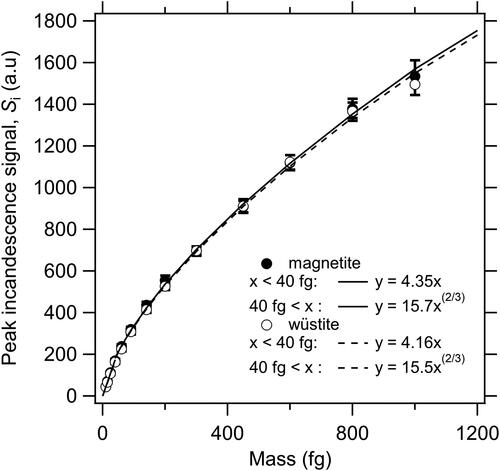
A calibration curve for the relationship between peak Si and the mass of individual wüstite and magnetite particles was conducted and used to derive FeOx mass concentrations (). The calibration curve for the wüstite was very similar to that for the magnetite, which is consistent with our previous findings (Yoshida et al. Citation2016). Size-resolved mass concentrations of FeOx in air were derived from the calibration curve by assuming a magnetite density of 5.17 g cm−3.
Figure 2. Regressions between peak incandescence signal (Si) and the masses of individual particles of magnetite and wüstite. Calibration curves were fitted with the least squares method.
2.2.2. Melted snow and precipitation samples
We also investigated the peak Si–color ratio relationships of samples of melted snow (surface snow, subsurface snow, or snowpack) collected from Alaska, Finland, North Siberia, Greenland, and Ny-Ålesund, and samples of precipitation collected from Ny-Ålesund (). The snow samples were melted at room temperature before storage, whereas the precipitation samples received no additional treatment; all samples were stored in a refrigerator at 4 °C until analysis. Details of the snow and precipitation sampling methods are described in Mori et al. (Citation2019) and Mori et al. (Citation2021), respectively. Data related to the samplings and sample storage periods are summarized in . For the Arctic snowpack and precipitation samples, the scatterplots for the FeOx and BC particles could be discriminated sufficiently. However, the absolute values of the color ratio depended to some extent on the average YAG laser voltage during the analysis (). Therefore, we empirically determined the boundary lines discriminating the scatterplots for the FeOx and BC particles for each set of samples (Yoshida et al. Citation2016). The change in the color ratio depending on the YAG laser voltage and the uncertainty associated with empirically determining the boundary lines are discussed in Section 3.
Table 1. Details of the snow samples used in the present study.
2.3. Derivation of CNFeOx and CMFeOx
Some of the aerosol particles generated by the nebulizer are lost inside the chamber or during transmission from the nebulizer to the wSP2 mainly due to gravitational deposition, Brownian diffusion, and inertial deposition caused by flow constriction. Therefore, before deriving the CNFeOx and CMFeOx, we first need to estimate the size-resolved transmission efficiency (Tr) for transmission of the sample from the nebulizer to the laser beam in the wSP2, and nebulizer extraction efficiency (ε) for FeOx particles.
2.3.1. Particle transmission efficiency (Tr)
We calculated the size-resolved Tr for the polystyrene latex (PSL) spheres and magnetite particles in the carrier gas using on the method described by Kulkarni, Baron, and Willeke (Citation2011), assuming a density and a shape factor of the aerosol particles. The shape factor is generally derived from the effective and true density values of the aerosol particle (Moteki and Kondo Citation2010). We assumed that the shape factor of magnetite is the same as that of BC (Yoshida et al. Citation2018; Yoshida et al. Citation2020).
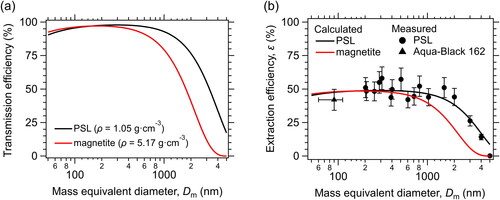
The Tr values were largely size-independent within the Dm range of 50–2000 nm for PSL spheres and the range of 50–650 nm for magnetite, whereas the values decreased at Dm values larger than these ranges mainly due to gravitational deposition (). The Tr values for hematite (density = 5.25 g cm−3) were very similar to those for magnetite (data not shown). Our calculation also shows that the larger FeOx particles were lost mainly during transmission of the carrier gas from the outflow of the nebulizer to the inlet of the wSP2. The uncertainties in the calculation of the Tr values, arising from uncertainties in the conductive tube length and the flow rate of the carrier gas, were within 10% for the Dm range of 50–1000 nm, on average. At larger Dm values, Tr was more sensitive to changes in the density and shape factor of the aerosols. However, it should also be noted that FeOx-containing dust particles will be lost more efficiently than internally unmixed FeOx particles (hereafter, “pure FeOx particles”) for the same FeOx mass due to larger total masses.
Figure 3. (a) Theoretically calculated transmission efficiency for polystyrene latex (PSL) spheres and magnetite particles, assuming densities (ρ) of 1.05 and 5.17 g cm−3 and shape factors of 1.0 and 1.52, respectively. (b) Extraction efficiency (ε) of the nebulizer, as determined experimentally for water suspensions of PSL particles with known number concentration and those of Aqua-Black 162 particles with known mass concentration (data modified from Mori et al. Citation2016) or calculated for PSL and FeOx particles. Bars indicate the systematic errors of ε, which are derived from the typical errors for the number concentrations in a carrier gas and liquid water, peristaltic pump flow rate, and nebulizer flow rate.
2.3.2. Nebulizer extraction efficiency (ε) for FeOx particles
Mori et al. (Citation2016) used ammonium sulfate solutions of known mass concentrations to measure the volume concentration of dried ammonium sulfate in a carrier gas (15–900 nm) using a system that comprised a scanning mobility particle sizer spectrometer coupled with a nebulizer. They showed that approximately half of the total volume concentration of ammonium sulfate particles within a Dm range of 15–900 nm was lost in the nebulizer. Theoretical nebulizer extraction efficiencies (ε) can be calculated by using size-resolved Tr and volume loss rate (VLR) values as follows:
(1)
(1)
The VLR depends on the peristaltic pump flow rate. In the present setup, VLR value was 0.5 at a peristaltic pump flow rate of 3.0 μL s−1 and 0.65 at a flow rate of 6.0 μL s−1. Within the 70–2000 nm Dm range, the measured ε values for PSL and Aqua-Black 162 (Tokai Carbon Co., Ltd., Tokyo, Japan) at the peristaltic pump flow rate of 3.0 μL s−1 were both around 50%; at larger Dm (2000–5000 nm), the ε values gradually decreased (). Our calculated ε values for PSL were consistent with the experimentally determined values. Katich, Perring, and Schwarz (Citation2017) and Schnaiter et al. (Citation2019) derived ε values of about 35%–50%, using water suspensions of PSL and fullerene soot particles with known number and mass concentrations.
We used EquationEquation (1)(1)
(1) to estimate the size-resolved ε values for FeOx (εFeOx). Within the 50–650 nm Dm range, εFeOx values were stable at about 50%, on average. For larger particles, the εFeOx value gradually decreased with increasing diameter ().
2.3.3. Size distribution of FeOx in water
The mass size distribution of FeOx in water (dCMFeOx/dlogDm) was derived from the peristaltic pump flow rate (Vpump), nebulizer flow rate (Fneb), size-resolved εFeOx(Dm), and mass size distribution of FeOx in the carrier gas (dMFeOx/dlogDm), as follows
(2)
(2)
Using the number size distribution of FeOx in the carrier gas (dNFeOx/dlogDm), the number size distribution of FeOx in water (dCNFeOx/dlogDm) was similarly derived. The CNFeOx and CMFeOx values were calculated by integrating dCNFeOx/dlogDm and dCMFeOx/dlogDm, respectively, over a Dm range of 220–4000 nm.
3. Uncertainties of CNFeOx and CMFeOx
We evaluated the measurement uncertainty of the CNFeOx and CMFeOx using laboratory samples (Section 3.1) and Arctic snow samples (Section 3.2).
3.1. Laboratory samples
We prepared separate wüstite and fullerene soot suspensions of known mass concentrations (i.e., pure suspensions), which we then combined to obtain mixed suspensions with volume ratios (R) with respect to the wüstite component of 0.52, 0.71, and 0.84; the pure wüstite suspension had an R of 1 and the pure fullerene soot suspension had an R of 0. The detailed procedure for preparing these suspensions is described in Appendix A.
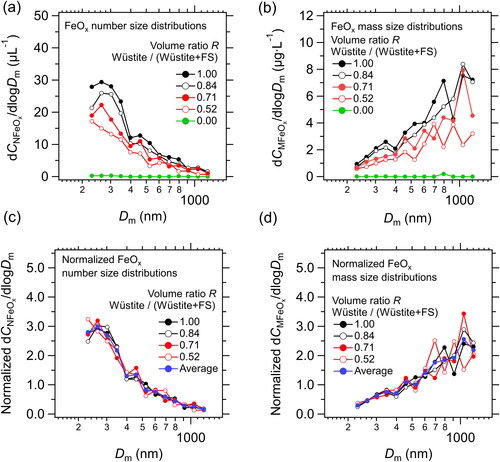
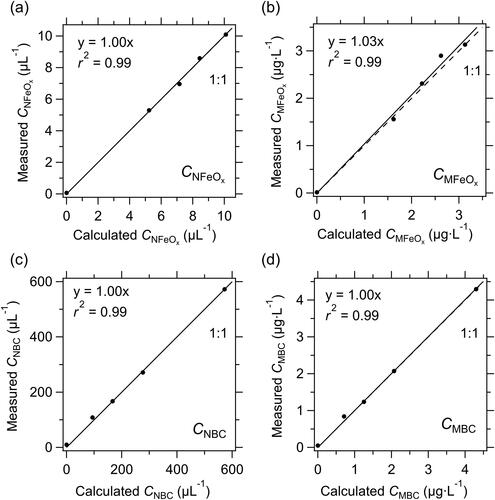
Using the relationships between peak Si and color ratio determined earlier (), we derived the size-resolved CNFeOx and CMFeOx of the five suspensions (). The values of CNFeOx and CMFeOx of the pure wüstite suspension were 10 µL−1 and 3.1 μg L−1, respectively, whereas those of the fullerene soot suspension were very close to zero. The values of CNFeOx and CMFeOx of the three mixed samples were 5.30–8.60 µL−1 and 1.56–2.90 μg L−1, respectively. We also derived the number and mass concentrations of fullerene soot in these samples within the 75–4000 nm Dm range (CNBC and CMBC, respectively). The CNFeOx/CNBC and CMFeOx/CMBC ratios in the mixed samples were 0.02–0.08 and 0.75–3.45, respectively. These ratios were similar to the averages for the Arctic snow samples (0.02 for the CNFeOx/CNBC ratio and 0.99 for the CMFeOx/CMBC ratio).
Figure 4. (a) Number and (b) mass size distributions of FeOx in a pure wüstite suspension, three mixed wüstite–fullerene soot suspensions, and a pure fullerene soot (FS) suspension. The volume ratio of the wüstite suspension to the total volume (R) was 1.0, 0.84, 0.71, 0.52, and 0.0. (c) Number and (d) mass size distributions of FeOx in a pure wüstite suspension and three mixed suspensions, normalized by total FeOx number and mass concentration, respectively, and their averages.
We calculated the CNFeOx and CMFeOx of the mixed samples by multiplying the measured CNFeOx and CMFeOx of the pure wüstite suspension by R (= 0, 0.52, 0.71, 0.84, and 1.0). The CNBC and CMBC of the mixed samples were also calculated in a similar way by using a multiplication factor of 1–R.
The shapes of the measured FeOx number and mass size distributions in the mixed samples changed little with R (). The measured CNFeOx was close to the calculated CNFeOx value (), and the measured and calculated CMFeOx values agreed to within 3%, on average (). The measured CNBC and CMBC values were also very close to those calculated (). These results indicate that the FeOx particles could be clearly discriminated from the BC particles by using our empirically determined boundary lines, and that the measurement uncertainty of CNFeOx and CMFeOx associated with the discrimination procedure was within 3%, on average.
Figure 5. Relationships (a) between the measured and calculated CNFeOx and (b) between the measured and calculated CMFeOx. (c, d) Same as (a, b) but for fullerene soot.
3.2. Arctic snow samples
We used snow samples collected in the Arctic to derive the uncertainties of CNFeOx and CMFeOx arising from the uncertainties in the factors used to calculate dCNFeOx/dlogDm and dCMFeOx/dlogDm (i.e., dNFeOx/dlogDm, dMFeOx/dlogDm, Fneb, Vpump, and εFeOx).
The derived NFeOx and MFeOx in the carrier gas depended on the boundary lines chosen between FeOx and BC. The empirically determined boundary lines are shown in for the snow samples from North Siberia, Greenland, and Ny-Ålesund, and the precipitation samples from Ny-Ålesund. Together with a pit sample from Greenland (), the average color ratio of the FeOx particles was approximately 0.7. In the sample analyses, the YAG laser voltage in the SP2 was lower for samples from Alaska (average 1.97 V) and higher for samples from Finland (average 4.0 V) (). Median color ratios, derived from the Gaussian fitted frequency distributions of FeOx and BC particles (), were markedly influenced by the average voltage of the YAG laser (). In contrast, the geometric standard deviation (GSD) and the difference of the median color ratios determined for the FeOx and BC particles changed little with voltage (). Thus, the peak Si–color ratio distributions were shifted to smaller values for the Alaska samples and to larger values for the Finland samples. Due to the lack of representativeness, we excluded the boundary lines for the Alaska and Finland snowpack samples from the derivation of the average boundary line.
Figure 6. Frequency distributions of the color ratio for FeOx and BC in snowpack, surface snow, and subsurface snow samples from (a) Alaska, (b) Finland, (c) North Siberia, (d) Greenland, and (e) Ny-Ålesund; and in (f) precipitation samples from Ny-Ålesund. The average voltage of the YAG laser beam is shown at the top of each panel. Solid lines indicate Gaussian fitted FeOx and BC number distributions.
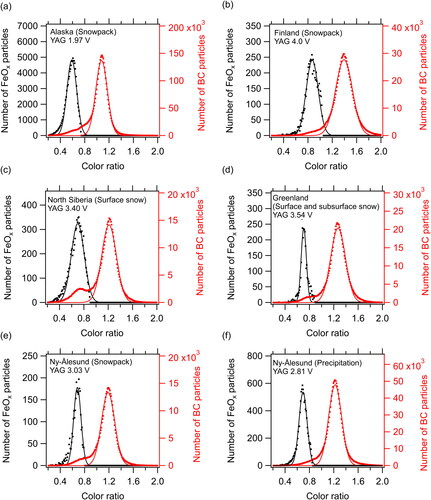
Figure 7. (a) Median color ratio and (b) geometric standard deviation (GSD) derived from the Gaussian fitted frequency distributions for FeOx and BC in snowpack, surface snow, and subsurface snow samples () versus average voltage of the YAG laser beam. (c) Relationship of the difference of the median color ratio between FeOx and BC versus the average voltage of the YAG laser beam. Solid lines indicate least squares fitted regressions.
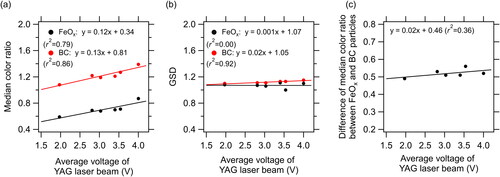
Table 2. Details of the snow sampling conducted in Alaska and Greenland.
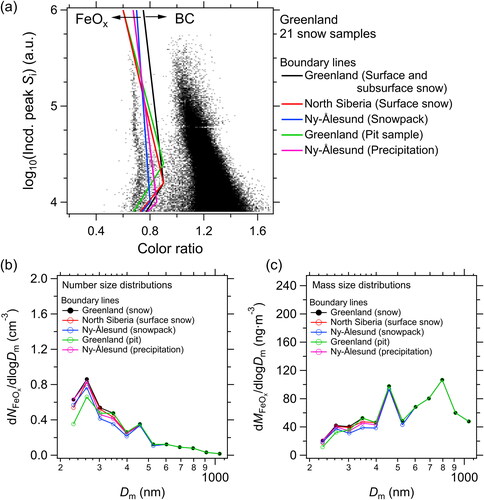
shows the five remaining boundary lines overlaid on a composite peak Si–color ratio scatter plot for the 21 surface and subsurface snow samples collected from Greenland (), which were used to derive the number and mass size distributions of FeOx in the carrier gases for each boundary line. We used a surface snow sample from East Greenland Ice-core Project (EGRIP) camp in Greenland () to investigate the differences in the shapes of the size distributions of FeOx and found that the shapes of the size distributions did not markedly depend on the boundary lines used (). The average (±1σ) values of NFeOx and MFeOx were 0.20 ± 0.01 (±6.7%) cm−3 and 41 ± 1.0 ng m−3 (±2.5%), respectively, indicating the small dependence of these values on the choice of boundary line. The NFeOx and MFeOx values of the surface and subsurface snow samples from Greenland, derived by using the five boundary lines, agreed within 10% and 7.0%, respectively. Thus, we concluded that the uncertainties in NFeOx and MFeOx associated with the determination of the boundary lines were approximately 10% and 7.0%, respectively.
Figure 8. (a) Five boundary lines discriminating between FeOx and BC particles overlaid on a scatterplot of the peak incandescence signal and color ratio for the 21 snow samples from Greenland. These boundary lines were empirically determined by using the scatterplots obtained from each sample (i.e., surface and subsurface snow samples from Greenland, surface snow samples from North Siberia, snowpack samples from Ny-Ålesund (Svalbard), pit samples from Greenland, and precipitation samples from Ny-Ålesund). (b, c) Number and mass size distributions of FeOx (extracted from a Greenland snow sample) in the carrier gas, for each boundary line, respectively. Dm, mass equivalent diameter.
The overall uncertainties of the CNFeOx and CMFeOx determinations within the Dm range of 220–1400 nm were approximately 19% and 18%, respectively, as derived from the typical errors for dNFeOx/dlogDm (±10%), dMFeOx/dlogDm (±7.0%), Vpump (±5.0%), Fneb (±5.0%), and εFeOx (±15%).
4. Long-term stability of FeOx concentrations in water
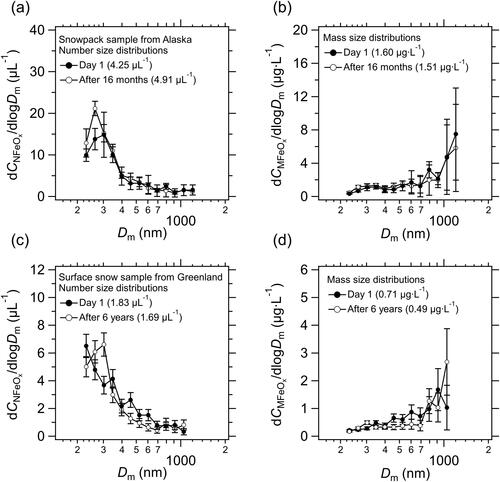
We also investigated the changes in the FeOx number and mass size distributions during long-term storage in a refrigerator at 4 °C for five snowpack samples from Alaska and four surface snow samples from Greenland (). The samples were examined immediately after melting and again 16 months later for the Alaska snowpack samples, and 6 years later for the Greenland surface snow samples. At the first analysis, the average (±1σ) values of CNFeOx and CMFeOx for all 9 samples were 6.8 ± 7.1 µL−1 and 1.9 ± 1.7 µg L−1, respectively. For simplicity, we represent CNFeOx and CMFeOx at t months or t years after the measurement taken immediately after melting (Day 1) as CNFeOx (t) and CMFeOx (t), respectively.
The shapes of the number and mass size distributions of FeOx in snowpack from Alaska changed little during the 16-month storage period (). On average, the values of CNFeOx (Day 1) and CNFeOx (16 months) agreed to within 4.0%, and those for mass concentration agreed to within 6.0%. For the surface snow from Greenland, the average CNFeOx (6 years)/CNFeOx (Day 1) ratio was 1.17 ± 0.24, and that for mass concentration was 0.72 ± 0.30. The changes in the shapes of the number and mass size distributions of FeOx were greater than those of the other samples (), partly due to the low CNFeOx and CMFeOx. In the Dm range of 220–600 nm, on average, the values of CNFeOx (6 years) and CNFeOx (Day 1) agreed to within 20%, and those for mass concentration agreed to within 10%.
Figure 9. (a) Number size distributions of FeOx in a snowpack sample from Alaska measured immediately after melting (Day 1) and 16 months later, and (c) in a surface snow sample from Greenland measured at Day 1 and 6 years later. (b, d) Same as (a, c), but for mass size distributions. Bars indicate ±1σ Poisson distributions. Dm, mass equivalent diameter.
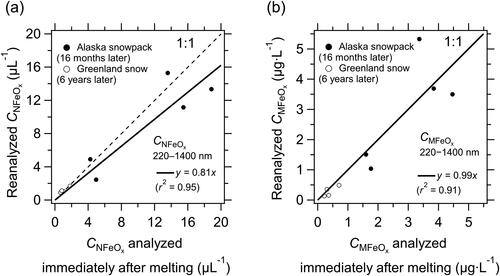
The values of CNFeOx and CMFeOx (16 months or 6 years) in all samples were well correlated with those immediately after melting (slope of the regression line = 0.81 and r2 = 0.95 for CNFeOx, ; slope of the regression line = 0.99 and r2 = 0.91 for CMFeOx, ). The average (±1σ) CNFeOx (16 months or 6 years)/CNFeOx (Day 1) ratio was 0.99 ± 0.30, and that for mass concentration was 0.86 ± 0.35. On average, for the melted snow samples, CNFeOx and CMFeOx agreed to within 19% and 1.0%, respectively, and the shapes of the size distributions of FeOx changed little during the 16-month storage period. The high reproducibility of the size distributions of FeOx in water verified that the measurements after storage were reliable.
Figure 10. (a) Correlation between CNFeOx determined immediately after melting and 16 months and 6 years later. (b) Same as (a) but for mass concentrations. Solid lines indicate least squares fitted regressions.
5. Measurement of FeOx in dust particles
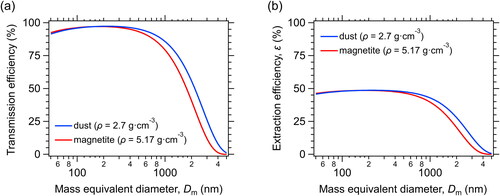
Thus far, we have estimated the uncertainty of the measurements of pure FeOx particles which are not internally mixed with dust particles. Next, we calculated the size range of FeOx on dust particles. We denote Dtotal as the mass equivalent diameter of a dust particle and DFeOx as that of FeOx present on its surface. We calculated the Tr and ε values for dust particles by assuming a density of 2.7 g cm−3 (Hansell et al. Citation2011) and a shape factor of 1.2 (Adachi et al. Citation2021). The Tr and ε values for the dust particles gradually decreased with diameter (). The ε values were somewhat higher than those for the magnetite particles (i.e., pure FeOx particles) because of the lower density of the dust particles. The maximum Dtotal that can be substantially detected by the system is approximately 3000 nm.
Figure 11. Same as , but for dust particles, assuming a density (ρ) of 2.7 g cm−3 and a shape factor of 1.2. For comparison, the theoretically calculated transmission efficiency and extraction efficiency for a magnetite particle are also shown.
We define
(3)
(3)
as a measure of the degree of internal mixing of each FeOx particle. In the Arctic, Dtotal is often larger than 1000 nm (Adachi et al. Citation2021; Nagatsuka et al. Citation2021). Adachi et al. (Citation2021) showed an example of a dust particle with a Dtotal of ∼2000 nm and a DFeOx of ∼100 nm, as measured by transmission electron microscopy. In this case, α is about 0.05.
The maximum DFeOx that can be measured by the system will be about 3000α nm, considering that the maximum detectable Dtotal is about 3000 nm. For α = 0.25 and 0.5, the upper detection limit of DFeOx is estimated to be 750 and 1500 nm, respectively. Actually, α will be considerably lower than these values, as suggested by the example of Adachi et al. (Citation2021). Therefore, it is likely that the majority of pure FeOx contained in dust particles will be in the size range smaller than 1000 nm for reasonable values of α.
6. Summary
Here, we developed a technique for measuring the size distributions of light-absorbing iron oxide (FeOx) in water by using a combined concentric pneumatic nebulizer and modified wide-range single-particle soot photometer. To estimate the overall accuracy of determinations of the number and mass concentrations of FeOx in water (CNFeOx and CMFeOx, respectively), we investigated the uncertainties of the key factors involved in the measurements: selective detection and calibration of FeOx; extraction efficiency of the nebulizer for FeOx particles; overall error estimates; and stability of FeOx concentrations in water during storage.
We first investigated the relationship between the peak incandescence signals of the blue band and color ratios determined with our wSP2 for finely powdered wüstite, fullerene soot, and mixed wüstite–fullerene soot samples. We demonstrated that the wSP2 separately detects FeOx and BC particles. For several melted Arctic snow samples, FeOx and BC particles were discriminated in the resulting scatterplots by using empirically determined boundary lines, taking into account the dependence of color ratio on the YAG laser voltage.
We calculated the nebulizer extraction efficiency (ε) for magnetite particles using an assumed density of 5.17 g cm−3 and shape factor of 1.52. For magnetite particles within 50 nm < Dm < 650 nm, the ε values were about 50% and gradually decreased with increasing Dm above this upper limit.
The measurement uncertainties of CNFeOx and CMFeOx, associated with the separation of FeOx from BC, were estimated to be less than 3.0% for mixed wüstite–fullerene soot suspensions. The variabilities of the number and mass concentrations of FeOx, arising from five empirically determined boundary lines discriminating between FeOx and BC in the scatterplots obtained for snow samples, were 10% and 7.0%, respectively. The overall measurement uncertainties of CNFeOx and CMFeOx within the Dm range of 220–1400 nm were 19% and 18%, respectively.
We evaluated the reproducibility of the number and mass size distributions of FeOx in water for several melted Arctic snow samples after storage for 16 months or 6 years. On average, CNFeOx and CMFeOx were stable to within 19% and 1.0%, respectively, indicating that the number and mass size distributions measured at 16 months after the samples were initially melted were not markedly altered.
We estimated that the maximum diameter of dust particles detectable by our nebulizer–wSP2 system was about 3000 nm. The major portions of FeOx on dust particles measured by the present system were estimated to be in the size range smaller than 1000 nm with reasonable values for the degree of internal mixing.
We expect the present measurement technique to be useful for improving quantitative understanding of the wet deposition of FeOx. In future studies, it will be important to compare FeOx mass concentrations measured by the present approach with total Fe concentrations measured by other methods, such as inductively coupled plasma mass spectrometry.
| Nomenclature | ||
| Dm | = | mass equivalent diameter [nm] |
| CMFeOx | = | mass concentration of light-absorbing FeOx in liquid water [µg L−1] |
| CNFeOx | = | number concentration of FeOx in liquid water [µL−1] |
| εFeOx | = | nebulizer extraction efficiency of FeOx particles [%] |
| Fneb | = | nebulizer flow rate at standard temperature and pressure [STP cm3 s−1] |
| Vpump | = | peristaltic pump flow rate [µL s−1] |
| Tr | = | transmission efficiency [%] |
| MFeOx | = | mass concentration of FeOx in a carrier gas [STP ng m−3] |
| NFeOx | = | number concentration of FeOx in a carrier gas [STP cm−3] |
Acknowledgments
The authors thank J. Matsushita, T. Aoki, F. Nakazawa, W. Shigeyama of the National Institute of Polar Research; A. Sato, formerly of the Snow and Ice Research Center; A. Tsushima of Chiba University; S. Omiya of the Civil Engineering Research Institute for Cold Region; S. Matoba, A. Sugimoto, and S. Takano of Hokkaido University; M. Schneebeli and K. Steffen of the WSL Institute for Snow and Avalanche Research; and the staff of the Norwegian Polar Institute for collecting the precipitation samples at Ny-Ålesund and melted snow (i.e., surface, subsurface, snowpack, and pit) samples from Alaska, Finland, North Siberia, Ny-Ålesund, and Greenland. The pit samples were collected under The East Greenland Ice-Core Project (EGRIP) directed and organized by the Center of Ice and Climate at the Niels Bohr Institute and US NSF, Office of Polar Programs. We also thank K. Adachi of Meteorological Research Institute for useful comments on FeOx on dust particles.
Data availability statement
The data that support the findings of this study are openly available at https://ads.nipr.ac.jp/dataset/A20220428-001.
Additional information
Funding
References
- Adachi, K., N. Oshima, S. Ohata, A. Yoshida, N. Moteki, and M. Koike. 2021. Compositions and mixing states of aerosol particles by aircraft observations in the Arctic springtime, 2018. Atmos. Chem. Phys. 21 (5):3607–26. doi:10.5194/acp-21-3607-2021.
- Bhatia, M., E. B. Kujawinski, S. B. Das, C. F. Breier, P. B. Henderson, and M. A. Charette. 2013. Greenland meltwater as a significant and potentially bioavailable source of iron to the ocean. Nature Geosci. 6 (4):274–8. doi:10.1038/ngeo1746.
- Fu, H., J. Lin, G. Shang, W. Dong, V. H. Grassian, G. R. Carmichael, Y. Li, and J. Chen. 2012. Solubility of iron from combustion source particles in acidic media linked to iron speciation. Environ. Sci. Technol. 46 (20):11119–27. doi:10.1021/es302558m.
- Goto-Azuma, K., T. Homma, T. Saruya, F. Nakazawa, Y. Komuro, N. Nagatsuka, M. Hirabayashi, Y. Kondo, M. Koike, T. Aoki, et al. 2021. Studies on the variability of the Greenland ice sheet and climate. Polar Sci. 27:100557. doi:10.1016/j.polar.2020.100557.
- Hansell, R. A., Jr., J. S. Reid, S. C. Tsay, T. L. Roush, and O. V. Kalashnikova. 2011. A sensitivity study on the effects of particle chemistry, asphericity and size on the mass extinction efficiency of mineral dust in the earth’s atmosphere: From the near to thermal IR. Atmos. Chem. Phys. 11 (4):1527–47. doi:10.5194/acp-11-1527-2011.
- Ito, A., G. Lin, and J. E. Penner. 2018. Radiative forcing by light-absorbing aerosols of pyrogenetic iron oxides. Sci. Rep. 8 (1):7347. doi:10.1038/s41598-018-25756-3.
- Iwamoto, Y., Y. Narita, A. Tsuda, and M. Uematsu. 2009. Single particle analysis of oceanic suspended matter during the SEEDS II iron fertilization experiment. Mar. Chem. 113 (3-4):212–8. doi:10.1016/j.marchem.2009.02.002.
- Jickells, T. D., Z. S. An, K. K. Andersen, A. R. Baker, G. Bergametti, N. Brooks, J. J. Cao, P. W. Boyd, R. A. Duce, K. A. Hunter, et al. 2005. Global iron connections between dust, ocean biogeochemistry and climate. Science 308 (5718):67–71. doi:10.1126/science.1105959.
- Katich, J. M., A. E. Perring, and J. P. Schwarz. 2017. Optimized detection of particulates from liquid samples in the aerosol phase: Focus on black carbon. Aerosol Sci. Technol. 51 (5):543–53. doi:10.1080/02786826.2017.1280597.
- Komuro, Y., F. Nakazawa, M. Hirabayashi, K. Goto-Azuma, N. Nagatsuka, W. Shigeyama, S. Matoba, T. Homma, J. P. Steffensen, and D. Dahl-Jensen. 2021. Temporal and spatial variabilities in surface mass balance at the EGRIP site, Greenland from 2009 to 2017. Polar Sci. 27:100568. doi:10.1016/j.polar.2020.100568.
- Kulkarni, P., P. A. Baron, and K. Willeke. 2011. Aerosol measurement: Principles, techniques, and applications, Hoboken, NJ: John Wiley & Sons.
- Lamb, K. D. 2019. Classification of iron oxide aerosols by a single particle soot photometer using supervised machine learning. Atmos. Meas. Tech. 12 (7):3885–906. doi:10.5194/amt-12-3885-2019.
- Lamb, K. D., H. Matsui, J. M. Katich, A. E. Perring, J. R. Spackman, B. Weinzierl, M. Dollner, and J. P. Schwarz. 2021. Global-scale constraints on light-absorbing anthropogenic iron oxide aerosols. NPJ Clim. Atmos. Sci. 4 (1):15. doi:10.1038/s41612-021-00171-0.
- Machemer, S. D. 2004. Characterization of airborne and bulk particulate from iron and steel manufacturing facilities. Environ. Sci. Technol. 38 (2):381–9. doi:10.1021/es020897v.
- Matsui, H., N. M. Mahowald, N. Moteki, D. S. Hamilton, S. Ohata, A. Yoshida, M. Koike, R. A. Scanza, and M. G. Flanner. 2018. Anthropogenic combustion iron as a complex climate forcer. Nat. Commun. 9 (1):1593. doi:10.1038/s41467-018-03997-0.
- Mori, T., K. Goto-Azuma, Y. Kondo, Y. Ogawa-Tsukagawa, K. Miura, M. Hirabayashi, N. Oshima, M. Koike, K. Kupiainen, N. Moteki, et al. 2019. Black carbon and inorganic aerosols in Arctic snowpack. JGR. Atmos. 124 (23):13325–56. doi:10.1029/2019JD030623.
- Mori, T., Y. Kondo, S. Ohata, K. Goto-Azuma, K. Fukuda, Y. Ogawa-Tsukagawa, N. Moteki, A. Yoshida, M. Koike, P. R. Sinha, et al. 2021. Seasonal variation of wet deposition of black carbon at Ny-Ålesund, Svalbard. Geophys. Res. Atmos. 126 (12):e2020JD034110. doi:10.1029/2020JD034110.
- Mori, T., Y. Kondo, S. Ohata, N. Moteki, H. Matsui, N. Oshima, and A. Iwasaki. 2014. Wet deposition of black carbon at a remote site in the East China Sea. J. Geophys. Res. Atmos. 119 (17):10485–98. doi:10.1002/2014JD022103.
- Mori, T., N. Moteki, S. Ohata, M. Koike, K. Goto-Azuma, Y. Miyazaki, and Y. Kondo. 2016. Improved technique for measuring the size distribution of black carbon particles in liquid water. Aerosol Sci. Technol. 50 (3):242–54. doi:10.1080/02786826.2016.1147644.
- Moteki, N., K. Adachi, S. Ohata, A. Yoshida, T. Harigaya, M. Koike, and Y. Kondo. 2017. Anthropogenic iron oxide aerosols enhance atmospheric heating. Nat. Commun. 8:15329. doi:10.1038/ncomms15329.
- Moteki, N, and Y. Kondo. 2010. Dependence of laser-induced incandescence on physical properties of black carbon aerosols: Measurements and theoretical interpretation. Aerosol Sci. Technol. 44 (8):663–75. doi:10.1080/02786826.2010.484450.
- Nagatsuka, N., K. Goto-Azuma, A. Tsushima, K. Fujita, S. Matoba, Y. Onuma, R. Dallmayr, M. Kadota, M. Hirabayashi, J. Ogata, et al. 2021. Variations in mineralogy of dust in an ice core obtained from northwestern Greenland over the past 100 years. Clim. Past 17 (3):1341–62. doi:10.5194/cp-17-1341-2021.
- Nowak, S., S. Lafon, S. Caquineau, E. Journet, and B. Laurent. 2018. Quantitative study of the mineralogical composition of mineral dust aerosols by X-ray diffraction. Talanta 186:133–9. doi:10.1016/j.talanta.2018.03.059.
- Ohata, S., A. Yoshida, N. Moteki, K. Adachi, Y. Takahashi, M. Kurisu, and M. Koike. 2018. Abundance of light‐absorbing anthropogenic iron oxide aerosols in the urban atmosphere and their emission sources. J. Geophys. Res. Atmos. 123:8115–34. doi:10.1029/2018JD028363.
- Sanderson, P., S. S. Su, I. T. H. Chang, J. M. D. Saborit, D. M. Kepaptsoglou, R. J. M. Weber, and R. M. Harrison. 2016. Characterisation of iron-rich atmospheric submicrometre particles in the roadside environment. Atmos. Environ. 140:167–75. doi:10.1016/j.atmosenv.2016.05.040.
- Schnaiter, M., C. Linke, I. Ibrahim, A. Kiselev, F. Waitz, T. Leisner, S. Norra, and T. Rehm. 2019. Specifying the light-absorbing properties of aerosol particles in fresh snow samples, collected at the Environmental Research Station Schneefernerhaus (UFS), Zugspitze. Atmos. Chem. Phys. 19 (16):10829–44. doi:10.5194/acp-19-10829-2019.
- Schwarz, J. P., J. R. Spackman, R. S. Gao, A. E. Perring, E. Cross, T. B. Onasch, A. Ahern, W. Wrobel, P. Davidovits, J. Olfert, et al. 2010. The detection efficiency of the single particle soot photometer. Aerosol Sci. Technol. 44 (8):612–28. doi:10.1080/02786826.2010.481298.
- Yoshida, A., N. Moteki, S. Ohata, T. Mori, M. Koike, Y. Kondo, H. Matsui, N. Oshima, A. Takami, and K. Kita. 2020. Abundances and microphysical properties of light-absorbing iron oxide and black carbon aerosols over East Asia and the Arctic. J. Geophys. Res. Atmos. 125 (15):e2019JD032301. doi:10.1029/2019JD032301.
- Yoshida, A., N. Moteki, S. Ohata, T. Mori, R. Tada, P. Dagsson-Waldhauserová, and Y. Kondo. ‐ 2016. Detection of light-absorbing iron oxide particles using a modified single‐particle soot photometer. Aerosol Sci. Technol. 50 (3):1–4. doi:10.1080/02786826.2016.1146402.
- Yoshida, A., S. Ohata, N. Moteki, K. Adachi, T. Mori, M. Koike, and A. Takami. 2018. Abundance and emission flux of the anthropogenic iron oxide aerosols from the East Asian continental outflow. J. Geophys. Res. Atmos. 123 (19):11,194–209. doi:10.1029/2018JD028665.
Appendix A
Three suspensions with known mass concentrations (a pure wüstite suspension, a pure fullerene soot suspension, and a mixed wüstite-fullerene soot suspension) were prepared as follows:
Pure wüstite suspension. Wüstite granules (Kojundo Chemical Laboratory Co., Ltd., Tokyo, Japan) were ground with a spatula. Using an electronic balance (MS603, Mettler Toledo, Tokyo, Japan), 1.12 g wüstite was added to 100 mL ultrapure water in a 100-mL glass beaker, and mixed well using a vortex mixer (SRT010AA, Advantec MFS, Inc., Tokyo, Japan). Then, 1 mL methanol was added to the mixture, followed by mixing with the vortex mixer and sonication in an ultrasonic bath for 15 min.
Pure fullerene soot suspension. Using the same electronic balance, 0.020 g finely powdered fullerene soot (Alfa Aesar, Inc., Ward Hill, MA, USA) was weighted and added to 500 mL ultrapure water in a 500-mL glass beaker. After mixing well, 6 mL methanol was added to the mixture.
Mixed wüstite–fullerene soot suspension. Due to the high mass concentrations of the wüstite and fullerene soot suspensions, we diluted the two pure suspensions by a factor of about 3000 and 1000, respectively, and then mixed the dilutions together. The volume ratio of the diluted wüstite suspension volume to the total volume was adjusted to 0.52, 0.71, and 0.84.
Appendix B
Figure B1. Same as , but showing values for the Si range from 3.5 to 6.0.
Appendix C
Table C1. Average YAG laser voltages, median color ratios and geometric standard deviations for the frequency distributions of FeOx and BC particles, and the differences of the median color ratios determined for the FeOx and BC particles.