
 ?Mathematical formulae have been encoded as MathML and are displayed in this HTML version using MathJax in order to improve their display. Uncheck the box to turn MathJax off. This feature requires Javascript. Click on a formula to zoom.
Abstract
Single particle cavity ring-down spectroscopy (CRDS) allows direct and continuous measurements of the extinction cross-sections for levitated micron-scale aerosol particles of constant or evolving composition. Our recent interests have concerned single particle CRDS measurements for light-absorbing particles. These measurements are made on single, spherical particles evaporating over the radius range 1500–700 nm that are levitated within a 405-nm cavity ring-down spectrometer using a linear electrodynamic quadrupole trap. Here, we quantify the accuracy and precision of our cavity ring-down time measurements and the consequences of particle motion within our electrodynamic trap. Next, we estimate the uncertainty in our particle size retrievals from angularly resolved elastic light scattering measurements for particles with a range of absorption strengths. Finally, we assess the accuracy of complex refractive index values retrieved from simultaneous ring-down time and particle size measurements. The assessments account for the impacts of shot and detector noise in the measured ring-down times, the driven particle motion within the electrodynamic trap, and particle absorption strength (for imaginary refractive indices in the range ∼0.0–0.1). The real and imaginary refractive indices are retrieved to an accuracy better than 0.005 and 0.002, respectively, for almost all absorption strengths studied, and for particles of constant or evolving composition. Although particles confined in our electrodynamic quadrupole trap undergo considerable levels of driven motion (with oscillation amplitudes of several tens of micrometers), the contribution of this motion to uncertainty in retrieved refractive indices is negligible compared to contributions from particle sizing errors.
EDITOR:
1. Introduction
The radiative forcing caused by light-absorbing aerosols in Earth’s atmosphere represents one of the largest uncertainties in climate models (Masson-Delmotte et al. Citation2021). These particles alter radiative transfer through the atmospheric column by scattering and absorbing solar and terrestrial radiation. The interaction of light with an aerosol particle depends on the particle’s extinction cross-section (σext) and how it partitions into scattering (σsca) and absorbing (σabs) components. In addition to the particle size and morphology, these cross-sections depend critically on the complex refractive indices of the components comprising the particle (Bohren and Huffman Citation1998). The complex refractive index is given by m = n + ik, with the real refractive index n connected to the mean molecular polarizability and density of the medium, and the imaginary refractive index k controlled by the concentration and absorption strength of any constituent chromophores (Cotterell et al. Citation2020; Liu and Daum Citation2008).
Important classes of absorbing aerosol in the atmosphere include black carbon (Ramanathan and Carmichael Citation2008), a carbonaceous product of incomplete combustion that absorbs strongly over the visible spectrum, and mineral dust, a broad term for aerosol particles containing minerals such as hematite (Moosmüller, Chakrabarty, and Arnott Citation2009). In addition, aerosol particles composed of light absorbing organic carbon species, also known as brown carbon (BrC), are widespread in the atmosphere. Large uncertainties in the radiative forcing of BrC, with estimates varying by a factor of ∼15 (Feng, Ramanathan, and Kotamarthi Citation2013; Lin et al. Citation2014), derive from the poor characterization of BrC optical properties and how these evolve over particle lifetime (Bikkina and Sarin Citation2019; Carter et al. Citation2021; Wu et al. Citation2021). Accurate and sensitive measurements of the evolving complex refractive indices for BrC aerosols are therefore required to reduce uncertainties in the representation of aerosol-light interactions in climate models.
An established approach to characterize aerosol optical properties, both in laboratory studies and in field measurements on ambient samples, has been to probe aerosol ensembles, typically corresponding to 102-106 particles per cubic centimeter within a spectroscopic probe volume. For example, ensemble cavity ring-down spectroscopy (CRDS) sensitively measures an ensemble-average particle extinction (Bluvshtein et al. Citation2017; Mazurenka et al. Citation2005). Optical models such as Mie theory can then be used to retrieve the complex refractive index and separate the extinction cross-section into scattering and absorbing components. Inherent disadvantages with ensemble approaches include uncertainties in the characterized particle size distribution and number concentration, particle-to-particle variability in composition and morphology, and fluctuations in particle position with respect to the spectroscopic probe beam (Butler et al. Citation2009; Mason et al. Citation2012; Miles et al. Citation2011). Instead, the application of spectroscopic techniques to a single particle greatly mitigate these sources of uncertainty (Mason et al. Citation2012).
Recently, photophoretic spectroscopy (PPS) and Mie resonance spectroscopy were used to determine the complex refractive index of single, weakly absorbing (k < 10−4), aerosol particles (Bluvshtein, Krieger, and Peter Citation2020). Although the authors suggest that measurements of k up to values of 0.01 should be possible using PPS, current investigations and accuracy assessments do not extend to absorption strengths that are consistent with those of BrC aerosol (k∼10−3-10−1). Mie resonance spectroscopy was shown to enable retrievals of both components of the complex refractive index for single aerosol particles (Bain and Preston Citation2019; Price, Preston, and Davies Citation2022). However, uncertainties in the retrieved k reach values up to ∼0.03 (±50%; e.g., see Figure S11 of Price, Preston, and Davies (Citation2022)).
Our efforts to make accurate and precise determinations of aerosol particle complex refractive indices have instead focused on the application of CRDS to probe single aerosol particles levitated in optical or electrodynamic traps (Cotterell et al. Citation2022). We have used CRDS to measure σext for single non-absorbing aerosol particles, confined in a Bessel laser beam (BB) optical trap, as the particles evolve over time by evaporative loss of semi-volatile organic species or hygroscopic response to controlled changes in humidity (Cotterell et al. Citation2016; Cotterell et al. Citation2020; Cotterell et al. Citation2017). In this previous work, we observed scatter in the experimental σext values compared to Lorenz-Mie predictions but showed that the measured cross-section values lay within an envelope accounted for by the standing wave light-field inside the high-finesse optical cavity used for CRDS. At any moment in time, a levitated aerosol particle could be centered at a node (corresponding to a phase ϕ = 0 of the sinusoidal standing wave) or anti-node (ϕ = π/2) of this standing wave field, or any phase in between these two limits. Importantly, the magnitude of the light extinguished by the particle depends on its position within this field. A particle confined in a BB optical trap experiences Brownian motion and samples different phases of the standing wave, giving rise to the scatter in the CRDS measurements. It has been predicted (Butler, Miller, and Orr-Ewing Citation2007; Cotterell et al. Citation2017), and shown experimentally (Mason et al. Citation2014), that particles centered at a node or an anti-node of an intra-cavity standing wave form an envelope in σext that bounds the measured scatter. The shape of this envelope depends critically on the refractive index of the particle (Cotterell et al. Citation2015a; Cotterell et al. Citation2015b; Cotterell et al. Citation2016; Cotterell et al. Citation2017; Mason et al. Citation2015).
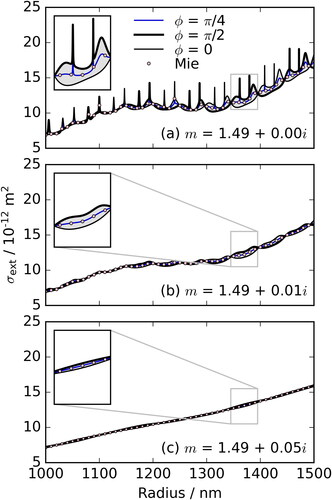
Cavity Standing Wave Generalized Lorenz-Mie theory (CSW-GLMT) allows predictions of CRDS-measured values of σext for particles with an arbitrary complex refractive index, including for light-absorbing aerosols (Cotterell et al. Citation2016). depicts the limiting cases of a node and an anti-node centered particle of evolving radius and with refractive index m = 1.49 + ki for different values of k (k = 0, 0.01, 0.05). The size-dependent variations in σext are comprised of a broad underlying interference structure and a superimposed fine ripple structure (Bohren and Huffman Citation1998; Cotterell et al. Citation2022). These interference and ripple structures are damped as the imaginary refractive index increases (see the insets in ), with higher k reducing both the amount of light passing though the particle and the finesse of the optical resonance inside the spherical aerosol particle.
Figure 1. CSW-GLMT predictions of σext values retrieved from a CRDS measurement for a spherical particle centered at a node (i.e., at the phase ϕ = 0), anti-node (ϕ = π/2), and midway between these two limits (ϕ = π/4) of the cavity standing wave field. The pink dots show corresponding Mie theory predicted values of σext. The predictions treat particles with a constant complex refractive index over the particle size range, with n = 1.49 in all calculations and k increasing from panels (a) to (c). The wavelength of the incident light is 405 nm in all the calculations.
The Bessel beam optical traps used in previous studies do not allow stable confinement of light-absorbing particles because destabilizing photophoretic forces arise when particles absorb light at the wavelength of the optical trap. Therefore, our studies using BB traps focused exclusively on non-absorbing aerosols and demonstrated that comparisons of single particle σext measurements using CRDS to predictions from CSW-GLMT facilitated accurate retrievals of n (Cotterell et al. Citation2015a; Cotterell et al. Citation2015b; Cotterell et al. Citation2016; Cotterell et al. Citation2017; Mason et al. Citation2015). Our previous assessment found that retrievals of n were accurate to within 0.014-0.1% for particles evaporating within the particle radius range 500–2000 nm (Cotterell et al. Citation2016).
Our recent use of a linear electrodynamic quadrupole (LEQ) trap allows stable levitation of both spherical and non-spherical aerosol particles (Valenzuela et al. Citation2021), and has enabled experiments to retrieve the complex refractive indices of light-absorbing aerosol particles, for which the particle composition was evolving over the measurement timescale (Cotterell et al. Citation2022; Knight et al. Citation2022). Our studies of absorbing aerosol particles have exploited the equivalence of the CSW-GLMT predicted CRDS measurements of σext for the case ϕ = π/4 and the Mie theory predicted σext for a traveling wave, as depicted in . Assuming random sampling of the cavity standing wave by the particle and that the particle size and refractive indices evolve slowly (over timescales >1 s), temporal averaging of measured σext recorded at sampling rates greater than ∼10 Hz to 1-s intervals causes the envelope in cross-sections to converge to the Mie theory limit. These time-averaged cross-sections can then be compared to Mie theory calculations to retrieve the complex refractive index. However, we are yet to report assessments of the accuracy with which complex refractive indices are retrieved for absorbing aerosols using this approach. Moreover, the dynamics of particle motion in the LEQ trap, which differ from a Bessel beam optical trap, will impact on the accuracy of complex refractive index retrievals, with these impacts requiring quantification.
Herein, we report a numerical framework to assess the accuracy of complex refractive index retrievals from CRDS measured extinction cross-sections for light-absorbing droplets levitated in an LEQ trap. Section 2 describes the experimental and numerical methods used to develop our framework for accuracy assessments. Section 3.1 describes how the assessments account for both the fundamental noise in our CRDS measurements, and the effects of particle motion in the LEQ trap. Section 3.2 discusses the accuracy of radius retrievals from concurrent phase function (i.e., angularly resolved elastic light scattering) measurements with consideration of changes in complex refractive index. Section 3.3 assesses complex refractive index retrieval accuracies for droplets with k ranging over three orders of magnitude (k ∼10−4-10−1), including for particles with either a constant complex refractive index or a complex refractive index that evolves over time. We compare the retrieval accuracies using two different algorithms. Algorithm A1 fits synthetic data for CRDS measurements (including noise levels typical of our experiments) using the CSW-GLMT approach described above. Algorithm A2 instead fits the same synthetic datasets to Mie theory after applying temporal averaging to remove the CSW scatter from the data.
2. Methods
The quantitative assessment of the accuracy of refractive index retrievals presented here involves analysis of synthetic datasets generated using chosen n and k values and incorporating the most significant sources of uncertainty inherent in our experimental measurements. Inversion of these synthetic datasets using the same methods we apply to the experimental data reveals the different contributions to uncertainties in our retrieved n and k values. Section 2.1 summarizes our experimental approach reported in previous publications for the measurement of extinction cross-sections for single particles levitated in a LEQ trap. Section 2.2 describes our numerical generation of synthetic datasets that include representations of the noise and systematic uncertainty characteristic of our experimental measurements. Section 2.3 then describes fully the two aforementioned algorithms for the retrieval of complex refractive indices from particle size-dependent σext measurements.
2.1. Measurements of σext and particle size for single aerosol particles
Our preferred approach to levitating light-absorbing aerosol particles is to stabilize the positions of charged particles in three dimensions using the dynamic electrical potential of a LEQ trap. Using this approach, we have demonstrated the ability to levitate particles of a range of absorption strengths and with diameters within the range ∼1-5 μm (Knight et al. Citation2022; Valenzuela et al. Citation2021). The LEQ is formed by four vertical cylindrical rods arranged in a square array (e.g., see Figure 2b of Cotterell et al. (Citation2022)). An AC voltage is applied to pairs of diametrically opposite rods of the LEQ trap, confining the particle in the horizontal plane. A DC voltage applied to a ring electrode, located below the particle, exerts a repulsive electrostatic force that counters the droplet weight and the drag force from a downwards propagating N2 gas flow. The particle position is monitored using an imaging camera and the DC voltage is adjusted to maintain the droplet vertical position at the center of the intracavity TEM00 mode of our cavity ring-down spectrometer.
A thorough description of our cavity ring-down spectrometer is provided in Sect. S1.6 of the online supplementary information (SI), and Figure 2 of Knight et al. (Citation2022) provides a schematic diagram of our experimental apparatus. CRDS relies on the measurement of the characteristic time (herein referred to as the ring-down time) for the mono-exponential decay of light intensity from a high finesse optical cavity. A discrete Fourier transform algorithm processes this decay trace to retrieve the ring-down time. Section S1 of the SI describes the discrete Fourier transform algorithm and assesses its performance in retrieving ring-down times, both in terms of accuracy and precision. Ring-down times are recorded at sampling rates in the range 15-30 Hz, either for the empty cavity (τ0) or for when a particle is levitated at the center of the cavity TEM00 mode (τ). These two ring-down time measurements then allow the calculation of the single particle σext using:
(1)
(1)
In EquationEquation (1)(1)
(1) , L is the cavity length (i.e., the distance between the two high reflectivity mirrors that form the cavity), w0 is the beam waist of the TEM00 mode at the location of the trapped particle, and c is the speed of light. L = 0.8 m for our cavity, while the precise value for w0 depends on the particle position along the cavity longitudinal axis and is therefore treated as a fitting parameter in our data analysis. It is important to note that the application of EquationEquation (1)
(1)
(1) for the conversion of measured ring-down times to σext assumes that the particle is located at the transverse center of the Gaussian TEM00 mode, and we explore the consequences of this assumption in Sect. 2.2.
Concurrent with the CRDS measurements, the Gaussian beam output from a 532 nm wavelength cw laser propagates vertically upwards along the center axis of our LEQ trap and is incident on the levitated particle. The angular dependence to the perpendicularly polarized elastically scattered light intensity is collected with a high numerical aperture (0.42) objective and imaged using a CMOS camera operating at a frame rate of ∼10 Hz. These light scattering measurements are recorded over the angular range of ∼68.5 − 110.5°. The resulting phase function images consist of bright and dark fringes and are processed in real time to provide one-dimensional variations in scattering intensity with angle. These variations are then averaged to a sampling rate of 1 Hz. The droplet radius is retrieved by fitting these one-dimensional variations to Mie theory, with this retrieval described thoroughly in Cotterell et al. (Citation2015b).
2.2. Generation of synthetic data for σext and particle size
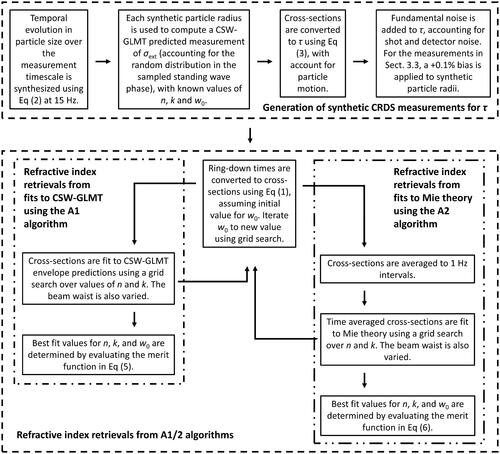
To assess the sensitivity and retrieval accuracy for the complex refractive index of aerosol particles from our single particle CRDS measurements, we generate synthetic datasets for σext and particle size. These datasets include noise commensurate with the noise sources and levels present in our experimental apparatus. The key steps in generating synthetic CRDS measurements are summarized in and are described in this section.
Figure 2. Flow diagram of the key steps taken in the process of generating synthetic CRDS measurements and fitting the synthetic datasets to retrieve n and k refractive index component values for comparison with the initially selected input values.
Here, we treat the particle size evolution for a particle containing a volatile component that evaporates steadily over time. The temporal evolution of particle size for steady-state evaporation in the continuum regime (i.e., the size range pertaining to our levitated droplets) is characterized using the Maxwell mass flux equation (Krieger, Marcolli, and Reid Citation2012). In the limit that the partial pressure of the volatile species is zero at infinite distance from the particle, as is the case in our measurements when the gas passing over the particle is composed of N2 only, the mass flux can be expressed in its integrated form in terms of the particle radius by EquationEquation (2)(2)
(2) :
(2)
(2)
in which a is the particle radius, a0 is the initial particle radius at time t = 0 s, Dij is the gas diffusion coefficient of the volatile species i in the surrounding gas phase j, Mi is the molecular weight, R is the molar gas constant, ρ is the particle density, p is the partial pressure of the volatile component at the particle surface, and T is the particle temperature. Our calculations of the evolving particle size assume the physicochemical properties of pure 1,2,6-hexanetriol (HT):
= 134.17 g mol−1;
= 1.109 g cm−3 (Grineva, Zhuravlev, and Lifanova Citation1996);
= 6.25 × 10⁻⁶ m2 s−1 (determined by Lydersen’s group contribution method (Lydersen Citation1955);
= 2 × 10⁻⁴ Pa (corresponding to the mid-value of available literature values (Cai et al. Citation2015)); and T = 298 K. We simulate particle size to the nearest nanometer (i.e., the precision of our experimental measurements) from
= 1500 nm to
= 700 nm.
From the radius versus time dataset, we use each radius value to compute a corresponding CRDS measurement of σext using CSW-GLMT for a given complex refractive index at the CRDS optical wavelength of 405 nm. This cross-section calculation requires a phase parameter (ϕ) that represents the position of the particle center with respect to the phase of the intra-cavity standing wave field. In our experimental measurements, the particle samples various phases of the cavity standing wave owing to particle motion driven by the time-varying AC voltages of the LEQ trap. Therefore, we use a random number generator to select values of ϕ between 0 and π/2, representing the limiting values for node and anti-node centering of the trapped particle, as an input to CSW-GLMT calculations for σext. We then convert this modeled cross-section to a ring-down time. However, particle motion in the transverse directions to the TEM00 mode affects the ring-down time (Walker et al. Citation2013), whereas the application of EquationEquation (1)(1)
(1) to calculate σext assumes that the particle is located at the transverse center of the TEM00 mode. EquationEquation (3)
(3)
(3) includes the effect of radial displacement (
in which x and y are the horizontal and vertical displacements respectively) from the transverse center of the TEM00 mode in our linear optical cavity (Butler, Miller, and Orr-Ewing Citation2007; Walker et al. Citation2013).
(3)
(3)
For particles in our LEQ trap, the particle motion in the horizontal direction transverse to the TEM00 mode is driven by the AC voltages, and particle trajectories may be calculated by Euler integration of the equations of motion described by the Mathieu equations (Steel and Henchman Citation1998). The derivation of the equations of motion and the corresponding particle trajectories that best represent those of a particle levitated within our LEQ trap are presented in Sect. S2 of the SI. We assume that Brownian particle motion in the vertical direction is a negligible contributor to the overall radial distance of the particle from the TEM00 mode center (i.e., y = 0 and r = x); in-focus imaging of trapped particles using a camera has shown that particle motion in the vertical direction is insignificant in contrast to driven motion in the horizontal plane.
Next, we use the simulated particle trajectories to inform our decision to approximate the particle motion as circular with an empirically calculated amplitude, A. The radial displacement is then equal to r = x = Asinθ, where θ is the angle subtended by the vector extending from the circle center to the particle position. After sufficient time, all values of θ are sampled equally and therefore this angle is distributed randomly and can be simulated using a uniform random number generator with limits between 0 and 2π. We note that this uniform random distribution in θ does not correspond to uniform random sampling of r, with particle positions far from the cavity longitudinal axis sampled up to ∼10 times more than those closest to this axis. We calculate ring-down times from the synthetic σext using EquationEquation (3)(3)
(3) and r = Asinθ, assuming representative parameters of our 405-nm single particle CRDS instrument; L = 0.8 m, w0 = 260 µm (the theoretical beam waist for our cavity (Mazurenka et al. Citation2005)), and τ0 = 30 µs. The value for A is ascertained in Sect. 3.1.2. A further 4500 data points, corresponding to an additional 5 min of ring-down times at a 15 Hz sampling rate, are added to the end of the dataset to represent measurements of τ0 when the particle falls out of the trap.
Finally, we account for the fundamental noise in our experimentally acquired ring-down times. Measured ring-down times for the empty cavity are normally distributed (e.g., see Figure S7 in the SI). The standard deviation characterizing this fundamental noise in our cavity ring-down measurements scales with the mean ring-down time in a manner consistent with the description of Huang and Lehmann, who related the effects of shot and detector noise on ring-down transient events to the standard error in the ring-down time (Huang and Lehmann Citation2009). The relative uncertainty in ring-down time (στ/τ) scales with the ring-down time according to:
(4)
(4)
in which σi/i is the ratio of the root mean square noise (σi) in the photodiode signal (in power units) to the detector power (i) at the start of the ring-down trace, and Δt is the inverse of the digitizer sampling rate. The parameter S can be assumed to be a constant provided that the digitization sampling rate and the fractional noise in the photodetector signal at the beginning of the ring-down transient event (σi/i) remain invariant during an experiment. The former assumption is always true for our experimental measurements, while the latter should be true provided that the threshold intensity at which we initiate a ring-down event is not changed; this is usually the case, but we occasionally need to adjust this threshold to lower values for large particles that extinguish a considerable amount of the intracavity power. Therefore, we can calculate S straightforwardly from empty cavity measurements of τ0, with
and then use this characterized S value to calculate the standard deviation in ring-down time arising from detector noise for other values of τ using EquationEquation (4)
(4)
(4) . Using the parameter S ascertained for our instrument (see Sect. 3.1.1), a normally distributed random number generator adds noise to synthetic datasets for τ values for an evaporating droplet. This added noise is normally distributed, and scales with the ring-down time amplitude, with a mean value of zero and a standard deviation
equal to S
consistent with EquationEquation (4)
(4)
(4) .
2.3. Retrievals of the evolving complex refractive index
We compare two approaches for the retrieval of complex refractive indices of spherical aerosol particles with a range of light-absorption strengths. summarizes the key steps in fitting synthetic CRDS measurements using these algorithms. Both approaches fit the synthetic size-dependent σext datasets (for which the input refractive indices are known) to predictions from optical models. The accuracies in the retrieved complex refractive indices are then determined from comparison of the retrieved and input refractive indices.
2.3.1. Fitting of size-dependent variations in σext to CSW-GLMT
The first retrieval algorithm described is analogous to that used in several of our previous publications (Cotterell et al. Citation2016; Cotterell et al. Citation2017; Valenzuela et al. Citation2021). The synthetic CSW-GLMT predicted CRDS measurements for ring-down time values were generated for a single or mixed-component evaporating particle. These synthetic datasets incorporated different input n and k values, and random noise and effects of particle motion were accounted for (as described above and summarized in ) to model our experimental conditions. Next, the ring-down times were converted to σext using EquationEquation (1)(1)
(1) (for an initial test value for w0, see below). The resulting size-dependent variations in σext were then fitted to CSW-GLMT predictions to determine n and k. For each particle radius, the algorithm was used to calculate σext for the two limiting cases of a node and anti-node centered particle using an initial description of the complex refractive index. In this way, a model envelope for σext was formed that should bound the measured values if the model input values for complex refractive index and beam waist were correct, and if particle motion transverse to the CRDS beam had a negligible effect on the ring-down times. The parameters describing the complex refractive index were then varied using a grid search algorithm. The value of the beam waist used to convert synthetic τ values to extinction cross-sections was also varied as a parameter in the grid search. A merit function, R, was defined by evaluating EquationEquation (5)
(5)
(5) , where the only data points (j) included were those with values of σext that resided outside the CSW-GLMT envelope.
(5)
(5)
The difference between σmeas, and σcalc, was chosen to be the difference between the synthetic data point and the closer of the CSW-GLMT predicted node or anti-node centered values at the given radius. All data points were first placed into 1 nm bins, with ρn denoting the number of the measured σext data points within a given bin. This weighting factor ρn was introduced to prevent bias of the fit to regions where the measured number of data points was high in the radius domain. Although the data point density was constant in the time domain (with a constant 15 Hz sampling rate), the particle size evolved nonlinearly with time and the density of data points in the radius domain depended on the particle evaporation rate. Finally, the merit function was normalized by J, the total number of data points outside the CSW-GLMT envelope, to account for different dataset sizes (e.g., due to evaporation over different size ranges). The parameters describing n, k, and w0 that corresponded to the minimum in R in EquationEquation (5)(5)
(5) defined the best-fit values. The representations of n and k in these fits depended on the nature of the aerosol particle being interrogated, i.e., whether the particle composition could be regarded as constant or evolving over the measurement timescale. Therefore, we defer descriptions of how n and k were represented in these fits, and the ranges input to our grid searches, to the results sections below.
2.3.2. Fitting of size-dependent variations in σext to Mie theory
A second method to retrieve the complex refractive index was to bin the synthetic CSW-GLMT predicted CRDS measurements for ring-down time values to 1-s intervals. The mean τ within those bins was then calculated and converted to σext using EquationEquation (1)(1)
(1) (for an initial test value for w0). This averaging compressed the envelope in cross-sections to the Mie theory limit for a traveling wave. Finally, a least-squares fit was performed of the resulting averaged extinction cross-sections to Mie theory predictions. Again, when generating these predictions, the parameters describing the complex refractive index were varied using a grid search algorithm. The value of the beam waist used to convert synthetic τ values to extinction cross-sections was also optimized this way. The fits were evaluated using the merit function defined by EquationEquation (6)
(6)
(6) .
(6)
(6)
In EquationEquation (6)(6)
(6) , σmeas,i was the synthetic extinction cross-section, σcalc,i was the corresponding Mie theory predicted value for a given complex refractive index, and N was the total number of data points. As with the previous algorithm, the parameters describing n, k, and w0 that correspond to the minimum in R in EquationEquation (6)
(6)
(6) defined the best-fit values. This algorithm was less time-consuming than that described in Sect. 2.3.1, as it did not require calculation of cross-sections for particles centered at both the node and anti-node of the standing wave field inside the optical cavity. Furthermore, this algorithm was simpler to implement because it required no treatment of the effects of the standing wave field in the optical cavity. The choice to use a least-squares residual instead of the least-absolute residual used in EquationEquation (5)
(5)
(5) is for computational efficiency. In contrast, the least-absolute residual in EquationEquation (5)
(5)
(5) is used to match the definition of the merit function in our previous publications (Cotterell et al. Citation2016; Cotterell et al. Citation2017; Valenzuela et al. Citation2021).
3. Results and discussion
In the following sub-sections, we implement the process summarized in to quantify the accuracy and precision of complex refractive index retrieval from CRDS measurements of single, trapped aerosol particles. We first assess the accuracy and precision in CRDS measured ring-down times for single particles levitated in our LEQ trap (Sect. 3.1), and the accuracy of particle size retrievals from phase functions recorded for light-absorbing droplets (Sect. 3.2). The retrieved S parameter for our CRDS measurements, the estimated amplitude of circular particle motion in our LEQ trap, and the errors in retrieved particle sizes are required for the generation of our synthetic datasets described in Sect. 2.2. Drawing on these assessments, Sect. 3.3 reports the generation of synthetic datasets of particle size dependent σext that fairly represent our experimental measurements, including noise levels. We then study the processing of these datasets using the A1 and A2 algorithms described in Sect. 2.3 to consider the accuracy in retrieved complex refractive indices for evaporating particles with different absorption strengths, including for particles for which the complex refractive index evolves over the measurement timescale.
3.1. Accuracy and precision of ring-down time measurements for single particles
We first quantify the fundamental noise in acquired ring-down times (Sect. 3.1.1), before assessing the impact of driven particle motion within the LEQ trap (Sect. 3.1.2).
3.1.1. Sensitivity of ring-down time measurements
To characterize the sensitivity of our ring-down time measurements, we collected τ0 values over 10 h and in the absence of a trapped particle using our 405 nm wavelength CRDS instrument, with Sect. S1.6 of the SI providing a full description of the collection and analysis of this τ0 dataset. The mean sampling rate over this period was 25.4 ± 3.3 Hz, where the uncertainty represents one standard deviation in the recorded sampling rates. A postprocessing algorithm calculated the rolling mean and standard deviation (στ) over a five second window and removed ring-down times that fell 2στ beyond the mean for each window. After filtering for anomalous points, the ring-down time data were binned to a sampling rate of 1 Hz, with the mean and standard deviation in τ0 calculated within each 1-s bin.
shows the experimentally determined τ0 values after post-processing to a 1 Hz sampling rate. The improvement in sensitivity from such averaging depends on the timescale of systematic drifts in τ relative to the averaging period, e.g., through changes in optical alignment, mirror fouling, and Rayleigh scattering contributions to extinction. Such timescale assessments are provided by our Allan deviation analysis, which demonstrates that our cavity is stable over averaging times up to 100 s (see Sect. S1.6 of the SI). Variations on longer timescales are likely caused by changes in the Rayleigh scattering of N2 as the ambient temperature and pressure of our laboratory fluctuate during the daytime, with Sect. S1.7 of the SI exploring the expected impacts of Rayleigh scattering on our measurements. Nonetheless, the ∼100 s integration times demonstrate the excellent stability of our CRDS instrument. However, we need to balance the optimal averaging time for the most sensitive ring-down time measurements with the typical variations that occur during measurements on aerosols due to changes in the particle extinction cross-section. Our experience shows that detectable cross-section changes during particle evaporation or hygroscopic response occur on timescales as short as 1 s (for example, during the fast evaporation of a glycerol droplet) (Mason et al. Citation2015).
Figure 3. (a) Experimental CRDS measurements of ring-down time for an empty cavity recorded at a mean sampling rate of 25.4 ± 3.3 Hz. The ring-down times have been processed to remove anomalous data points (see main text) before binning to a sampling rate of 1 Hz. (b) The corresponding standard deviation in τ0 within a 1-s data bin.
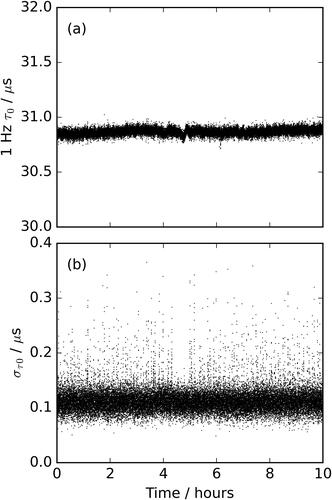
The average of the 1-s precision in τ0 over the measurement period (i.e., the mean of the standard deviation values plotted in ) was στ = 0.113 µs, corresponding to στ/τ = 3.67 × 10⁻³ (i.e., a precision of 0.37%) and an S parameter of 2.04 × 10⁻² µs1/2. In the SI (Sect. S1), we report a numerical framework for estimating a priori the expected sensitivity level. Briefly, this framework involves Monte Carlo simulations of ∼105 ring-down transient events that are simulated using the same parameters as our CRDS measurements (record length, τ0, digitizer sampling rate and vertical resolution, and ring-down trace voltage amplitude). Noise is superimposed on the simulated transient events to match that in measured traces. These simulated transient events are then digitized to a 12-bit vertical resolution and the ring-down time is retrieved using the same discrete Fourier transform algorithm exploited in our instrument data processing. The theoretical sensitivity limit estimated in our analysis indicates an expected sensitivity parameter of S = 0.306 × 10⁻² µs1/2 (στ/τ = 0.55 × 10⁻³, i.e., 0.055% precision). The 7-fold discrepancy between measured and predicted values for στ and S indicates fluctuations in either the sample extinction coefficient (i.e., changes in the Rayleigh scattering coefficient for the N2 sample filling our optical cavity) and/or changes in the optical alignment on 1-s timescales. Reasons for changes in the optical alignment can include changes in the laser pointing stability, fluctuations in the mode properties of the laser and phase noise leading to frequency fluctuations that map into amplitude fluctuations in the intracavity light intensity (Morville et al. Citation2002).
3.1.2. Impacts of particle motion on the accuracy and precision in σext
Particle motion transverse to the light-field inside the optical cavity affects the interaction of light with the particle because of the Gaussian intensity profile of the incident beam. Therefore, it was important to determine the trajectory and amplitude of particle motion to account for the impact on the accuracy and precision in measured σext during generation of the synthetic CRDS measurement datasets. For particles isolated in the BB optical trap that formed the basis of our previous studies (Cotterell et al. Citation2015b; Cotterell et al. Citation2017; Mason et al. Citation2014), particle motion is Brownian. The BB core diameter of ∼5 µm corresponds to a maximum value for the displacement r of ∼2.5 µm. However, the electric field distribution for our LEQ trap suggests scope for much larger particle motions of up to ∼1 mm (see Figure 2 of Valenzuela et al. (Citation2021)). Particle motion in our LEQ trap is driven by the AC potentials of the quadrupole rods and thus a particle trajectory can be predicted by numerical integration (following the Euler method) of the equations of motion, which are described by the Mathieu equation (Steel and Henchman Citation1998). Section S2 of the SI describes this integration and the resulting simulated trajectories of aerosol particles injected into our LEQ trap. For our experimental parameters (geometry of the quadrupole, voltage and frequency applied to the rods, and particle charge-to-mass ratio) the motion of the particle largely traces an ellipse. However, Newton’s second law dictates that a particle’s trajectory depends on its mass, and the particle motion becomes more complex as changes to its charge-to-mass ratio lead to its eventual expulsion from the LEQ trap.
The Mathieu stability diagram plots regions of experimental parameter space that give stable particle trajectories for our LEQ trap. Despite our ability to model particle trajectories, our simulations did not accurately predict the minimum particle size (and hence mass) that may be levitated in our trapping cell. This uncertainty in the position within the stability diagram means we were unable to predict a theoretical particle trajectory accurately given a particle size. Similarly, the simulations predicted that the amplitude of particle motion depends strongly on the initial position and velocity of the particle within the electric field. Therefore, to generate the ring-down time datasets that, in addition to the fundamental noise effects described above, include the effect of transverse motion with respect to the TEM00 mode center, we approximated the particle motion in our LEQ trapping cell as circular. An estimate for the amplitude of this assumed circular motion was then retrieved empirically via comparison of the synthetic ring-down times to measurements from our previous publication (Knight et al. Citation2022).
To estimate the amplitude of the circular motion for a particle needed in our generations of synthetic CRDS data, we must first quantify the noise in a typical experimentally measured dataset. Using a measurement from our most recent publication describing the application of our LEQ trap, we calculated the ratio of the standard deviation in the experimental extinction cross-section to the mean σext (i.e., Δσext/σext) over a 10 data point rolling window. Performing this relative noise characterization helped to mitigate against the impact of the sharp ripple structure in the size-dependence of σext which would otherwise broaden the measured cross-section distribution. We then took the rolling minimum in the calculated Δσext/σext over a 100 second window to mitigate against the confounding further impacts of the ripple structure, and therefore identified the underlying contour in Δσext/σext. This rolling minimum in relative uncertainty is plotted in Figure S15 of the SI and demonstrates that the noise contribution from driven motion of the particle in the LEQ is approximately twice as high as that when a particle is more tightly confined within our BB optical trap.
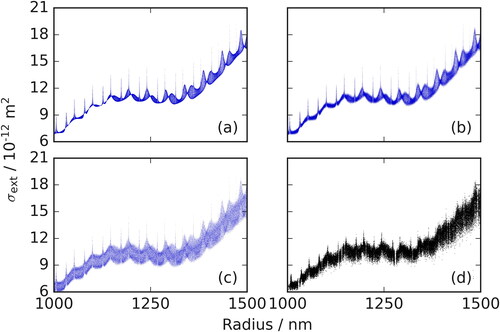
For simulated data describing CRDS measurement of particles levitated in our LEQ trap, we optimized the amplitude A of circular motion, transverse to the TEM00 mode center, until the mean value for the rolling minimum in Δσext/σext for the synthetic dataset was equal to that for the mean value of the corresponding experimental data plus one standard deviation. We chose this conservative value for the experimental data because the rolling minimum in Δσext/σext varied non-linearly with particle radius (see Figure S15 of the SI). Such non-linearity could be caused by changes in particle trajectory with particle mass, as predicted by our simulations of particle motion. The optimal value for A was ∼68 µm. shows the calculated size dependence to the CSW-GLMT extinction cross-section (including the effects of random sampling of the intracavity standing wave phase), for a particle with m = 1.4906 + 0i held by a LEQ within a 405-nm CRDS probe beam. depict the same cross-sections as in but incorporate the effects of fundamental noise, and fundamental noise plus particle motion transverse to the longitudinal symmetry axis of the cavity, respectively. Comparison of show that the σext determinations by CRDS are biased to lower values by the transverse motion of the particle, caused by the particle moving away from the center of the Gaussian TEM00 mode profile of the intra-cavity beam (Walker et al. Citation2013). An experimentally measured dataset for pure HT (m405 ∼ 1.4906 + 0i) is shown in for comparison.
Figure 4. (a) CSW-GLMT prediction for a CRDS measured size-dependent variation in σext for an evaporating particle with m405 = 1.4906 + 0i. (b) The same data as in (a), but with the effects of fundamental ring-down time noise superimposed. (c) The same data as in (a), but with the effects of fundamental noise and particle motion superimposed. (d) Experimental σext measurements for an evaporating pure HT droplet with m405 ∼ 1.4906 + 0i.
3.2. Particle size retrieval uncertainties from phase function measurements
Analysis of CRDS data for the time-evolving extinction cross-section of a trapped single particle relies on accurate particle sizing using phase functions measured by elastic light scattering. Particle size was retrieved from phase functions in our previous experimental measurements for absorbing particles (comprised of internal mixtures of nigrosin dye with HT) by assuming k = 0 at the 532-nm phase function illumination wavelength (Knight et al. Citation2022). Combining knowledge of k for the separate components in these mixtures with physically based effective medium approximations, the true k in these previous experiments was estimated to have reached values up to ∼0.01 at the 532 nm wavelength of the elastic light scattering measurements. We surmised that the particle radius was accurately determined at these absorption strengths under the assumption k = 0 due to the accord between the resonance positions in the extinction ripple structure of experimental data and best-fit Mie theory curves for size-dependent variations in σext. Moreover, these previous fits allowed a multiplicative correction factor to the particle radius data to be included as a fit variable. These best-fit scale factors did not exceed ±0.36%, corresponding to an absolute radius correction of up to 5.4 nm for our measurement size range.
We also assessed a priori the expected impact of setting k = 0 on the accuracy of retrieved particle radii from measured phase functions for light-absorbing droplets. For brevity, details of our radii retrieval accuracy assessments, for which the particle was assumed to be non-absorbing at the phase-function measurement wavelength, are deferred to Sect. S3 of the SI. However, the results agree with our initial assumption that particle radius is accurately obtained for weakly absorbing particles. Indeed, for particles with k∼0.002, the particle radius was retrieved to a mean accuracy of better than 7 nm. In agreement with these assessments, our experimental studies on droplets with corresponding absorption strengths applied a maximum correction to retrieved radii values of up to 5.4 nm (Knight et al. Citation2022). The multiplicative scale factor applied when processing extinction cross-section versus size data appears to correct for the radius bias as our measured vs Mie spectra are in good agreement (e.g., see Figure 2 of Knight et al. (Citation2022)). However, residual differences of up to ∼1.5 nm persist. Therefore, for the assessments in the remainder of this work, we apply a multiplicative scale factor of +0.1%, corresponding to a radius bias of up to +1.5 nm. Our technique should allow a wide range of atmospherically relevant aerosol species to be interrogated, assuming the particle of interest does not absorb strongly over the entire visible spectrum, with black carbon a notable exception (for which k > 0.1; Bond and Bergstrom (Citation2006)).
We recognize that our assessments here consider particles evaporating over the radius range ∼1500-700 nm only. The particle sizing accuracy would benefit from interrogating particles at larger size parameters, which would provide more features in measured phase functions to constrain the retrieval of the particle size. However, the increases in particle size expected to be necessary for significant improvements to the sizing accuracy would likely involve particles that are too large to probe using CRDS, with particle radii greater than ∼3 micrometers increasing the ring-down decay to a rate that we cannot digitize and fit.
3.3. Accuracy and precision in complex refractive index retrievals
We now consider the analysis of synthetic CRDS datasets to derive complex refractive index values. Section 3.3.1 compares two retrieval algorithms described in Section 2.3: (A1) fits synthetic CRDS measurement datasets for size-dependent variations in σext to CSW-GLMT; and (A2) fits synthetic CRDS measurement datasets for size-dependent variations in σext to Mie theory after averaging to a 1 Hz sampling rate. These assessments were made for particles with a constant complex refractive index throughout evaporation and demonstrate the superior performance of the A2 algorithm. Then, Sect. 3.3.2 quantifies the retrieval accuracies for aerosol particles with evolving complex refractive indices using the A2 retrieval algorithm only. The synthetic CRDS measurement datasets were generated with account for the uncertainties in our experimental ring-down time measurements (S parameter; Sect. 3.1.1) and the impact of particle motion (Sect. 3.1.2). Additionally, drawing from our conclusions from Sect. 3.2, a + 0.1% radius bias was applied to the synthetic datasets to model any residual uncertainty in retrieved particle size.
3.3.1. Light-absorbing droplets with a constant complex refractive index
Here, CRDS measurements are modeled for particles with a range of different absorption strengths, but for which the complex refractive index did not vary over time. Size-dependent variations in CSW-GLMT predicted CRDS measurements for τ were generated using the methods described in Sect. 2.2. These synthetic ring-down times incorporated the effects of fundamental noise and particle motion in the LEQ trap, using the characterizations of cavity noise and particle motion described in Sect. 3.1.1 and 3.1.2, respectively. Nine synthetic datasets were generated with input complex refractive indices of m405 = 1.4906 + ki with k taking values within the set {0, 0.001, 0.002, 0.004, 0.008, 0.016, 0.032, 0.064, 0.128}. For the case of the A1 algorithm, these synthetic τ were converted to the corresponding σext using EquationEquation (1)(1)
(1) and fitted to CSW-GLMT predictions that represent the limiting cases for a particle positioned at a node or an anti-node of the intra-cavity field, following the procedure described in Sect. 2.3.1. In contrast, our A2 algorithm first averaged the synthetic τ measurements (recorded at a sampling rate of 15 Hz) to a 1 Hz sampling rate. The ring-down times were then converted to cross-sections using EquationEquation (1)
(1)
(1) and were subsequently fitted to Mie theory predictions, as described in Sect. 2.3.2.
For both such fittings (i.e., when using the A1 and A2 algorithms) it was important to account for the accuracy and precision in retrieved particle radii from our phase function measurements. In the treatment of our previously reported experimental measurements, particle radii were determined to the nearest nanometer and a multiplicative correction factor was varied during the fittings to account for any residual uncertainty (Knight et al. Citation2022). Following the assessment in Sect. 3.2, systematic errors in retrieved particle radii (that cannot be accounted for by a multiplicative scale factor when fitting the measured size dependent cross-section distributions) are up to ±0.1% of the true particle size. Therefore, prior to fitting to predictions a radius bias of +0.1% was applied to the radii in our synthetic datasets, corresponding to a maximum radius bias of +1.5 nm. Subsequent fits to CRDS measurement predictions allowed assessment of the retrieval accuracies of both components of the complex refractive index, n and k that incorporated uncertainties in the particle radii and ring-down time measurements.
The absolute errors and
in the retrieved n and k, respectively, were calculated using the equations:
(7)
(7)
(8)
(8)
in which
and
were the retrieved refractive indices from a synthetic dataset, and
and
were the values input to the generation of the synthetic data. The A1 algorithm was applied using a grid search over n and k with a step size of 0.0001. Meanwhile, the A2 algorithm was applied using a step size of 0.0001 for n and 0.00001 for k, as the former step size for the imaginary component of the refractive index was too large to resolve the emergence of local minima in the merit function defined by EquationEquation (6)
(6)
(6) . The beam waist was also varied, with a step size of 0.1 µm for both algorithms. shows examples of the processed synthetic datasets for size-dependent variations in σext using the A1 and A2 algorithms, with the best-fit predictions provided. The corresponding contour plots depicting the merit functions are also presented. The red dots indicate the minimum in the retrieved merit functions. The minimum merit functions cannot be directly compared because the functions are defined differently (see Sect. 2.3).
Figure 5. Synthetic datasets for size-dependent variations in σext for which kin = 0.008. The synthesized cross-sections (black points) are compared with the best-fit CSW-GLMT envelope in (a) (red and blue lines), while the cross-sections in (b) have been averaged to 1 Hz and are accompanied by the best-fit Mie theory prediction (red line). The corresponding contour plots depicting the merit functions are provided below the size-dependent cross-section in (c) and (d). The red dots indicate the minimum in the retrieved merit functions.
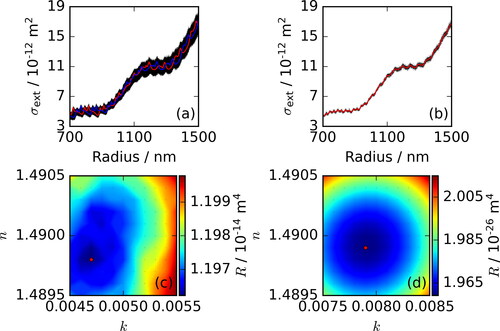
The quantitative assessments of the retrieval accuracy are plotted in as a function of the kin. Both algorithms retrieved nr to an accuracy ∼0.002 or better for droplet absorption strengths kin < 0.128. However, (and
) for kin = 0.128 tended to a value greater than 100% for the A1 algorithm, with no clear optimum value obtained. The A2 algorithm retrieved kr to an accuracy superior to that of A1 for all the absorption strengths evaluated; for many values of kin,
values were over an order of magnitude lower when using the A2 algorithm. Furthermore, comparison of the contour plots showing how the merit functions for both algorithms varied with n and k (see Figures S21–S41 of the SI) revealed that the precision of the A2 algorithm was superior to that of the A1 algorithm. The A2 algorithm consistently retrieved a single well-defined minimum in the merit function, whereas several local minima were often found when using the A1 algorithm (see ). The accuracy of real refractive index retrievals from the A2 algorithm degraded as kin decreased to values below 0.016 but remained better than 0.2%. Similarly, the real refractive index retrieval accuracy degraded as kin increased to values >0.064. To explain these results, we note that the retrieval accuracy for n and k depends in a complex way on the magnitudes of n and k. For particles that absorb incident light weakly, the ripple structure in the measured particle size-dependent variations in σext is sharp and the refractive index retrievals are sensitive to any bias in the particle size. However, these retrieval accuracies are also worsened if the particle absorbs incident light strongly, damping the ripple structure significantly and thereby providing fewer features to constrain the retrieved n and k. It is difficult to assess, without performing further extensive simulations, whether benefit would be gained from operating in different size parameter ranges. Nonetheless, the stable levitation and sizing of particles with radii approaching values below ∼500 nm represents a barrier to performing measurements in the accumulation mode regime, while particles with radii > 2-3 micrometers will increase the ring-down decay to a rate that we cannot digitize and fit.
Figure 6. The absolute errors in the retrieved n and k from a fit of σext values extracted from analysis of synthetic CRDS measurements for a size-evolving particle to either our CSW-GLMT algorithm (A1; black dots) or a Mie theory algorithm (A2; blue diamonds). The generation of synthetic datasets used a complex refractive index of m405=1.4906 + ki for different values of kin as specified in the main text.
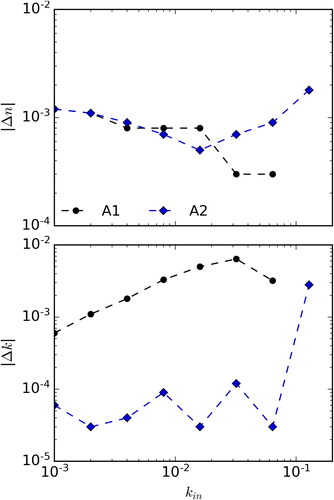
The accuracy of the imaginary refractive index retrievals from the A2 algorithm was better than ∼0.0001 for all absorption strengths studied, except for when kin = 0.128. As with the real refractive index retrievals, this loss of accuracy was thought to arise from the featureless size-dependent variation in σext at these very high particle absorption strengths. Given the greatly improved accuracy of the imaginary refractive indices obtained when using the A2 algorithm, our further assessments of refractive index retrieval accuracies for droplets with varying n and k during evaporation focus exclusively on the performance of the A2 algorithm.
3.3.2. Light-absorbing droplets with a size-dependent complex refractive index
The complex refractive indices of particles of interest often evolve during measurements, such as for the studies reported in (Knight et al. Citation2022). In this previous publication, we considered evaporating droplets comprised of semi-volatile non-absorbing HT internally mixed with small concentrations of involatile light-absorbing nigrosin dye. The n and k values depended on the particle size and were parameterized in terms of particle radius. Here, we tested the accuracy of retrievals of the size-dependent refractive index in such experiments. Synthetic size-dependent variations in τ were generated for aerosol particles with a particle size-dependent complex refractive index, accounting for the effects of fundamental detector noise and particle motion on measured ring-down times and radius biases of +0.1% in the same way as described in Sect. 3.3.1. The evolving real refractive index was described by the equation:
(9)
(9)
in which n0 was 1.4906 (i.e., the real refractive index for HT at the 405-nm wavelength) and n1 was a constant to be found by the A2 retrieval algorithm (Cotterell et al. Citation2015b). The evolving imaginary refractive index was described by:
(10)
(10)
in which B was a constant to be determined by the A2 retrieval algorithm (Knight et al. Citation2022). Eight datasets were synthesized following the method described in Sect. 2.2, with different input values of n1 and B. We chose to set n1 = B, with these two parameters taking values of 0, 1 × 10⁻²¹, 2 × 10⁻²¹, 4 × 10⁻²¹, 8 × 10⁻²¹, 1.6 × 10⁻²⁰, 3.2 × 10⁻²⁰ and 6.4 × 10⁻²⁰ m3. The generated τ (recorded at a sampling rate of 15 Hz) were averaged to a 1 Hz sampling rate and converted to σext using EquationEquation (1)
(1)
(1) . The best-fit values of n1 and B were then retrieved from our A2 algorithm using a grid search that initially spanned a large range of values (orders of magnitude larger than the input values), before sequential reduction to allow retrievals to the nearest 1 × 10⁻²³ m3. The value for the CRDS beam waist that was used to convert synthetic τ values to extinction cross-sections was also varied during the retrievals, with a best-fit w0 retrieved to 0.1 μm precision.
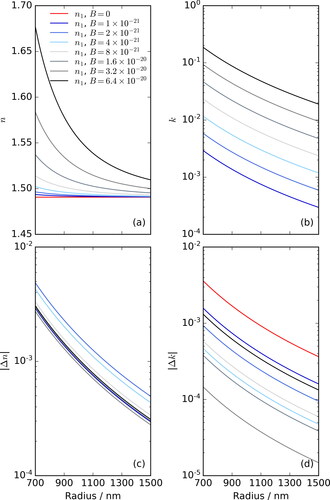
presents the true (input) evolving refractive indices as a function of particle radius and the corresponding absolute differences between the retrieved and input refractive indices. The trend was for accuracy in the retrieved k values to improve with increasing absorption strength for input B ≤ 3.2 × 10⁻²⁰ m3. The accuracy of the retrieved k degraded as B increased from 3.2 × 10⁻²⁰ m3 to 6.4 × 10⁻²⁰ m3, with the size-dependent variations in σext becoming progressively featureless toward such high absorption strengths. Almost all k values were retrieved to an accuracy better than ∼0.002. All n values were retrieved to an accuracy better than 0.005 (∼0.3%). For n1 = B = 0, the value of n1 was obtained exactly, so the corresponding solid line is not visible in .
Figure 7. Evolving complex refractive index as a function of particle size. Panels (a-b) show the particle size-dependent refractive index values calculated from EquationEquations (9)–Equation(10)(10)
(10) using the input n1 and B values in the legend. Panels (c-d) show the corresponding absolute differences between the values retrieved from fits to synthetic CRDS datasets and the input refractive index values as a function of particle size. Note that the curve for n1 = B = 0 is not visible in panel (b) as k = 0 for all radii and is out of range of the logarithmic vertical scale. For n1 = B = 0, the value of n1 is retrieved exactly and so the corresponding solid line in not visible in .
The absolute errors in n and k calculated here improve over retrievals from Mie resonance spectroscopy (see and S11 of Price, Preston, and Davies (Citation2022)), while the range of measurable aerosol absorption strengths extends into the region consistent with BrC aerosol, which is yet to be demonstrated by photophoretic spectroscopy techniques (for which current experimental measurements explore the range 10−5 ≤ k ≤ 10−4; (Bluvshtein, Krieger, and Peter Citation2020)). Valenzuela et al. estimated that the uncertainty in the value of k must be <0.001 to reduce uncertainties in radiative forcing efficiencies for BrC to below 5% (Valenzuela et al. Citation2018). Although we are currently limited to particle radii >500 nm, below which particles cannot currently be isolated stably in our LEQ trap, our assessments suggest that for the size range available to us and over the range of absorption strengths most relevant for BrC species (0.01 < k < 0.05), we meet these previously specified requirements (Valenzuela et al. Citation2018; Zarzana, Cappa, and Tolbert Citation2014). Corresponding assessments in which no radius bias is applied (see Table S2 of the SI) predict that the uncertainty can be reduced, often by an order of magnitude or greater, if improvements can be implemented to retrieve particle radii with an accuracy of ≤ 1 nm. In comparison, the uncertainty that propagates from fluctuations in τ caused by particle motion is negligible. To explain this observation, we suggest that uncertainty propagation from particle motion may be mitigated by ring-down time averaging and by treating the beam waist as a parameter in fits to synthetic cross-section datasets.
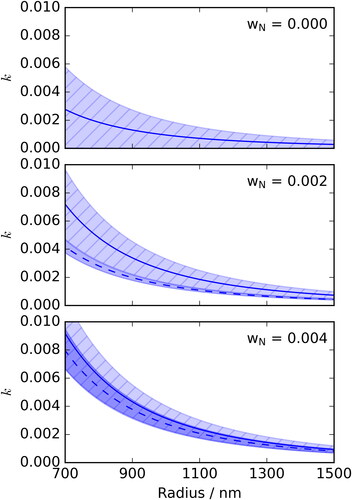
We now compare the results of these accuracy assessments to our experimentally retrieved complex refractive indices (Knight et al. Citation2022). The size-dependent variations in σext evaluated here were generated with the input aerosol and physiochemical properties for pure HT, and for droplets comprised of mixtures of HT and a small fraction of nigrosin with mass ratios relevant to the measurements reported in our previous work (Knight et al. Citation2022). shows the retrieved imaginary refractive indices from our experimental measurements reported in Figure 3 of our previous publication (solid lines; Knight et al. (Citation2022)). The uncertainty envelopes (hashed fill) on these retrievals account for the particle size-dependent accuracy as estimated by our assessments described above, as well as the standard deviations in the retrieved k from repeat measurements that represent particle-to-particle variability. Also shown in are the expected size-dependent k from physically based mixing rule models (dashed lines), as described in Knight et al. (Citation2022). The uncertainty envelopes for these model predictions (solid fill) incorporate the effects of uncertainties in optical properties of the pure component species comprising the droplets and the physicochemical properties of the particle including the initial particle size of the generated droplet and its effective density (see Knight et al. (Citation2022) for full details of these uncertainty calculations). Our previous publication has shown that our n retrievals consistently fall within the expectations of our mixing rule model predictions and therefore focuses on the assessment of k retrievals only. The maximum absolute difference between mixing rule predicted and experimentally retrieved k for a non-absorbing particle (k = 0) is ∼0.0025. For the two absorbing droplets, as the mass fraction of nigrosin increases (corresponding to an increase in n1 and B from 0.63 × 10⁻²¹ to 1.25 × 10⁻²¹ and 1.34 × 10⁻²¹ to 2.67 × 10⁻²¹ m3, respectively) the uncertainty in the retrieved k reduces. This trend is reflected in as the measured and modeled k begin to converge.
Figure 8. Experimentally determined k values from our previous publication (Knight et al. Citation2022) complete with corresponding uncertainty envelopes determined from the current study (solid lines and hashed fill, respectively). These values are compared to modeled k values from a physically based mixing rule (dashed line), accompanied by the associated uncertainty envelope (solid fill). wN represents the mass fraction of nigrosin that is contained within the initial binary HT-nigrosin droplet.
4. Conclusions
We have assessed the accuracy of complex refractive index retrievals from measurements using our single particle CRDS instrument, accounting for the recent introduction of an LEQ trap that provides controlled levitation of light-absorbing particles inside a cavity ring-down spectrometer for the first time. We show that the considerable amplitude of driven particle motion in our LEQ (with the oscillation amplitude assessed to be ∼68 µm) is the dominant source of noise in our σext measurements. This deduction is in contrast with the study of non-absorbing particles levitated in our BB trap, for which the effects of particle motion are negligible in comparison to the fundamental noise of the cavity ring-down time measurements. We also assess the accuracy of particle radii determinations from phase function measurements and the impact on refractive index retrievals from single-particle CRDS data. Despite imposition of the simplifying constraint in our fits that k = 0 at the 532 nm wavelength used for phase-function collection, our assessments show only small biases in retrieved radii of <7 nm for weakly absorbing trapped particles with k < 0.002. This result is in agreement with our experimental measurements; the largest applied radius correction factor from our most recent publication corresponds to a maximum radius correction of 5.4 nm for particles with k reaching values of ∼0.01 (Knight et al. Citation2022).
Two algorithms (denoted A1 and A2; see ) for assessing the accuracy of complex refractive index retrievals from σext measurements are presented and compared. The A1 algorithm fits size-dependent variation in σext values extracted from synthetic CRDS datasets incorporating experimental noise to CSW-GLMT predictions which account for the standing wave light-field inside the optical cavity. In contrast, the A2 algorithm averages the σext values to a 1 Hz sampling rate, compressing the envelope in cross-sections to the Mie theory limit for a traveling wave. The cross-sections are then fitted to Mie theory predictions. Our experience shows that the computational time for the A2 algorithm is 2-3 times less than that for the A1 algorithm because of the smaller number of calculations of the Mie scattering coefficients required to predict cross-sections. Furthermore, the A2 algorithm is easier to implement, requiring no treatment of the effects of the standing wave field in the optical cavity. For particles with a constant refractive index but evolving particle size, the two algorithms retrieved n with similar uncertainties. However, k was retrieved by the A2 algorithm to a greater accuracy than that from the A1 algorithm for all particle absorption strengths assessed (k∼10−4–10−1). For particles with evolving complex refractive indices, the A2 algorithm retrieved n with an accuracy better than 0.005 over the range of absorption strengths examined. Additionally, k was retrieved to an accuracy better than 0.002 for almost all absorption strengths considered, except when the structure in the size-dependent variations in σext was lost (B > ∼6.4 × 10⁻²⁰ m3). The uncertainties in retrieved refractive indices were dominated by those in the particle radii as determined from phase function measurements. If systematic errors in the particle radius could be eliminated, the accuracies in the retrieved refractive indices would be improved by approximately an order of magnitude (see Table S2 of the SI).
The accurate determination of evolving complex refractive indices for levitated aerosol particles demonstrated here is critical for further application of our instrument to study the optical properties of atmospheric aerosol particles throughout their lifetimes. Such particles are known to undergo physicochemical processing through, for example, photolysis, hydrolysis, and oxidation. The kinetics of reactions occurring in mesoscale aerosol particles are reported to be accelerated relative to rates of reactions in macroscopic, beaker-scale solutions (Yan, Bain, and Cooks Citation2016), and our novel single-particle CRDS instrument may provide a platform to distinguish the contributions of various aerosol microphysical properties to this reaction acceleration. While the work reported here shows that changes in n and k, which are directly connected to particle composition, are resolved accurately, further gains will derive from improvements to the accuracy with which particle size is determined and to the algorithms used to optimize the fitting of evolving n and k. Moreover, the analysis in this work is restricted to homogeneous spherical particles, but further effort is needed to address extinction measurements for non-spherical and inhomogeneous particles.
Supplemental Material
Download PDF (5 MB)Acknowledgments
We thank Rui Wang and Joanna Egan for their contributions to discussions about the treatment and analysis of single particle CRDS data.
Declaration of interests statement
The authors declare that they have no conflict of interest.
Data availability
Data are available at the University of Bristol data repository at https://doi.org/10.5523/bris.d96t2awnjxck2psl65m4wxzkx
Additional information
Funding
References
- Bain, A., and T. C. Preston. 2019. Mie scattering from strongly absorbing airborne particles in a photophoretic trap. J. Appl. Phys. 125 (9):093101. doi:10.1063/1.5082157.
- Bikkina, S., and M. Sarin. 2019. Brown carbon in the continental outflow to the north indian ocean. Environ. Sci. Process. Impacts 21 (6):970–87. doi:10.1039/C9EM00089E.
- Bluvshtein, N., U. K. Krieger, and T. Peter. 2020. Photophoretic spectroscopy in atmospheric chemistry – high-sensitivity measurements of light absorption by a single particle. Atmos. Meas. Tech. 13 (6):3191–203. doi:10.5194/amt-13-3191-2020.
- Bluvshtein, N., P. Lin, J. M. Flores, L. Segev, Y. Mazar, E. Tas, G. Snider, C. Weagle, S. S. Brown, A. Laskin, et al. 2017. Broadband optical properties of biomass-burning aerosol and identification of brown carbon chromophores. J. Geophys. Res. Atmos. 122 (10):5441–56. doi:10.1002/2016JD026230.
- Bohren, C. F., and D. R. Huffman. 1998. Absorption and scattering of light by small particles. New York: Wiley.
- Bond, T. C., and R. W. Bergstrom. 2006. Light absorption by carbonaceous particles: An investigative review. Aerosol Sci. Technol. 40 (1):27–67. doi:10.1080/02786820500421521.
- Butler, T. J., D. Mellon, J. Kim, J. Litman, and A. J. Orr-Ewing. 2009. Optical-feedback cavity ring-down spectroscopy measurements of extinction by aerosol particles. J. Phys. Chem. A 113 (16):3963–72. doi:10.1021/jp810310b.
- Butler, T. J., J. L. Miller, and A. J. Orr-Ewing. 2007. Cavity ring-down spectroscopy measurements of single aerosol particle extinction. I. The effect of position of a particle within the laser beam on extinction. J. Chem. Phys. 126 (17):174302. doi:10.1063/1.2723735.
- Cai, C., D. J. Stewart, J. P. Reid, Y-h Zhang, P. Ohm, C. S. Dutcher, and S. L. Clegg. 2015. Organic component vapor pressures and hygroscopicities of aqueous aerosol measured by optical tweezers. J. Phys. Chem. A 119 (4):704–18. doi:10.1021/jp510525r.
- Carter, T. S., C. L. Heald, C. D. Cappa, J. H. Kroll, T. L. Campos, H. Coe, M. I. Cotterell, N. W. Davies, D. K. Farmer, C. Fox, et al. 2021. Investigating carbonaceous aerosol and its absorption properties from fires in the western United States (we-can) and southern Africa (oracles and clarify). JGR. Atmos. 126 (15):e2021JD034984. doi:10.1029/2021JD034984.
- Cotterell, M., T. Preston, B. Mason, A. Orr-Ewing, and J. Reid. 2015a. Extinction cross section measurements for a single optically trapped particle. In Optical Trapping and Optical Micromanipulation XII. SPIE. doi:10.1117/12.2189174.
- Cotterell, M. I., J. W. Knight, J. P. Reid, and A. J. Orr-Ewing. 2022. Accurate measurement of the optical properties of single aerosol particles using cavity ring-down spectroscopy. J. Phys. Chem. A 126 (17):2619–31. doi:10.1021/acs.jpca.2c01246.
- Cotterell, M. I., B. J. Mason, T. C. Preston, A. J. Orr-Ewing, and J. P. Reid. 2015b. Optical extinction efficiency measurements on fine and accumulation mode aerosol using single particle cavity ring-down spectroscopy. Phys. Chem. Chem. Phys. 17 (24):15843–56. doi:10.1039/C5CP00252D.
- Cotterell, M. I., T. C. Preston, A. J. Orr-Ewing, and J. P. Reid. 2016. Assessing the accuracy of complex refractive index retrievals from single aerosol particle cavity ring-down spectroscopy. Aerosol Sci. Technol. 50 (10):1077–95. doi:10.1080/02786826.2016.1219691.
- Cotterell, M. I., K. Szpek, J. M. Haywood, and J. M. Langridge. 2020. Sensitivity and accuracy of refractive index retrievals from measured extinction and absorption cross sections for mobility-selected internally mixed light absorbing aerosols. Aerosol Sci. Technol. 54 (9):1034–57. doi:10.1080/02786826.2020.1757034.
- Cotterell, M. I., R. E. Willoughby, B. R. Bzdek, A. J. Orr-Ewing, and J. P. Reid. 2017. A complete parameterisation of the relative humidity and wavelength dependence of the refractive index of hygroscopic inorganic aerosol particles. Atmos. Chem. Phys. 17 (16):9837–51. doi:10.5194/acp-17-9837-2017.
- Feng, Y., V. Ramanathan, and V. R. Kotamarthi. 2013. Brown carbon: A significant atmospheric absorber of solar radiation? Atmos. Chem. Phys. 13 (17):8607–21. doi:10.5194/acp-13-8607-2013.
- Grineva, O. V., V. I. Zhuravlev, and N. V. Lifanova. 1996. Densities and dielectric permittivities of four polyhydric alcohols. J. Chem. Eng. Data 41 (2):155–7. doi:10.1021/je950076o.
- Huang, H., and K. K. Lehmann. 2009. Noise caused by a finite extinction ratio of the light modulator in cw cavity ring-down spectroscopy. Appl. Phys. B 94 (2):355–66. doi:10.1007/s00340-008-3293-y.
- Knight, J. W., J. V. Egan, A. J. Orr-Ewing, and M. I. Cotterell. 2022. Direct spectroscopic quantification of the absorption and scattering properties for single aerosol particles. J. Phys. Chem. A 126 (9):1571–7. doi:10.1021/acs.jpca.2c00532.
- Krieger, U. K., C. Marcolli, and J. P. Reid. 2012. Exploring the complexity of aerosol particle properties and processes using single particle techniques. Chem. Soc. Rev. 41 (19):6631–62. doi:10.1039/C2CS35082C.
- Lin, G., J. E. Penner, M. G. Flanner, S. Sillman, L. Xu, and C. Zhou. 2014. Radiative forcing of organic aerosol in the atmosphere and on snow: Effects of soa and brown carbon. J. Geophys. Res. Atmos. 119 (12):7453–76. doi:10.1002/2013JD021186.
- Liu, Y., and P. H. Daum. 2008. Relationship of refractive index to mass density and self-consistency of mixing rules for multicomponent mixtures like ambient aerosols. J. Aerosol Sci. 39 (11):974–86. doi:10.1016/j.jaerosci.2008.06.006.
- Lydersen, A. L. 1955. Estimation of critical properties of organic compounds by the method of group contributions. Madison: University of Wisconsin, College of Engineering.
- Mason, B. J., J. S. Walker, J. P. Reid, and A. J. Orr-Ewing. 2014. Deviations from plane-wave mie scattering and precise retrieval of refractive index for a single spherical particle in an optical cavity. J. Phys. Chem. A 118 (11):2083–8. doi:10.1021/jp5014863.
- Mason, B. J., M. I. Cotterell, T. C. Preston, A. J. Orr-Ewing, and J. P. Reid. 2015. Direct measurements of the optical cross sections and refractive indices of individual volatile and hygroscopic aerosol particles. J. Phys. Chem. A 119 (22):5701–13. doi:10.1021/acs.jpca.5b00435.
- Mason, B. J., S.-J. King, R. E. H. Miles, K. M. Manfred, A. M. J. Rickards, J. Kim, J. P. Reid, and A. J. Orr-Ewing. 2012. Comparison of the accuracy of aerosol refractive index measurements from single particle and ensemble techniques. J. Phys. Chem. A 116 (33):8547–56. doi:10.1021/jp3049668.
- Masson-Delmotte, V., P. Zhai, A. Pirani, S. L. Connors, C. Péan, S. Berger, N. Caud, Y. Chen, L. Goldfarb, M. I. Gomis, et al. 2021. Summary for policymakers. In Climate change 2021: The physical science basis. Contribution of working group i to the sixth assessment report of the intergovernmental panel on climate change, ed. K. Leitzell, E. Lonnoy, J. B. R. Matthews, T. K. Maycock, T. Waterfield, O. Yelekçi, R. Yu, and B. Zhou, 3–32. Cambridge, UK: Cambridge University Press.
- Mazurenka, M., A. J. Orr-Ewing, R. Peverall, and G. A. D. Ritchie. 2005. 4 cavity ring-down and cavity enhanced spectroscopy using diode lasers. Annu. Rep. Prog. Chem, Sect. C 101:100–42. doi:10.1039/b408909j.
- Miles, R. E. H., S. Rudić, A. J. Orr-Ewing, and J. P. Reid. 2011. Sources of error and uncertainty in the use of cavity ring down spectroscopy to measure aerosol optical properties. Aerosol Sci. Technol. 45 (11):1360–75. doi:10.1080/02786826.2011.596170.
- Moosmüller, H., R. K. Chakrabarty, and W. P. Arnott. 2009. Aerosol light absorption and its measurement: A review. J. Quant. Spectrosc. Radiat. Transf. 110 (11):844–78. doi:10.1016/j.jqsrt.2009.02.035.
- Morville, J., D. Romanini, M. Chenevier, and A. Kachanov. 2002. Effects of laser phase noise on the injection of a high-finesse cavity. Appl. Opt. 41 (33):6980–90. doi:10.1364/AO.41.006980.
- Price, C. L., T. C. Preston, and J. F. Davies. 2022. Hygroscopic growth, phase morphology, and optical properties of model aqueous brown carbon aerosol. Environ. Sci. Technol. 56 (7):3941–51. doi:10.1021/acs.est.1c07356.
- Ramanathan, V., and G. Carmichael. 2008. Global and regional climate changes due to black carbon. Nature Geosci. 1 (4):221–7. doi:10.1038/ngeo156.
- Steel, C., and M. J. Henchman. 1998. Understanding the quadrupole mass filter through computer simulation. J. Chem. Educ. 75 (8):1049–54. doi. doi:10.1021/ed075p1049.
- Valenzuela, A., F. Chu, A. E. Haddrell, M. I. Cotterell, J. S. Walker, A. J. Orr-Ewing, and J. P. Reid. 2021. Optical interrogation of single levitated droplets in a linear quadrupole trap by cavity ring-down spectroscopy. J. Phys. Chem. A 125 (1):394–405. doi:10.1021/acs.jpca.0c09213.
- Valenzuela, A., J. P. Reid, B. R. Bzdek, and A. J. Orr-Ewing. 2018. Accuracy required in measurements of refractive index and hygroscopic response to reduce uncertainties in estimates of aerosol radiative forcing efficiency. J. Geophys. Res. Atmos. 123 (12):6469–86. doi:10.1029/2018JD028365.
- Walker, J. S., A. E. Carruthers, A. J. Orr-Ewing, and J. P. Reid. 2013. Measurements of light extinction by single aerosol particles. J. Phys. Chem. Lett. 4 (10):1748–52. doi:10.1021/jz4008068.
- Wu, H., J. W. Taylor, J. M. Langridge, C. Yu, J. D. Allan, K. Szpek, M. I. Cotterell, P. I. Williams, M. Flynn, P. Barker, et al. 2021. Rapid transformation of ambient absorbing aerosols from west african biomass burning. Atmos. Chem. Phys. 21 (12):9417–40. doi:10.5194/acp-21-9417-2021.
- Yan, X., R. M. Bain, and R. G. Cooks. 2016. Organic reactions in microdroplets: Reaction acceleration revealed by mass spectrometry. Angew. Chem. Int. Ed. Engl. 55 (42):12960–72. doi:10.1002/anie.201602270.
- Zarzana, K. J., C. D. Cappa, and M. A. Tolbert. 2014. Sensitivity of aerosol refractive index retrievals using optical spectroscopy. Aerosol Sci. Technol. 48 (11):1133–44. doi:10.1080/02786826.2014.963498.