
 ?Mathematical formulae have been encoded as MathML and are displayed in this HTML version using MathJax in order to improve their display. Uncheck the box to turn MathJax off. This feature requires Javascript. Click on a formula to zoom.
Abstract
Aerosols hygroscopic growth is of current interest due to its effect on atmospheric light scattering and extinction. Knowledge of hygroscopic properties is essential for predicting the effect of aerosol on cloud formation, regional visibility, climate impact, and lung deposition. Previous studies have used surrogate components of complex aerosol; and the application to complex multi-component aerosol like biomass burning aerosol is limited. We report aerosol hygroscopicity parameter of biomass burning aerosol derived from Eucalyptus and cow dung in a humidified smog chamber using two techniques: (1) measuring extinction hygroscopic enhancement factor f(RH) of aerosol using a cavity ring down spectrometer and deriving the hygroscopicity parameter using empirical equations and (2) directly using a Cloud Condensation Nuclei Counter (CCNC). Based on repeated measurements of the same fuel under different burning conditions, quantified by the modified combustion efficiency (MCE), we found that aerosol hygroscopicity depends on both fuel types and to some extent on burning conditions. For similar MCE, cow dung has a consistently larger value of hygroscopicity compared to Eucalyptus. Hygroscopicity measurements ranged from 0.024 to 0.577 for MCE measurements that ranged from 0.73 to 0.99. Specifically, sub-saturated hygroscopicity parameter values for cow dung are 0.024–0.131 and Eucalyptus are 0.012–0.300, while supersaturated hygroscopicity parameter values for cow dung are 0.071–0.577 and Eucalyptus are 0.021–0.494. There is a clear increase in hygroscopicity with increasing MCE for supersaturated cow dung measurements using CCNC but the dependence of kappa on MCE is generally inconclusive.
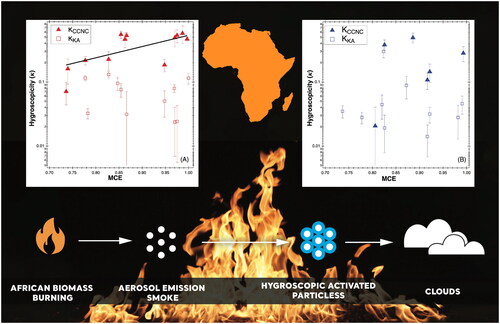
Graphical Abstract
Editor:
1. Introduction
Biomass burning (BB) emissions have a major impact on air quality, human health, and climate (Andreae Citation2019). BB is a primary source of particulate matter and trace gases in the global atmosphere (Andreae Citation2019; Bond et al. Citation2013), estimated at annual emissions of 1.6–4.1 Pg of CO2, 11–53 Tg CH4, and 0.1–0.3 Tg of N2O (Barker et al. Citation2020). BB aerosol directly affects regional and global radiative forcing by absorbing and scattering solar radiation and indirectly affects the energy balance by modulating cloud properties, cloud lifetime, and precipitation (Cecchini et al. Citation2017; Hamilton et al. Citation2018; Sato and Suzuki Citation2019; Thornhill et al. Citation2018). How aerosol hygroscopicity is represented in climate models is one potential source of uncertainty, since hygroscopicity is dependent on fuel type and burning conditions (Hamilton et al. Citation2018).
Burning conditions, quantified using the modified combustion efficiency (MCE), has a known effect on aerosol chemical, physicochemical, and optical properties. Flaming-dominated combustion emissions produce more absorbing aerosol and have single scattering albedo values in the range of 0.29 to 0.44 (Liu et al. Citation2013; Smith et al. Citation2020). Smoldering-dominated combustion emissions produce more scattering aerosol that have single scattering albedos in the range of 0.66 to 0.77 (Liu et al. Citation2013; Smith et al. Citation2020). Fuel moisture can additionally change the burning conditions as moisture in the fuel can elongate the smoldering stage of the burn and shorten the flaming stage, which ultimately causes a less efficient burn than that of dry fuel (Chen et al. Citation2010). Fuel with more moisture has been shown to increase emissions of incompletely oxidized carbon (e.g., CO) and nitrogen (e.g., NH3) species (Chen et al. Citation2010).
Burning conditions impact the hygroscopicity of BB aerosol, which in turn influences their radiative forcing. Hygroscopicity is a key parameter for assessing aerosol effects on radiative forcing, visibility, and the global energy budget (Farmer, Cappa, and Kreidenweis Citation2015; Kreidenweis et al. Citation2005; Kreidenweis and Asa-Awuku Citation2014; McFiggans et al. Citation2006; Petters and Kreidenweis Citation2007; Reutter et al. Citation2009), where their optical properties are altered by changing the particle size (Brock et al. Citation2016; Cheng et al. Citation2008; Eichler et al. Citation2008; Haarig et al. Citation2017; Hand and Malm Citation2007; Liu et al. Citation2013; Titos et al. Citation2016).
Multiple techniques exist to measure aerosol hygroscopic growth (Tang et al. Citation2019). However, few studies directly compared optical subsaturated growth to supersaturated cloud condensation nuclei (CCN) measurements (Patel and Jiang Citation2021). Previous studies measured the enhancement of scattering or extinction due to water uptake (Fierz-Schmidhauser et al. Citation2010; Zieger et al. Citation2013), or by the change in the particle size described by a hygroscopic growth factor (Swietlicki et al. Citation2008). Previous BB subsaturated and supersaturated water-uptake studies used common Western United States and Asian fuels (Carrico et al. Citation2008; Clarke et al. Citation2004; Gomez et al. Citation2018; Martin et al. Citation2013; Ng et al. Citation2017; Rose et al. Citation2011).
To our knowledge, few studies have directly explored the influence of African BB fuels on droplet activation. Royer et al. (Citation2022) studied the long-range transport of African smoke to the tropical marine boundary layer and used size-resolved aerosol chemical composition data to predict a single hygroscopicity parameter, κ. Kacarab et al. (Citation2020) collected data in the NASA ObseRvations of Aerosols above CLouds and their intEractionS (ORACLES) aircraft study to measure CCN concentration, aerosol size distribution, and vertical updraft near and around the marine boundary layer and determined droplet formation sensitivity to aerosol concentration and the hygroscopicity parameter. Both studies found that African BB was hygroscopic and contributed to cloud formation. However, the BB fuels and burn conditions in these studies were not characterized.
Only a few studies have measured the BB cloud droplet formation for specific fuels under specific burn conditions (Engelhart et al. Citation2012; Giordano et al. Citation2013; Petters et al. Citation2009); however, these studies did not often examine African BB fuels. Li et al. (Citation2016) looked at 5 different fuels (Wheat, Corn Straw, Rice Straw, Cotton Residue, Soybean Residue) with an average MCE of 0.92 and utilized a hygroscopic tandem differential mobility analyzer (HTDMA) with a RH of 80% and obtained an average -hygroscopicity value of 0.25. Using the same technique again, Li et al. (Citation2015) examined wheat at MCE > 0.9 and obtained a
-hygroscopicity value of 0.27. Lewis et al. (Citation2009) examined three biomass fuels (Pine, Chamise and Saw Palmetto) commonly found in western and Southeastern United States; all burned at MCE > 0.9 and were measured by a HTDMA of 95% RH to obtain
-hygroscopicity values between 0.2–0.7. Petters et al. (Citation2009) had an extensive study of 24 different North American biomass fuels, with MCE > 0.9 and used both a HTDMA at 89% RH and CCN measurements to obtain a wide range of
-hygroscopicity values ranging from 0.06 to 0.7. Giordano et al. (Citation2013) used Scanning Mobility CCN analysis (SMCA) measurements to observe Chamise and Manzanita (common North American plants) burning with MCE > 0.98 and found
-hygroscopicity values between 0.1–0.24. Engelhart et al. (Citation2012), who examined 12 biomass fuels with MCE > 0.9 and SMCA measurements, found
-hygroscopicity values ranging from 0.06–0.6. Dusek et al. (Citation2011) used Oak (a common North American wood) and Musasa (a tree originating from Zimbabwe) at MCE > 0.9 and SMCA measurements to find
-hygroscopicity values of 0.05–0.2. Rose et al. (Citation2011) used SMCA measurements to examine an agricultural fire located in Guangzhou, China and found the
-hygroscopicity values to be 0.1–0.6. Rissler et al. (Citation2006) examined aerosol of an amazon fire with HDTMA at 90% RH and found the sub-saturated
-hygroscopicity values to be 0.03–0.07. Martin et al. (Citation2013) investigating burning experiments of Beech wood in a smog chamber with a HTDMA and a cloud condensation nuclei counter (CCNC) found the
-hygroscopicity values to range between 0.2–0.4. Gomez et al. (Citation2018) conducted a controlled laboratory study in which they used a variety of North American fuels to determine hygroscopicity (
-hygroscopicity values ranged between ∼0–1.8) of the fuels they studied. However, they only characterized the dependence on fuel type but did not extend the analysis quantitatively to the influence of MCE on hygroscopicity. It is important to note that the previously mentioned studies were tested under dry conditions and particles were often size selected in sub-saturated and supersaturated regimes to determine particle growth. In summary, there is a vast range of reported hygroscopicity values determined in the MCE range for flaming-dominated and transition region combustion, as shown in (Li et al. Citation2016; Pokhrel et al. Citation2020) and summarized in . Few BB hygroscopicity values are reported for MCE < 0.9, corresponding to smoldering-dominated burn conditions.
Table 1. Summary of past studies measuring hygroscopicity values in smoke from the burning of various fuels under different burning conditions.
The global BB aerosol burden had been observed to be primarily from Africa at ∼52% (van der Werf et al. Citation2010). African BB has a complex mixture of savanna fires and domestic fires (Laris et al. Citation2021). In 2018, ∼900 million people in sub-Saharan Africa relied on solid fuels like wood, charcoal, animal dung, and crop residue as their main energy source (IEA Citation2020). It is predicted that the population of Africa will be 40% of the global population by 2100 (UN Citation2017); the contribution of the aforementioned African BB will likely increase with the rapid population increases predicted on the continent. Despite being the largest BB contributor, studies on African BB emission are new and very limited (Eck et al. Citation2003; Flamant et al. Citation2018; Haywood et al. Citation2021; Laris et al. Citation2021; Redemann et al. Citation2021; Vakkari et al. Citation2014). Most climate models and emission inventories used for Africa are based on North American, European, and Asian emission data (Bond et al. Citation2013; Lamarque et al. Citation2010; Streets et al. Citation2004). Thus, the lack of African fuel representation in the literature has led to a significant gap in scientific knowledge.
In this study, laboratory experiments of a common sub-Saharan biomass fuel, Eucalyptus, and locally obtained cow dung were conducted by generating aerosols by burning them in a tube furnace, as previously described (Pokhrel et al. Citation2020; Smith et al. Citation2019; Smith et al. Citation2020). Dried cow dung is a widely used fuel in sub-Saharan Africa and several cultures in developing countries and is lit to provide heat and a flame for cooking. We determine the aerosol hygroscopicity of these two fuels over a wide range of MCE values. A humidified smog chamber simulated a tropical environment where the relative humidity (RH) was varied between 0–90%. In regions classified as tropical wet and dry/savanna climate (Kottek et al. Citation2006) outside the equatorial zone, RH varies between 20% and 40% during the dry season. Where wildfires are along the equator, there is little seasonality and RH is 60–80% year-round. Only a few studies have compared hygroscopicity obtained with extinction measurements using a cavity ring-down spectrometer (CRDS) to other methods (Brock et al. Citation2016; Dawson et al. Citation2020). Both Dawson et al. (Citation2020) and Brock et al. (Citation2016) used the extinction enhancement factor f(RH) measurements to derive the hygroscopicity parameter. In this work, we report the influence of burning conditions on the single-hygroscopicity factor (κ) using fresh aerosol emissions from Eucalyptus (African biomass fuel) and local cow dung burning and conduct closure studies where we derive the hygroscopicity parameter by two approaches: κ from extinction enhancement measurements f(RH, αext) using a CRDS (Kreidenweis and Asa-Awuku Citation2014) and results of κ directly determined using a CCNC.
2. Experimental methods
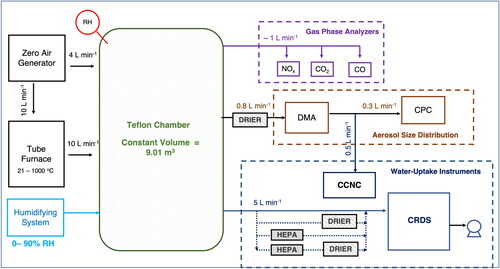
The experimental set-up for this study is shown in . Fuels were burned in a tube furnace and introduced into a 9 m3 Teflon environmental chamber. The set-up has been used previously to study the emissions and aging of biomass fuels (Pokhrel et al. Citation2016; Pokhrel et al. Citation2020, Citation2021; Smith et al. Citation2019). Here, we briefly describe fuel burning conditions, chamber humidification, optical extinction measurement, and a CCN measurement.
Figure 1. Experimental set-up. A table of experiments and experimental conditions is provided in the supplementary material (Table S1).
2.1. Burning samples and conditions
We burned Eucalyptus and cow dung under a variety of burning conditions, as quantified by MCE. Eucalyptus is a fuel for domestic use in Africa (Beyene and Koch Citation2013) and was obtained from Ethiopia. Cow dung was obtained from a farm in New Orleans, Louisiana. Our fuels were dried by storing them in a fume hood for over a year and had a moisture content below 10% (Pokhrel et al. Citation2020). A mass of 0.07 to 1.50 g of the fuels were burned in a tube furnace (Carbolite Gero, HST120300-120SN). Biomass fuels were placed in a quartz boat (AdValue Technology, FQ-BT-03) and the tube furnace was pre-heated to the desired temperature, ranging between 500–800 °C. Then, the fuels were placed in the center of the pre-heated tube. Particle-free filtered air (Aadco Instruments, 747-30) was introduced to the furnace at 10 L min−1 with a calibrated mass flow controller (MFC, Sierra Instruments). All aerosol and gases produced from combustion passed through a cyclone (URG, URG-2000-30ENS-1) to select particles smaller than 2.5 μm before they were introduced to the Teflon chamber.
CO2 and CO emissions were measured from all burns to determine the MCE. The MCE is the ratio of the change in CO2 to the sum of the changes in carbon monoxide (ΔCO) and carbon dioxide (ΔCO2) released during combustion. ΔCO and ΔCO2 denote changes in the respective gas concentration with respect to pre- and post-ignition of a fuel sample. Thus, the MCE is defined as
(1)
(1)
In this study, measured MCE values ranged from smoldering-dominated (MCE = 0.73) to flaming-dominated combustion (MCE = 0.99) (Pokhrel et al. Citation2020). MCE for smoldering conditions, MCE = 0.73 were achieved with a lower furnace temperature of 450 °C. MCE for flaming conditions, MCE = 0.99 were achieved with a temperature of 800 °C. A table of the performed experiments is provided in the supplementary material (SI, Table S1).
2.2. Chamber conditions and humidification
The indoor environmental chamber was operated at a constant volume. The constant volume was held under positive pressure to minimize the flow of contaminated room air into the system. The environmental chamber was first filled with particle free filtered air. A mixing fan was turned on at the time of combustion and left on for ∼10–15 min after aerosols were emitted into the chamber. Steady state was achieved, and the chamber was well mixed after ∼45 min from the time of combustion. The chamber had a constant flow of 4 L min−1 of zero air to offset the constant sample flowrates of the instruments (Smith et al. Citation2019).
The chamber was humidified by flowing particle-free air through a customized bubbler (Quark Glass) containing ∼400 mL of deionized, American Society for Testing and Materials (ASTM) type II water, which had < 50 ppb of total organic carbon. The bubbler setup included a round bottom flask heated by a heating mantle (Chemglass, CG-10000-07), powered by an analogue controller (Chemglass, CG-15005-01), followed by a short length of insulated Teflon tubing attached to the chamber. This heated bubbler was attached periodically when changes in RH were desired and resulted in ∼2% RH changes when vapor was introduced for 2–3 min.
2.3. Gas-phase composition and aerosol size distribution
The chamber allowed for multiple aerosol and gas species to be sampled. This included NOx (Thermo Scientific™ 42iQ NO-NO2-NOx Analyzer), CO (Thermo Scientific™ 48iQ Carbon Monoxide Analyzer), and CO2 (Thermo Scientific™ 410iQ Carbon Dioxide Gas Analyzer). The aerosol size distribution was measured with a Scanning Mobility Particle Sizer (SMPS). Specifically, aerosol was passed through a 710 µm impactor inlet (3.8 μm particle diameter cut point), then charged with a Kr-85 neutralizer (TSI model 3081) in the Long Differential Mobility Analyzer (DMA, TSI model 3080). The aerosol number concentration was measured using a water-based condensation particle counter (WCPC) (TSI model 3788).
2.4. Cavity ring down spectroscopy hygroscopicity measurements
Aerosol sampled from the chamber entered a ring-down cavity (170 cm long, stainless steel, ½" OD) and the aerosol light extinction was measured at 550 nm. The laser components of the system included a Continuum Surelite I-20 Nd:YAG laser running at 20 Hz. The 355-nm beam pumped an optical parametric oscillator (OPO) laser. Additional details of the CRDS and set-up are described in our previous work (Singh et al. Citation2014; Singh, Fiddler, and Bililign Citation2016; Smith et al. Citation2019). The CRDS was operated under four different conditions to subtract background and calculate the change in ringdown time. Each condition was conducted for approximately three minutes and rotated through for each RH measurement. Specifically, (a) whole chamber air was sampled, (b) air was sampled via a drier (water vapor was removed), (c) air was sampled via a drier and a high efficiency particle air (HEPA) filter (water vapor and particles were removed), and (d) air was sampled via a HEPA filter (particles were removed). Extinction measurements were taken at 0% RH, 40% RH, and then several measurements between 78–92% RH. Zero and 40% RH measurements are representative of dry conditions (as defined by the World Meteorological Organization (WMO Citation2016)).
We provide here the key equations for the extinction measurement using a CRDS (Moosmüller, Varma, and Arnott Citation2005; Strawa et al. Citation2006; Smith et al. Citation2019; Thompson, Smith, and Winefordner Citation2002; Thompson et al. Citation2008). Briefly, the extinction coefficient αext (m−1) is defined as
(2)
(2)
where cair is the speed of light in air and RL is the ratio of mirror-to-mirror distance to the length of the cavity, resulting in a unitless value >1. There is an exponential decay of light exiting the cavity and the time needed to drop to 1/e of the initial intensity is called the ring-down time. The extinction coefficient can be calculated from the ring-down time in the presence (τ) and absence (τ0) of sample. The extinction enhancement factor, f(RH) is defined as the ratio between the
measured at different RH values.
2.5. Cloud condensation nuclei counter (CCNC) measurements and analysis
The water uptake of Eucalyptus and cow dung were investigated at two different supersaturations (0.7 and 1.0%) using a CCNC (Droplet Measurement Technologies)—a technique that has been widely used and described in previous literature (Malek et al. Citation2022; Moore, Nenes, and Medina Citation2010; Roberts and Nenes Citation2005). The CCNC instrument supersaturation was calibrated with ammonium sulfate, and the results of the calibration are provided in SI Table S2. The aerosol particles from the environmental chamber were dried to < 5% RH using multiple diffusion dryers. The dried particles were then passed to a DMA to produce a distribution of charged particles (Wiedensohler Citation1988). The monodisperse aerosol exited the DMA in two simultaneous streams. One stream (∼0.3 L/min) flowed into the WCPC—where particle concentration (CN) was measured, while the other stream (∼0.5 L/min) flowed into the CCNC—where the concentration of activated particles (CCN) was measured.
Data analysis was performed using SMCA methods (Moore, Nenes, and Medina Citation2010). The SMCA is done by plotting the activated fraction versus dry diameters at each supersaturation. After the SMCA performs a charge correction on the data, removing multiply charged particles (Moore, Nenes, and Medina Citation2010; Wiedensohler Citation1988), a sigmoid was fitted through the activation fraction, and the critical activation diameter (Dd) was obtained. Dd represents the point at which 50% of the particles are activated at a constant supersaturation. For each supersaturation, the process was repeated 10 times, and the average Dd and standard deviation were reported.
3. Droplet growth and hygroscopicity theory
Hygroscopic growth and activation of atmospheric aerosol can be described by Köhler theory that connects water vapor saturation to droplet diameter as follows (Petters and Kreidenweis Citation2007) EquationEquation (3)(3)
(3) :
(3)
(3)
where S is the equilibrium saturation ratio of water, αw is the water activity of the droplet solution, Mw is the molecular mass of water, σs/a is the surface tension at the droplet air interface, R is the ideal gas constant, D is the droplet diameter, and ρw is the density of liquid water at temperature, T.
Köhler theory postulates that there are two factors that contribute to droplet growth—(i) the solute or the Raoult’s effect and (ii) the curvature or the Kelvin effect. Both control the equilibrium vapor pressure of water above a liquid surface. The Köhler equation describes not only the CCN activation under supersaturated conditions but can also be applied to hygroscopic growth under subsaturated conditions. Petters and Kreidenweis (Citation2007) proposed a single hygroscopicity parameter, κ, representation based on particle dry diameter and droplet growth. κ-values have been useful in describing and predicting the CCN activity and hygroscopicity of single components and aerosol mixtures (Farmer, Cappa, and Kreidenweis Citation2015), and the parameterization of κ-hygroscopicity values has been used extensively in cloud modeling studies (Chang et al. Citation2010; Pringle et al. Citation2010; Reutter et al. Citation2009; Spracklen et al. Citation2008). κ-hygroscopicity values have been used to investigate water uptake, CCN activity, and the chemical composition of atmospheric aerosol (Wang et al. Citation2017). κ-hygroscopicity values can also be determined from hygroscopic growth data measured by hygroscopic tandem differential mobility analysis or extinction and scattering measurements at high and low RH f(RH) (Tang et al. Citation2019). Fewer studies have determined κ-hygroscopicity values from extinction measurements (Beaver et al. Citation2008; Brock et al. Citation2016; Dawson et al. Citation2020).
In this work κ-hygroscopicity values can be derived from measured CCN and optical parameters with three different methods. The single κ-hygroscopicity value derived from CCN measurements κCCNC is determined using EquationEquation (4)(4)
(4) (Petters and Kreidenweis Citation2007):
(4)
(4)
where s is the supersaturation and s = S − 1, Dd is the activation diameter, and other variables are already defined.
The single κ-hygroscopicity value derived from optical measurements was calculated with two empirical equations. Kreidenweis and Asa-Awuku (Citation2014) proposed the following relationship for κ-hygroscopicity with f(RH = 80%) as
(5)
(5)
The relationship has been applied to soluble species such as ammonium sulfate (Kreidenweis and Asa-Awuku Citation2014) and soluble sugars (Dawson et al. Citation2020) and has been shown to agree well with subsaturated HTDMA derived κ-hygroscopicity values. Brock et al. (Citation2016) also provided an empirical relationship for extinction measurements as follows
(6)
(6)
It should be noted that EquationEquation (6)(6)
(6) when applied to particle sizes > 100 nm is assumed to ignore the effects of curvature for water-soluble aerosol. κ-hygroscopicity derived from EquationEquation (6)
(6)
(6) agreed well with field measurements of aged continental aerosol size distributions, organic-rich compositions (background to very polluted), from the boundary layer to the free troposphere (Brock et al. Citation2016); moreover, the fit was not good for sea-salt or dust as the parametrization of EquationEquation (6)
(6)
(6) is not applicable for these particles. κ-hygroscopicity derived from EquationEquations (5)
(5)
(5) and Equation(6)
(6)
(6) were applied to polydisperse aerosol sampled from the chamber (). These hygroscopicity models are based on the aerosol physicochemical properties that include solute mass, molecular weight, bulk density, dissociable ions, and activity coefficients. Köhler theory models inorganic compounds effectively, but it is known that most combustion particles are multi-component systems. EquationEquations (4)–Equation(6)
(6)
(6) have yet to be directly compared in the literature, particularly for complex aerosol from biomass burning sources.
4. Results and discussion
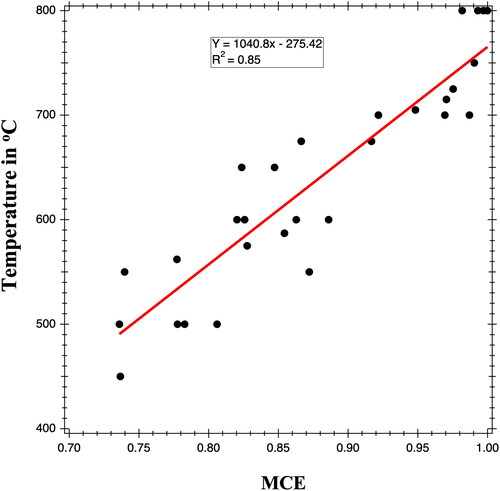
This study was able to capture a wide range of MCE values (∼0.7–1.0) using a tube furnace for conducting the combustion. Data from all the experiments show that the MCE is directly proportional to the furnace set temperature, as shown in .
Figure 2. Furnace temperature vs. MCE for all experiments.
The estimated sub-saturated hygroscopicity values for cow dung and Eucalyptus range between 0.01 and 0.3. Specifically, the average sub-saturated κKA for cow dung and Eucalyptus (for all MCEs) is 0.07 ± 0.04 and 0.06 ± 0.08, respectively (). Few studies have explored the influence of combustion condition on hygroscopicity. Specifically, Gomez et al. (Citation2018) reported subsaturated hygroscopicity values for fuels ignited with four burning techniques; κKA ranged from ∼0.01 to ∼0.27 and are consistent with subsaturated values reported here for both cow dung and Eucalyptus. Although MCE was not explicitly measured, Gomez et al. (Citation2018), found that fuel type exhibited a greater influence on κ-hygroscopicity values than combustion conditions. In this work, subsaturated hygroscopicity values also do not change as significantly with MCE as the supersaturated hygroscopicity values () and fuel type modifies the overall average sub-saturated κ-hygroscopicity values (κKA). Cow dung has an estimated κKA larger than Eucalyptus and the hygroscopicity values are consistent with the work of Gomez et al. (Citation2018), who used fuels native to North America.
Figure 3. Comparison of κKA (small open squares, extinction-based measurements) and κCCNC (large, closed triangles, CCN measurements) as a function of MCE for (a) cow dung and (b) Eucalyptus. Dashed lines show the sub-saturated measurement trends, and the solid lines show the supersaturated measurement trends. Note, the y-axis is plotted on a log scale to help visually enhance trends in κKA.
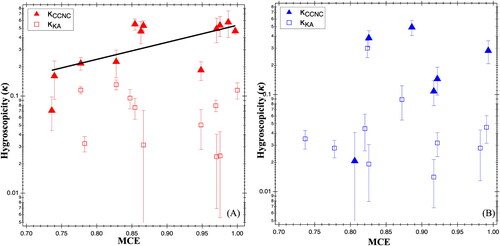
However, supersaturated hygroscopicity values are larger than subsaturated values (). The relationships of supersaturated cow dung measurements have an R2 value of 0.692, and a P-value of 0.01, which means that there is only a 1% likelihood that the observed trend is by chance. Therefore, the dependence of hygroscopicity on MCE is statistically significant for the cow dung measurements using CCNC. The subsaturated cow dung measurements and both Eucalyptus measurements do not show a conclusive relationship, since their R2 values are poor, and the slopes of their fit lines are not statistically different from zero. In , there are intermediate to low κCCNC values (0.1 > κCCNC > 0.3) for cow dung emissions with MCE < ∼0.80. Above MCE > 0.95, κCCNC values peak at 0.57; considerably higher than low MCE cow dung emissions. Between MCE > ∼0.8 and < 0.95, the κCCNC values increase to an average of 0.44. At MCE ∼ 0.95 κCCNC drops to 0.2. This value is an outlier in the data and inconclusive. A similar trend is seen in for Eucalyptus. κCCNC values are less than 0.1 at low MCE, and in the intermediate MCE range (between 0.80 and 0.90) κCCNC values increase to ∼0.5. Values then decrease to ∼0.1 around MCE ∼0.95 and again appear to increase as the MCE approaches 1. In general, most laboratory (Carrico et al. Citation2008; Dawson et al. Citation2016; Dusek et al. Citation2011; Hansen et al. Citation2015; Massoli et al. Citation2010) and field measurements (Bougiatioti et al. Citation2016; Cerully et al. Citation2011; Kim et al. Citation2016; Wu et al. Citation2013) showed that κCCNC is usually larger than κ derived from f(RH). For all the data presented in , the CCNC and extinction measurements were done independently.
shows data where CRDS and CCNC measurements were taken simultaneously. confirms that supersaturated measurements for smoke emitted from burning cow dung and Eucalyptus during the same experiments are consistently higher than subsaturated CRDS hygroscopicity estimates. These higher values seen in the supersaturated measurements can be attributed to dissolution assumptions in Köhler theory, which assumes that the solute instantaneously dissolves in the droplet.
Figure 4. Box and whisker plots of the comparison of (CRDS extinction-based measurements) and
(CCNC measurements) obtained by simultaneous measurements of cow dung (red) and Eucalyptus (blue). Boxes represent the interquartile range from 25 to 75%, with whiskers representing the max and min for the data. The line inside the box is the median. Each data point is marked by a black open circle. The solid black lines are ranges of
found in different studies. The studies on the left side (light green) are supersaturation studies, the studies on the right (dark green) are subsaturated experiments, and the studies in the middle conducted both sub-saturation and supersaturation measurements.
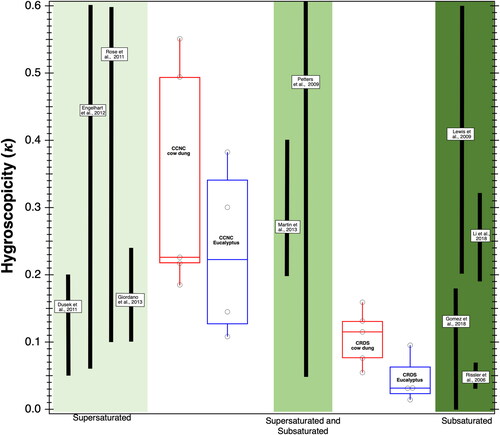
Furthermore, the range of hygroscopicity measured under supersaturated conditions shows greater variation than that measured in subsaturated conditions. also shows that fuel type is a factor in the hygroscopicity, as observed in previous studies, since cow dung has a larger hygroscopicity (both super and sub-saturated) than Eucalyptus. In this study, cow dung has consistently larger -hygroscopicity values than Eucalyptus, suggesting that cow dung is more effective at cloud seeding than other fuels. shows that values found in this study compare well to those of other studies. The discrepancy between reported kappa values at the sub and supersaturated levels is well known (Gohil et al. Citation2022; Lee et al. Citation2022; Malek et al. Citation2022). Specifically, Lee et al. attribute these differences to a variation in aerosol organic solubility. Additionally, the discrepancies in measured hygroscopicity can be accounted for if adsorption processes are also considered in water-uptake (Gohil et al. Citation2022; Malek et al. Citation2022; Pajunoja et al. Citation2015).
The κ-hygroscopicity values reported in were derived from EquationEquation (5)(5)
(5) and are directly compared to the κ-hygroscopicity values derived from Brock et al. (EquationEquation (6)
(6)
(6) ). These equations are applied to polydisperse aerosol and both methods estimate similar kappa values (Figure S1). The agreement between both methods suggests that EquationEquation (5)
(5)
(5) approximates similar values of aerosol bulk hygroscopicity across the particle size distribution. Brock et al. (Citation2016) showed that this polydisperse estimate was like that derived from monodisperse hygroscopicity measurements with the CRDS. Thus, the agreement of the two models here also suggests that both equations can be used interchangeably to estimate the subsaturated
-hygroscopicity values of polydisperse BB aerosol from CRDS measurement.
5. Summary and conclusions
In this study we determined the hygroscopicity of BB aerosol derived from African biomass fuels combusted at different burning conditions. The particle hygroscopicity parameter was determined using Köhler Theory applied for supersaturated and subsaturated conditions. The hygroscopicity parameter was also determined from extinction hygroscopic enhancement factor f(RH) by using two empirical equations. Sub-saturated hygroscopicity values for cow dung were 0.024–0.131 and Eucalyptus were 0.012–0.300, while supersaturated hygroscopicity values for cow dung are 0.071–0.577 and Eucalyptus are 0.021–0.494.
Subsaturated κ-values suggested moderate droplet growth across the polydisperse aerosol and suggested that emissions from BB are equally likely to contribute to regional haze formation; regardless of the fuel type and the burning conditions the aerosol studied here had similar growth factors in the sub-saturated regime. The influence of burning conditions, as determined by MCE, on hygroscopicity was systematically studied in this work due to our ability to dial in a specific MCE using the tube furnace. Emissions at higher MCEs, corresponding to flaming-dominated conditions, showed increasing hygroscopicity trends and were more likely to contribute to cloud seeding. The κ-values from CCNC measurements were consistently higher than subsaturated values and tended to increase with increasing MCE. While the dependence of Kappa on MCE was only demonstrated for supersaturated measurements of dung in this work, it is possible that this trend can be applied more generally. However, the present data set does not support that assertion and further refinement and measurements would be needed to demonstrate a robust relationship.
Furthermore, differences in particle hygroscopicity appeared more discernible in the supersaturated than in the subsaturated condition. Hygroscopicity also showed fuel type dependency, as it was higher for cow dung compared to Eucalyptus.
Supplemental Material
Download MS Word (263.7 KB)Acknowledgments
The authors acknowledge the support by NSF Grant # AGS1831013. MJ acknowledges the partial support by the Department of Education under the Title III HBGI grant. Any opinions, findings, and conclusions, or recommendations expressed in this material are those of the author(s) and do not necessarily reflect the views of the Department of Education. MM acknowledges the stimulating discussions with Dr. Vaios Moschos in preparing this manuscript.
Additional information
Funding
References
- Andreae, M. O. 2019. Emission of trace gases and aerosols from biomass burning – An updated assessment. Atmos. Chem. Phys. 19 (13):8523–46. doi:10.5194/acp-19-8523-2019.
- Barker, P. A., G. Allen, M. Gallagher, J. R. Pitt, R. E. Fisher, T. Bannan, E. G. Nisbet, S. J. B. Bauguitte, D. Pasternak, S. Cliff, et al. 2020. Airborne measurements of fire emission factors for African biomass burning sampled during the MOYA campaign. Atmos. Chem. Phys. 20 (23):15443–59. doi:10.5194/acp-20-15443-2020.
- Beaver, M. R., R. M. Garland, C. A. Hasenkopf, T. Baynard, A. R. Ravishankara, and M. A. Tolbert. 2008. A laboratory investigation of the relative humidity dependence of light extinction by organic compounds from lignin combustion. Environ. Res. Lett. 3 (4):045003. doi:10.1088/1748-9326/3/4/045003.
- Beyene, A. D., and S. F. Koch. 2013. Clean fuel-saving technology adoption in urban Ethiopia. Energy Econ. 36:605–13. doi:10.1016/j.eneco.2012.11.003.
- Bond, T. C., S. J. Doherty, D. W. Fahey, P. M. Forster, T. Berntsen, B. J. DeAngelo, M. G. Flanner, S. Ghan, B. Kärcher, D. Koch, et al. 2013. Bounding the role of black carbon in the climate system: A scientific assessment. J. Geophys. Res. Atmos. 118 (11):5380–552. doi:10.1002/jgrd.50171.
- Bougiatioti, A., S. Bezantakos, I. Stavroulas, N. Kalivitis, P. Kokkalis, G. Biskos, N. Mihalopoulos, A. Papayannis, and A. Nenes. 2016. Biomass-burning impact on CCN number, hygroscopicity and cloud formation during summertime in the eastern Mediterranean. Atmos. Chem. Phys. 16 (11):7389–409. doi:10.5194/acp-16-7389-2016.
- Brock, C. A., N. L. Wagner, B. E. Anderson, A. R. Attwood, A. Beyersdorf, P. Campuzano-Jost, A. G. Carlton, D. A. Day, G. S. Diskin, T. D. Gordon, et al. 2016. Aerosol optical properties in the southeastern United States in summer – Part 1: Hygroscopic growth. Atmos. Chem. Phys. 16 (8):4987–5007. doi:10.5194/acp-16-4987-2016.
- Carrico, C. M., M. D. Petters, S. M. Kreidenweis, J. L. Collett, Jr., G. Engling, and W. C. Malm. 2008. Aerosol hygroscopicity and cloud droplet activation of extracts of filters from biomass burning experiments. J. Geophys. Res. 113 (D8):1–9. doi:10.1029/2007JD009274.
- Cecchini, M. A., L. A. T. Machado, M. O. Andreae, S. T. Martin, R. I. Albrecht, P. Artaxo, H. M. J. Barbosa, S. Borrmann, D. Fütterer, T. Jurkat, et al. 2017. Sensitivities of Amazonian clouds to aerosols and updraft speed. Atmos. Chem. Phys. 17 (16):10037–50. doi:10.5194/acp-17-10037-2017.
- Cerully, K. M., T. Raatikainen, S. Lance, D. Tkacik, P. Tiitta, T. Petäjä, M. Ehn, M. Kulmala, D. R. Worsnop, A. Laaksonen, et al. 2011. Aerosol hygroscopicity and CCN activation kinetics in a boreal forest environment during the 2007 EUCAARI campaign. Atmos. Chem. Phys. 11 (23):12369–86. doi:10.5194/acp-11-12369-2011.
- Chang, R. Y. W., J. G. Slowik, N. C. Shantz, A. Vlasenko, J. Liggio, S. J. Sjostedt, W. R. Leaitch, and J. P. D. Abbatt. 2010. The hygroscopicity parameter (κ) of ambient organic aerosol at a field site subject to biogenic and anthropogenic influences: Relationship to degree of aerosol oxidation. Atmos. Chem. Phys. 10 (11):5047–64. doi:10.5194/acp-10-5047-2010.
- Chen, L. W. A., P. Verburg, A. Shackelford, D. Zhu, R. Susfalk, J. C. Chow, and J. G. Watson. 2010. Moisture effects on carbon and nitrogen emission from burning of wildland biomass. Atmos. Chem. Phys. 10 (14):6617–25. doi:10.5194/acp-10-6617-2010.
- Cheng, Y. F., A. Wiedensohler, H. Eichler, J. Heintzenberg, M. Tesche, A. Ansmann, M. Wendisch, H. Su, D. Althausen, H. Herrmann, et al. 2008. Relative humidity dependence of aerosol optical properties and direct radiative forcing in the surface boundary layer at Xinken in Pearl River Delta of China: An observation based numerical study. Atmos. Environ. 42 (25):6373–97. doi:10.1016/j.atmosenv.2008.04.009.
- Clarke, A. D., Y. Shinozuka, V. N. Kapustin, S. Howell, B. Huebert, S. Doherty, T. Anderson, D. Covert, J. Anderson, X. Hua, et al. 2004. Size distributions and mixtures of dust and black carbon aerosol in Asian outflow: Physiochemistry and optical properties. J. Geophys. Res. 109 (D15):1–20. doi:10.1029/2003JD004378.
- Dawson, J. N., K. A. Malek, P. N. Razafindrambinina, T. M. Raymond, D. D. Dutcher, A. A. Asa-Awuku, and M. A. Freedman. 2020. Direct comparison of the submicron aerosol hygroscopicity of water-soluble sugars. ACS Earth Space Chem. 4 (12):2215–26. doi:10.1021/acsearthspacechem.0c00159.
- Dawson, K. W., M. D. Petters, N. Meskhidze, S. Suda Petters, and S. M. Kreidenweis. 2016. Hygroscopic growth and cloud droplet activation of xanthan gum as a proxy for marine hydrogels. JGR Atmos. 121 (19):803–11. doi:10.1002/2016JD025143.
- Dusek, U., G. P. Frank, A. Massling, K. Zeromskiene, Y. Iinuma, O. Schmid, G. Helas, T. Hennig, A. Wiedensohler, and M. O. Andreae. 2011. Water uptake by biomass burning aerosol at sub- and supersaturated conditions: Closure studies and implications for the role of organics. Atmos. Chem. Phys. 11 (18):9519–32. doi:10.5194/acp-11-9519-2011.
- Eck, T. F., B. N. Holben, D. E. Ward, M. M. Mukelabai, O. Dubovik, A. Smirnov, J. S. Schafer, N. C. Hsu, S. J. Piketh, A. Queface, et al. 2003. Variability of biomass burning aerosol optical characteristics in southern Africa during the SAFARI 2000 dry season campaign and a comparison of single scattering albedo estimates from radiometric measurements. J. Geophys. Res. 108 (D13):1–21. doi:10.1029/2002JD002321.
- Eichler, H., Y. F. Cheng, W. Birmili, A. Nowak, A. Wiedensohler, E. Brüggemann, T. Gnauk, H. Herrmann, D. Althausen, A. Ansmann, et al. 2008. Hygroscopic properties and extinction of aerosol particles at ambient relative humidity in South-Eastern China. Atmos. Environ. 42 (25):6321–34. doi:10.1016/j.atmosenv.2008.05.007.
- Engelhart, G. J., C. J. Hennigan, M. A. Miracolo, A. L. Robinson, and S. N. Pandis. 2012. Cloud condensation nuclei activity of fresh primary and aged biomass burning aerosol. Atmos. Chem. Phys. 12 (15):7285–93. doi:10.5194/acp-12-7285-2012.
- Farmer, D. K., C. D. Cappa, and S. M. Kreidenweis. 2015. Atmospheric processes and their controlling influence on cloud condensation nuclei activity. Chem. Rev. 115 (10):4199–217. doi:10.1021/cr5006292.
- Fierz-Schmidhauser, R., P. Zieger, M. Gysel, L. Kammermann, P. F. DeCarlo, U. Baltensperger, and E. Weingartner. 2010. Measured and predicted aerosol light scattering enhancement factors at the high alpine site Jungfraujoch. Atmos. Chem. Phys. 10 (5):2319–33. doi:10.5194/acp-10-2319-2010.
- Flamant, C., P. Knippertz, A. H. Fink, A. Akpo, B. Brooks, C. J. Chiu, H. Coe, S. Danuor, M. Evans, O. Jegede, et al. 2018. The Dynamics–Aerosol–Chemistry–Cloud Interactions in West Africa field campaign: Overview and research highlights. Bulletin of the American Meteorological Society 99 (1):83–104. doi:10.1175/BAMS-D-16-0256.1.
- Giordano, M. R., D. Z. Short, S. Hosseini, W. Lichtenberg, and A. A. Asa-Awuku. 2013. Changes in droplet surface tension affect the observed hygroscopicity of photochemically aged biomass burning aerosol. Environ. Sci. Technol. 47 (19):10980–6. doi:10.1021/es401867j.
- Gohil, K., C. N. Mao, D. Rastogi, C. Peng, M. Tang, and A. Asa-Awuku. 2022. Hybrid water adsorption and solubility partitioning for aerosol hygroscopicity and droplet growth. Atmos. Chem. Phys. 22 (19):12769–87. doi:10.5194/acp-22-12769-2022.
- Gomez, S. L., C. M. Carrico, C. Allen, J. Lam, S. Dabli, A. P. Sullivan, A. C. Aiken, T. Rahn, D. Romonosky, P. Chylek, et al. 2018. Southwestern U.S. biomass burning smoke hygroscopicity: The role of plant phenology, chemical composition, and combustion properties. J. Geophys. Res. Atmos. 123 (10):5416–32. doi:10.1029/2017JD028162.
- Haarig, M., A. Ansmann, J. Gasteiger, K. Kandler, D. Althausen, H. Baars, M. Radenz, and D. A. Farrell. 2017. Dry versus wet marine particle optical properties: RH dependence of depolarization ratio, backscatter, and extinction from multiwavelength lidar measurements during SALTRACE. Atmos. Chem. Phys. 17 (23):14199–217. doi:10.5194/acp-17-14199-2017.
- Hamilton, D. S., S. Hantson, C. E. Scott, J. O. Kaplan, K. J. Pringle, L. P. Nieradzik, A. Rap, G. A. Folberth, D. V. Spracklen, and K. S. Carslaw. 2018. Reassessment of pre-industrial fire emissions strongly affects anthropogenic aerosol forcing. Nat. Commun. 9 (1):3182. doi:10.1038/s41467-018-05592-9.
- Hand, J. L., and W. C. Malm. 2007. Review of aerosol mass scattering efficiencies from ground-based measurements since 1990. J. Geophys. Res. 112 (D16):1–24. doi:10.1029/2007JD008484.
- Hansen, A. M. K., J. Hong, T. Raatikainen, K. Kristensen, A. Ylisirniö, A. Virtanen, T. Petäjä, M. Glasius, and N. L. Prisle. 2015. Hygroscopic properties and cloud condensation nuclei activation of limonene-derived organosulfates and their mixtures with ammonium sulfate. Atmos. Chem. Phys. 15 (24):14071–89. doi:10.5194/acp-15-14071-2015.
- Haywood, J. M., S. J. Abel, P. A. Barrett, N. Bellouin, A. Blyth, K. N. Bower, M. Brooks, K. Carslaw, H. Che, H. Coe, et al. 2021. The CLoud–Aerosol–Radiation Interaction and Forcing: Year 2017 (CLARIFY-2017) measurement campaign. Atmos. Chem. Phys. 21 (2):1049–84. doi:10.5194/acp-21-1049-2021.
- IEA, IRENA, UNSD, World Bank, WHO. 2020. Tracking SDG 7: The energy progress report. Washington, DC: World Bank.
- Kacarab, M., K. L. Thornhill, A. Dobracki, S. G. Howell, J. R. O’Brien, S. Freitag, M. R. Poellot, R. Wood, P. Zuidema, J. Redemann, et al. 2020. Biomass burning aerosol as a modulator of the droplet number in the southeast Atlantic region. Atmos. Chem. Phys. 20 (5):3029–40. doi:10.5194/acp-20-3029-2020.
- Kim, J., L. Ahlm, T. Yli-Juuti, M. Lawler, H. Keskinen, J. Tröstl, S. Schobesberger, J. Duplissy, A. Amorim, F. Bianchi, et al. 2016. Hygroscopicity of nanoparticles produced from homogeneous nucleation in the CLOUD experiments. Atmos. Chem. Phys. 16 (1):293–304. doi:10.5194/acp-16-293-2016.
- Kottek, M., J. Grieser, C. Beck, B. Rudolf, and F. Rubel. 2006. World map of the Koppen-Geiger climate classification updated. Meteorol. Z. 15 (3):259–63. doi:10.1127/0941-2948/2006/0130.
- Kreidenweis, S. M., and A. Asa-Awuku. 2014. 5.13 - Aerosol hygroscopicity: Particle water content and its role in atmospheric processes. In Treatise on geochemistry, ed. Heinrich D. Holland and Karl K. Turekian, 2nd ed., 331–61. Oxford: Elsevier.
- Kreidenweis, S. M., K. Koehler, P. J. DeMott, A. J. Prenni, C. Carrico, and B. Ervens. 2005. Water activity and activation diameters from hygroscopicity data - Part I: Theory and application to inorganic salts. Atmos. Chem. Phys. 5 (5):1357–1370. doi:10.5194/acp-5-1357-2005.
- Lamarque, J. F., T. C. Bond, V. Eyring, C. Granier, A. Heil, Z. Klimont, D. Lee, C. Liousse, A. Mieville, B. Owen, et al. 2010. Historical (1850–2000) gridded anthropogenic and biomass burning emissions of reactive gases and aerosols: Methodology and application. Atmos. Chem. Phys. 10 (15):7017–39. doi:10.5194/acp-10-7017-2010.
- Laris, P., M. Koné, F. Dembélé, C. M. Rodrigue, L. Yang, R. Jacobs, and Q. Laris. 2021. Methane gas emissions from savanna fires: What analysis of local burning regimes in a working West African landscape tell us. Biogeosciences 18 (23):6229–44. doi:10.5194/bg-18-6229-2021.
- Lee, W., Y. Deng, R. Zhou, M. Itoh, M. Mochida, and M. Kuwata. 2022. Water solubility distribution of organic matter accounts for the discrepancy in hygroscopicity among sub- and supersaturated humidity regimes. Environ. Sci. Technol. 56 (24):17924–35. doi:10.1021/acs.est.2c04647.
- Lewis, K. A., W. P. Arnott, H. Moosmüller, R. K. Chakrabarty, C. M. Carrico, S. M. Kreidenweis, D. E. Day, W. C. Malm, A. Laskin, J. L. Jimenez, et al. 2009. Reduction in biomass burning aerosol light absorption upon humidification: Roles of inorganically-induced hygroscopicity, particle collapse, and photoacoustic heat and mass transfer. Atmos. Chem. Phys. 9 (22):8949–66. doi:10.5194/acp-9-8949-2009.
- Li, C., Y. Hu, J. Chen, Z. Ma, X. Ye, X. Yang, L. Wang, X. Wang, and A. Mellouki. 2016. Physiochemical properties of carbonaceous aerosol from agricultural residue burning: Density, volatility, and hygroscopicity. Atmos. Environ. 140:94–105. doi:10.1016/j.atmosenv.2016.05.052.
- Li, C. L., Z. Ma, J. M. Chen, X. M. Wang, X. N. Ye, L. Wang, X. Yang, H. D. Kan, D. J. Donaldson, and A. Mellouki. 2015. Evolution of biomass burning smoke particles in the dark. Atmos. Environ. 120:244–52. doi:10.1016/j.atmosenv.2015.09.003.
- Liu, D., J. Allan, J. Whitehead, D. Young, M. Flynn, H. Coe, G. McFiggans, Z. L. Fleming, and B. Bandy. 2013. Ambient black carbon particle hygroscopic properties controlled by mixing state and composition. Atmos. Chem. Phys. 13 (4):2015–29. doi:10.5194/acp-13-2015-2013.
- Malek, K. A., K. Gohil, H. A. Al-Abadleh, and A. A. Asa-Awuku. 2022. Hygroscopicity of polycatechol and polyguaiacol secondary organic aerosol in sub- and supersaturated water vapor environments. Environ. Sci.: Atmos. 2 (1):24–33. doi:10.1039/D1EA00063B.
- Martin, M., T. Tritscher, Z. Jurányi, M. F. Heringa, B. Sierau, E. Weingartner, R. Chirico, M. Gysel, A. S. H. Prévôt, U. Baltensperger, et al. 2013. Hygroscopic properties of fresh and aged wood burning particles. J. Aerosol Sci. 56:15–29. doi:10.1016/j.jaerosci.2012.08.006.
- Massoli, P., A. T. Lambe, A. T. Ahern, L. R. Williams, M. Ehn, J. Mikkilä, M. R. Canagaratna, W. H. Brune, T. B. Onasch, J. T. Jayne, et al. 2010. Relationship between aerosol oxidation level and hygroscopic properties of laboratory generated secondary organic aerosol (SOA) particles. Geophys. Res. Lett. 37 (24):n/a–/a. doi:10.1029/2010GL045258.
- McFiggans, G., P. Artaxo, U. Baltensperger, H. Coe, M. C. Facchini, G. Feingold, S. Fuzzi, M. Gysel, A. Laaksonen, U. Lohmann, et al. 2006. The effect of physical and chemical aerosol properties on warm cloud droplet activation. Atmos. Chem. Phys. 6 (9):2593–2649.10.5194/acp-6-2593-2006.
- Moore, R. H., A. Nenes, and J. Medina. 2010. Scanning mobility CCN analysis—A method for fast measurements of size-resolved CCN distributions and activation kinetics. Aerosol Sci. Technol. 44 (10):861–71. doi:10.1080/02786826.2010.498715.
- Moosmüller, H., R. Varma, and W. P. Arnott. 2005. Cavity ring-down and cavity-enhanced detection techniques for the measurement of aerosol extinction. Aerosol Sci. Technol. 39 (1):30–9. doi:10.1080/027868290903880.
- Ng, D. H. L., R. M. Li, S. V. Raghavan, and S. Y. Liong. 2017. Investigating the relationship between Aerosol Optical Depth and Precipitation over Southeast Asia with Relative Humidity as an influencing factor. Sci. Rep. 7 (1):1–13. doi:10.1038/s41598-017-10858-1.
- Pajunoja, A., A. T. Lambe, J. Hakala, N. Rastak, M. J. Cummings, J. F. Brogan, L. Hao, M. Paramonov, J. Hong, N. L. Prisle, et al. 2015. Adsorptive uptake of water by semisolid secondary organic aerosols. Geophys. Res. Lett. 42 (8):3063–8. doi:10.1002/2015GL063142.
- Patel, P. N., and J. H. Jiang. 2021. Cloud condensation nuclei characteristics at the Southern Great Plains site: Role of particle size distribution and aerosol hygroscopicity. Environ. Res. Commun. 3 (7):075002. doi:10.1088/2515-7620/ac0e0b.
- Petters, M. D., C. M. Carrico, S. M. Kreidenweis, A. J. Prenni, P. J. DeMott, J. L. Collett, and H. Moosmüller. 2009. Cloud condensation nucleation activity of biomass burning aerosol. J. Geophys. Res. 114 (D22):1–16. doi:10.1029/2009JD012353.
- Petters, M. D., and S. M. Kreidenweis. 2007. A single parameter representation of hygroscopic growth and cloud condensation nucleus activity. Atmos. Chem. Phys. 7 (8):1961–71. doi:10.5194/acp-7-1961-2007.
- Pokhrel, R. P., J. Gordon, M. N. Fiddler, and S. Bililign. 2020. Impact of combustion conditions on physical and morphological properties of biomass burning aerosol. Aerosol Sci. Technol. 55 (1):80–91. doi:10.1080/02786826.2020.1822512.
- Pokhrel, R. P., J. Gordon, M. N. Fiddler, and S. Bililign. 2021. Determination of emission factors of pollutants from biomass burning of African fuels in laboratory measurements. JGR Atmos. 126 (20):e2021JD034731. doi:10.1029/2021JD034731.
- Pokhrel, R. P., N. L. Wagner, J. M. Langridge, D. A. Lack, T. Jayarathne, E. A. Stone, C. E. Stockwell, R. J. Yokelson, and S. M. Murphy. 2016. Parameterization of single-scattering albedo (SSA) and absorption Ångström exponent (AAE) with EC/OC for aerosol emissions from biomass burning. Atmos. Chem. Phys. 16 (15):9549–61. doi:10.5194/acp-16-9549-2016.
- Pringle, K. J., H. Tost, A. Pozzer, U. Pöschl, and J. Lelieveld. 2010. Global distribution of the effective aerosol hygroscopicity parameter for CCN activation. Atmos. Chem. Phys. 10 (12):5241–55. doi:10.5194/acp-10-5241-2010.
- Redemann, J., R. Wood, P. Zuidema, S. J. Doherty, B. Luna, S. E. LeBlanc, M. S. Diamond, Y. Shinozuka, I. Y. Chang, R. Ueyama, et al. 2021. An overview of the ORACLES (ObseRvations of Aerosols above CLouds and their intEractionS) project: Aerosol–cloud–radiation interactions in the southeast Atlantic basin. Atmos. Chem. Phys. 21 (3):1507–63. doi:10.5194/acp-21-1507-2021.
- Reutter, P., H. Su, J. Trentmann, M. Simmel, D. Rose, S. S. Gunthe, H. Wernli, M. O. Andreae, and U. Pöschl. 2009. Aerosol- and updraft-limited regimes of cloud droplet formation: Influence of particle number, size and hygroscopicity on the activation of cloud condensation nuclei (CCN). Atmos. Chem. Phys. 9 (18):7067–80. doi:10.5194/acp-9-7067-2009.
- Rissler, J., A. Vestin, E. Swietlicki, G. Fisch, J. Zhou, P. Artaxo, and M. O. Andreae. 2006. Size distribution and hygroscopic properties of aerosol particles from dry-season biomass burning in Amazonia. Atmos. Chem. Phys. 6 (2):471–91. doi:10.5194/acp-6-471-2006.
- Roberts, G. C., and A. Nenes. 2005. A continuous-flow streamwise thermal-gradient CCN chamber for atmospheric measurements. Aerosol Sci. Technol. 39 (3):206–21. doi:10.1080/027868290913988.
- Rose, D., S. S. Gunthe, H. Su, R. M. Garland, H. Yang, M. Berghof, Y. F. Cheng, B. Wehner, P. Achtert, A. Nowak, et al. 2011. Cloud condensation nuclei in polluted air and biomass burning smoke near the mega-city Guangzhou, China – Part 2: Size-resolved aerosol chemical composition, diurnal cycles, and externally mixed weakly CCN-active soot particles. Atmos. Chem. Phys. 11 (6):2817–36. doi:10.5194/acp-11-2817-2011.
- Royer, H. M., M. L. Pöhlker, O. Krüger, E. Blades, P. Sealy, N. N. Lata, Z. Cheng, S. China, A. P. Ault, P. K. Quinn, et al. 2022. African smoke particles act as cloud condensation nuclei in the wintertime tropical North Atlantic boundary layer over Barbados. Atmos. Chem. Phys. Discuss. 2022:1–39. doi:10.5194/acp-2022-341.
- Sato, Y., and K. Suzuki. 2019. How do aerosols affect cloudiness? Science 363 (6427):580–1. doi:10.1126/science.aaw3720.
- Singh, S., M. N. Fiddler, and S. Bililign. 2016. Measurement of size-dependent single scattering albedo of fresh biomass burning aerosols using the extinction-minus-scattering technique with a combination of cavity ring-down spectroscopy and nephelometry. Atmos. Chem. Phys. 16 (21):13491–507. doi:10.5194/acp-16-13491-2016.
- Singh, S., M. N. Fiddler, D. Smith, and S. Bililign. 2014. Error analysis and uncertainty in the determination of aerosol optical properties using cavity ring-down spectroscopy, integrating nephelometry, and the extinction-minus-scattering method. Aerosol Sci. Technol. 48 (12):1345–59. doi:10.1080/02786826.2014.984062.
- Smith, D. M., M. N. Fiddler, R. P. Pokhrel, and S. Bililign. 2020. Laboratory studies of fresh and aged biomass burning aerosol emitted from east African biomass fuels – Part 1: Optical properties. Atmos. Chem. Phys. 20 (17):10149–68. doi:10.5194/acp-20-10149-2020.
- Smith, D. M., M. N. Fiddler, K. G. Sexton, and S. Bililign. 2019. Construction and characterization of an indoor smog chamber for measuring the optical and physicochemical properties of aging biomass burning aerosols. Aerosol Air Qual. Res. 19 (3):467–83. doi:10.4209/aaqr.2018.06.0243.
- Spracklen, D. V., K. S. Carslaw, M. Kulmala, V. Kerminen, S. Sihto, I. Riipinen, J. Merikanto, G. W. Mann, M. P. Chipperfield, A. Wiedensohler, et al. 2008. Contribution of particle formation to global cloud condensation nuclei concentrations. Geophys. Res. Lett. 35 (6):1–5. doi:10.1029/2007GL033038.
- Strawa, A. W., R. Elleman, A. G. Hallar, D. Covert, K. Ricci, R. Provencal, T. W. Owano, H. H. Jonsson, B. Schmid, A. P. Luu, et al. 2006. Comparison of in situ aerosol extinction and scattering coefficient measurements made during the Aerosol Intensive Operating Period. J. Geophys. Res. 111 (D5):1–17. doi:10.1029/2005JD006056.
- Streets, D. G., T. C. Bond, T. Lee, and C. Jang. 2004. On the future of carbonaceous aerosol emissions. J. Geophys. Res. 109 (D24):1–15. doi:10.1029/2004JD004902.
- Swietlicki, E., H. C. Hansson, K. Hämeri, B. Svenningsson, A. Massling, G. McFiggans, P. H. McMurry, T. Petäjä, P. Tunved, M. Gysel, et al. 2008. Hygroscopic properties of submicrometer atmospheric aerosol particles measured with H-TDMA instruments in various environments—A review. Tellus B: Chemical and Physical Meteorology 60 (3):432–69. doi:10.1111/j.1600-0889.2008.00350.x.
- Tang, M., C. K. Chan, Y. Jie Li, H. Su, Q. Ma, Z. Wu, G. Zhang, Z. Wang, M. Ge, M. Hu, et al. 2019. A review of experimental techniques for aerosol hygroscopicity studies. Atmos. Chem. Phys. 19 (19):12631–86. doi:10.5194/acp-19-12631-2019.
- Thompson, J. E., N. Barta, D. Policarpio, and R. DuVall. 2008. A fixed frequency aerosol albedometer. Opt. Express. 16 (3):2191–205. doi:10.1364/Oe.16.002191.
- Thompson, J. E., B. W. Smith, and J. D. Winefordner. 2002. Monitoring atmospheric particulate matter through cavity ring-down spectroscopy. Anal. Chem. 74 (9):1962–7. doi:10.1021/ac0110505.
- Thornhill, G. D., C. L. Ryder, E. J. Highwood, L. C. Shaffrey, and B. T. Johnson. 2018. The effect of South American biomass burning aerosol emissions on the regional climate. Atmos. Chem. Phys. 18 (8):5321–42. doi:10.5194/acp-18-5321-2018.
- Titos, G., A. Cazorla, P. Zieger, E. Andrews, H. Lyamani, M. J. Granados-Muñoz, F. J. Olmo, and L. Alados-Arboledas. 2016. Effect of hygroscopic growth on the aerosol light-scattering coefficient: A review of measurements, techniques and error sources. Atmos. Environ. 141:494–507. doi:10.1016/j.atmosenv.2016.07.021.
- UN, Department of Economic and Social Affairs, Population Division. 2017. World population prospects: The 2017 revision, key findings and advance tables. Working Paper No. ESA/P/WP/248, United Nations, New York.
- Vakkari, V., V.-M. Kerminen, J. P. Beukes, P. Tiitta, P. G. Zyl, M. Josipovic, A. D. Venter, K. Jaars, D. R. Worsnop, M. Kulmala, et al. 2014. Rapid changes in biomass burning aerosols by atmospheric oxidation. Geophys. Res. Lett. 41 (7):2644–51. doi:10.1002/2014GL059396.
- van der Werf, G. R., J. T. Randerson, L. Giglio, G. J. Collatz, M. Mu, P. S. Kasibhatla, D. C. Morton, R. S. DeFries, Y. Jin, and T. T. van Leeuwen. 2010. Global fire emissions and the contribution of deforestation, savanna, forest, agricultural, and peat fires (1997–2009). Atmos. Chem. Phys. 10 (23):11707–35. doi:10.5194/acp-10-11707-2010.
- Wang, Z., Y. Cheng, N. Ma, E. Mikhailov, U. Pöschl, and H. Su. 2017. Dependence of the hygroscopicity parameter κ on particle size, humidity and solute concentration: Implications for laboratory experiments, field measurements and model studies. Atmospheric Chemistry and Physics Discussions: 1–33. doi:10.5194/acp-2017-253.
- Wiedensohler, A. 1988. An approximation of the bipolar charge distribution for particles in the submicron size range. J. Aerosol Sci. 19 (3):387–9. doi:10.1016/0021-8502(88)90278-9.
- WMO. 2016. WMO/GAW aerosol measurement procedures, guidelines and recommendations. GAW Report No. 227.
- Wu, Z. J., L. Poulain, S. Henning, K. Dieckmann, W. Birmili, M. Merkel, D. van Pinxteren, G. Spindler, K. Müller, F. Stratmann, et al. 2013. Relating particle hygroscopicity and CCN activity to chemical composition during the HCCT-2010 field campaign. Atmos. Chem. Phys. 13 (16):7983–96. doi:10.5194/acp-13-7983-2013.
- Zieger, P., R. Fierz-Schmidhauser, E. Weingartner, and U. Baltensperger. 2013. Effects of relative humidity on aerosol light scattering: Results from different European sites. Atmos. Chem. Phys. 13 (21):10609–31. doi:10.5194/acp-13-10609-2013.