
 ?Mathematical formulae have been encoded as MathML and are displayed in this HTML version using MathJax in order to improve their display. Uncheck the box to turn MathJax off. This feature requires Javascript. Click on a formula to zoom.
Abstract
A diffusion multilayer model is introduced which allows time-dependent simulations of heat and mass transfer for photoacoustic experiments on aerosol particles (MHM-PA model). It provides spatial and temporal information on the particle temperature, composition, and size during photoacoustic modulation cycles, and thus, enables accurate simulations of the photoacoustic amplitude and phase at different modulation frequencies. Simulations for micrometer-sized, mixed water-tetraethylene glycol droplets at different relative humidity and at different modulation frequencies between 4 kHz and 100 kHz reveal a substantial loss of the information content of the photoacoustic signal above approximately 30 kHz. The photoacoustic amplitude reduces by two orders of magnitude, causing sensitivity issues. The photoacoustic phase converges to the same constant value for all droplet sizes and humidities, meaning that useful information on heat and mass transfer is essentially lost in the phase.
Editor:
1. Introduction
Photoacoustics (PA) is a well-established photothermal method, in which light energy is absorbed by a sample (e.g., condensed phases, aerosol particles or gas phase molecules) and subsequently converted into acoustic energy (sound). PA spectroscopy is widely employed in several scientific disciplines, such as atmospheric sciences (Moosmüller, Chakrabarty, and Arnott Citation2009; Ajtai et al. Citation2010; Haisch and Niessner Citation2012; Lack et al. Citation2012), biology (Mesquita et al. Citation2006; Corrêa et al. Citation2011; Latif, Toda, and Ono Citation2020), or material sciences (Zelaya‐Angel et al. Citation1994; Hu, Chen, and Su Citation2006; Mota et al. Citation2009). PA of aerosol particles has mainly been applied for measurements on particle ensembles, with a focus on absorption measurements of atmospherically relevant aerosol particles, both in laboratories and environmental campaigns (Arnott et al. Citation1999; Moosmüller, Chakrabarty, and Arnott Citation2009; Gyawali et al. Citation2012; Haisch Citation2012; Haisch and Niessner Citation2012; Lack et al. Citation2012; Linke et al. Citation2016; Mason et al. Citation2018; Davies et al. Citation2019). Optical properties of aerosols, such as the absorption of sunlight, are of crucial importance for accurate global climate modeling due to the ubiquitous nature of aerosols in the atmosphere and their strong influence on the climate through a combination of direct and indirect effects (Kolb et al. Citation2010; Fan et al. Citation2016).
We have recently developed the first laboratory setup for photoacoustic measurements on single aerosol particles, a technique which we refer to as photothermal single-particle spectroscopy (PSPS) (Cremer et al. Citation2016). The working principle and the experimental setup are briefly explained in Section 2 and . Single-particle investigations offer various benefits compared with studies on particle ensembles due to the high degree of control over the environmental and experimental conditions (e.g., temperature, relative humidity, laser powers, and particle position). This enables the accurate characterization of the properties of the same particle on extended time scales (e.g., particle size, composition, complex refractive index, temperature) and avoids ensemble averaging effects. Thus, PSPS is suited to perform high-precision photo-thermal experiments. With PSPS, we were able to experimentally observe the acceleration of photochemical reactions inside an aerosol droplet (Cremer et al. Citation2016), measure the theoretically predicted particle size-dependent damping of the PA signal (Covert, Cremer, and Signorell Citation2017; Cremer et al. Citation2017), or determine the mass accommodation coefficient, αM, of water on aqueous organic aerosol droplets (Roy, Diveky, and Signorell Citation2020).
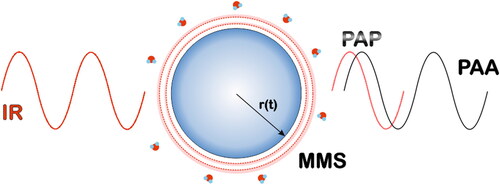
Figure 1. Simplified sketch of a PSPS experiment on a single aerosol droplet (blue). The absorption of an intensity modulated excitation IR laser (red trace) induces periodic heating and cooling of the droplet and results in heat transfer (red dotted trace and shading) and water evaporation/condensation (H2O molecules). This leads to the formation of a pressure wave in the surrounding air. This photoacoustic signal consists of two components, a photoacoustic amplitude (PAA) and a phase (PAP). The change of the particle density due to the periodic change in temperature and composition results in a periodic fluctuation of the particle radius (r(t)) which is measured by modulated Mie light scattering (MMS). The color scheme inside the droplet visualizes the water concentration gradients (darker blue corresponds to higher gradients) attained within the droplet during one PA cycle.
For data analysis, we developed the balanced Energy Flux Photoacoustic (bEF-PA) model (see references (Diveky et al. Citation2019; Diveky, Roy, et al. Citation2020; Roy, Diveky, and Signorell Citation2020 for details) based on previous work of Murphy (Murphy Citation2009) and Raspet et al. (Citation2003). This model calculates the contributions of the heat flux and mass flux between the particle and surrounding gas phase to the photoacoustic signal; i.e., to the photoacoustic amplitude (PAA) and the photoacoustic phase (PAP). The heat flux represents the direct heat exchange between the particle and the surrounding gas phase through ballistic collisions. The mass flux arises from periodic condensation and evaporation of volatile species (water in the present study) onto and from the particle. The bEF-PA model assumes that the temperature and concentration in the particle are uniform; i.e., that heat and mass diffusion and transfer are fast compared to the timescale of a typical photoacoustic cycle. These, however, are not good approximations at higher photoacoustic modulation frequencies where non-equilibrium phenomena are expected to significantly influence the PAA and PAP.
To shed further light on the influence of the dynamics of heat and mass transfer on the PA signals, we developed a multilayer photoacoustics (MHM-PA) model based on the kinetic multilayer model by Shiraiwa et al. (Shiraiwa, Pfrang, and Pöschl Citation2010; Shiraiwa et al. Citation2012). Unlike the bEF-PA model, the MHM-PA model explicitly treats heat and mass diffusion in the particle, allowing us to describe temporal gradients of the temperature and composition that form inside the particles during a PA cycle. A time-dependent model, such as this MHM-PA model, thus allows for proper modeling of the PA signal generation up to very high modulation frequencies of >100 kHz. In the present work, we compare the results of our newly developed MHM-PA model with our previous bEF-PA model at low modulation frequency (4 kHz), at which the latter model still provides a decent description. We then use the MHM-PA model to investigate the dependence of the photoacoustic signals on the modulation frequency in the region below 100 kHz.
2. Photothermal single-particle spectroscopy
In our previous single droplet photoacoustic studies (Covert, Cremer, and Signorell Citation2017; Cremer et al. Citation2017; Diveky et al. Citation2019; Diveky, Roy, et al. Citation2020; Roy, Diveky, and Signorell Citation2020; Diveky et al. Citation2021), single aerosol droplets were immobilized by an optical trap inside a resonant photoacoustic cell optimized for a modulation frequency of approximately 4 kHz (trap and cell are not shown in ). The conditions used in the present modeling study represent those of our previous PSPS investigations on aqueous tetraethylene glycol (TEG) droplets (Diveky et al. Citation2019). Aqueous TEG droplets serve as a well-suited proxy to investigate the physical properties of organic aerosol particles. Their PA signals are governed by heat flux and mass flux, where, due to the low vapor pressure of TEG, only water contributes to evaporation and condensation. An intensity-modulated IR laser at 9.47 µm wavelength was used to induce the PA response (). The intensity modulation was performed at the resonance frequency of the photoacoustic cell (∼4 kHz). Light at 9.47 µm wavelength (1056 cm−1) was selected, since it coincides with an infrared absorption band of TEG, but is not absorbed by water molecules. Light absorption by the droplet is accompanied by small periodic oscillations in the droplet properties, such as temperature, water concentration, droplet size, and refractive index. The H2O to TEG ratio in the droplets (mole fraction of H2O varied between 0.18 and 0.86) is determined by the relative humidity (RH) of the surrounding air, which was adjusted accordingly (RH varied between 11% and 93%). The ambient temperature was kept at 293.65 K.
Three different signals were recorded (), all of which are sensitive to the periodic changes of the droplet properties: the PAA, the PAP and modulated Mie scattering (MMS). In photoacoustic measurements, a microphone is utilized to detect the sound wave that is produced by the energy exchange between the droplet and the surrounding gas through coupled heat and mass flux. Elastically (Mie) scattered trapping laser light (532 nm wavelength) from the droplet was monitored by a photodiode. It consists of a contribution that is effectively constant (no change on the timescale of the PA cycle) and a contribution that oscillates with the modulation frequency during one modulation cycle. The constant part provides information on the average droplet size and the oscillatory part (MMS) holds information about the size change during the modulation cycle. The latter was experimentally retrieved by demodulating the photodiode signal at the IR laser modulation frequency with a lock-in amplifier. More detailed experimental descriptions can be found in Diveky et al. (Citation2019) and a more comprehensive explanation of MMS can be found in Diveky, Roy, et al. (Citation2020) and Gleichweit et al. (Citation2022).
3. Multilayer heat and mass transfer photoacoustic model
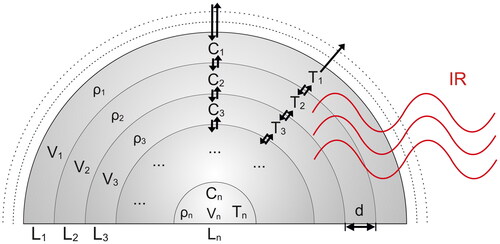
Based on a previous KM-SUB and KM-GAP model reported by Shiraiwa, Pfrang, and Pöschl (Citation2010) and Shiraiwa et al. (Citation2012), a diffusion multilayer model has been built, referred to as MHM-PA model. It provides a depth-resolved description of water and heat transport within the droplet and between the droplet and the surrounding gas phases during photoacoustic cycles. The model divides the particle into a certain number of layers i = 1,…, n with layer i = 1 being the surface layer (). The layers have equal thickness d with n chosen so that d is closest to but not larger than 50 nm. The diffusion of water and heat is treated as the mass or heat flux, from a particular layer i to its adjacent layers i ± 1. The water and heat fluxes between different layers of the droplet can be computed considering the transport velocity and the water concentration or temperature, respectively (EquationEquation (1)
(1)
(1) ). Transport velocities, k, are derived from the corresponding water bulk diffusion coefficients or thermal diffusivity, D (Dw for water and DT for heat). To this end, the average distance traveled by water molecules or heat diffusing in one direction, and the average time required to travel over this distance by diffusion are considered (Atkins Citation1998; Shiraiwa, Pfrang, and Pöschl Citation2010). The mass and heat flux between layers are proportional to k and the water concentration or temperature in the ith layer at time t,
(1)
(1)
Figure 2. Multilayer heat and mass transfer photoacoustic (MHM-PA) Model. Shown are the different layers with temperature (Ti), water concentration (Ci), density (ρi), volume (Vi), and layer thickness (d) from the droplet center layer (n) to the surface layer (1). Heat and water diffusion and transport through the particle–gas interface are indicated by the black arrows.
To describe heat flux, set D = DT, the thermal diffusivity, and Ci,t = Ti,t, the layer temperature.
Any changes in d during the modulation cycle emerging from expansion/contraction or evaporation/condensation have negligible influence on the transport velocities k. For computational simplicity, the transport velocities are, thus, determined assuming constant layer thicknesses throughout the model run.
The model calculates the change in the water concentration and temperature in each layer as a function of time by retrieving the water and heat fluxes from and into the two adjacent layers for small time steps Δt (2 ns). This treatment is essentially a numerical approach to Fick’s law of diffusion. The evolution of the water concentration and temperature due to diffusion as a function of t is given by:
(2)
(2)
(3)
(3)
(4)
(4)
where
is the area between layer i and layer i – 1 and
is the volume of the layer i. The boundary cases, layer 1 (EquationEquation (2)
(2)
(2) ) and the center layer n (EquationEquation (4)
(4)
(4) ), contain only one diffusion term. The heat transfer from the intensity-modulated IR laser to the droplet by absorption is assumed to occur homogeneously throughout the droplet for the considered aqueous TEG mixtures, as confirmed by numerical simulations of the intensity distribution inside the particles. This assumption might not be applicable to shorter wavelengths, larger particles or more absorbing particles. The irradiation with an intensity-modulated laser leads to modulated light absorption, which is included as a modulated deposition of heat in each layer (second term in EquationEquation (5)
(5)
(5) ):
(5)
(5)
is the temperature in layer i at time t,
is the average heat transferred from the IR laser to the droplet,
is the total number of moles of TEG and water in the particle,
is the specific heat capacity at the mean particle temperature (
) and mean water mole fraction (
), and ƒ is the frequency of the laser modulation. By formulating the modulation term in the form of
the simulation starts without abrupt energy input (the laser intensity is zero and t = 0 s). It oscillates between zero and two times the oscillation amplitude and is, thus, equivalent to the modulation term in the bEF-PA model, where it is formulated as
(Cremer et al. Citation2017; Diveky, Gleichweit, et al. Citation2020).
is proportional to the average intensity of the IR laser at the trapping position,
and the absorption cross section of the particle,
(6)
(6)
The latter can be calculated using Mie theory. To determine the refractive index of the water–TEG mixtures at the IR laser wavelength, the Lorentz–Lorenz effective medium approximation (Iulian et al. Citation2010) between pure TEG and pure water at 9.47 µm has been used. For this, the imaginary part of the refractive index of TEG was evaluated from ATR-IR measurements, while the real part of the refractive index was estimated from values of ethylene glycol (Sani and Dell’Oro Citation2014) combined with the ratio of ethylene glycol to TEG at 589 nm (see ) (Iulian et al. Citation2010). The temperature dependence of the composition, refractive index, and density was parametrized according to The Dow Chemical Company (Citation2007).
Table 1. Parameters used in the MHM-PA model.
The exchange of water and heat with the gas phase takes place at the surface layer i = 1, and is defined by the properties of the droplet and surrounding gas phase and by the temperature of the surface layer, The heat flux from the particle to the gas phase (Diveky et al. Citation2019) is determined by:
(7)
(7)
where
is the temperature of the surrounding gas, r is the radius of the droplet, K is the thermal conductivity at
and at the given RH, and
is the heat transition flow correction factor expressed as:
(8)
(8)
where
is the Knudsen number and
is thermal accommodation coefficient. The Knudsen number (
) is given by the ratio of the mean free path of the considered molecule (nitrogen in this case,
) to the particle radius (EquationEquation (9)
(9)
(9) ).
(9)
(9)
The change of due to the heat dissipation to the surrounding gas is described by the heat flux out of or into the particle per time step divided by the heat capacity
of the particle, where the latter is a function of particle density, volume and specific heat capacity and is expressed as
(10)
(10)
where ρ is the density of the droplet at the chosen conditions and
is the volume of the surface layer. The water mass flux from the particle to the gas phase, denoted with the subscript p-g, describes the condensation and evaporation flux (Diveky, Roy, et al. Citation2020) and is defined as:
(11)
(11)
where D is the diffusion coefficient of water in air,
is the partial pressure of water at
and the chosen RH, R is the ideal gas constant,
is the latent heat of water at the mean particle temperature,
is the molar mass of water, and
is the mass transition flow correction factor expressed as:
(12)
(12)
is the Knudsen number considering the mean free path of water (
) in nitrogen at ambient conditions and
is the mass accommodation coefficient of water. We use the experimentally determined values of
for water on mixed TEG/H2O droplets for different concentrations from the work of Diveky et al. (Citation2021) () as input values for the modeling studies in the present work (Diveky et al. Citation2021).
The change of the water concentration in the surface layer due to water evaporation or condensation is defined as:
(13)
(13)
is the surface layer water concentration (layer 1) at time t. Evaporative cooling and heat of condensation are also considered by the model. Their effect on the temperature of the surface layer is given by the latent heat per time step divided by the heat capacity of the particle:
(14)
(14)
The temporal evolution of the volume of each layer is computed from mass and density. The latter depends on the mass fraction of water and temperature of each layer. Thus, the temporal evolution of the droplet radius, r (see e.g., ), and volume, V, can also be determined by the MHM-PA model. Note that EquationEquations (10)(10)
(10) and Equation(14)
(14)
(14) contribute simultaneously to the temperature evolution in our model.
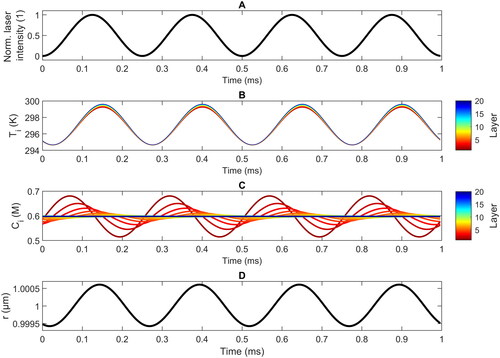
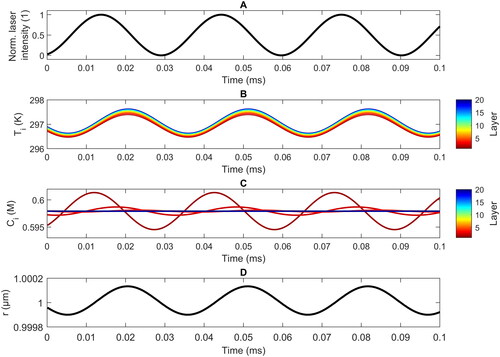
Figure 3. Simulated evolution of the normalized laser intensity (a), the temperature in the different layers (b), the water concentration in the different layers (c), and the droplet radius (d) as a function of time during several photoacoustic cycles at a modulated frequency of 4 kHz for a droplet with = 1 μm at 11% RH. Layer 1 (dark red) is the surface layer, layer 20 (dark blue) is the core layer.
The sinusoidal temporal variation of the heat flux and water flux gives rise to a pressure wave in the surrounding gas phase, whose amplitude is proportional to the photoacoustic amplitude signal, PAA. Both the MHM-PA and the bEF-PA model follow the same identical definition, where the contribution of the heat dissipation and water mass flux to PAA is calculated as:
(15)
(15)
and
are the heat flux maximum and minimum, respectively,
is the specific heat capacity of nitrogen at temperature
is the molar mass of nitrogen,
and
are the water flux maximum and minimum, respectively, and
is the ambient pressure.
For the MHM-PA model, the photoacoustic phase, PAP, is computed from the time shift, δ, between the maximum of laser intensity, and the maximum of
and
(
). Considering the cycle period, tp = ƒ−1 (inverse of the modulation frequency), we can express the PAP as follows:
(16)
(16)
The definition of the PAP in the previously used bEF-PA model differs from that of the MHM-PA model in EquationEquation (16)(16)
(16) :
(17)
(17)
where arg(z) is the argument of a complex number z,
is the ratio of the energies dissipated through mass flux to heat flux,
is the angular modulation frequency, and
is the thermal response time. When comparing the PAP of the MHM-PA model with previous data retrieved using the bEF-PA model (Roy, Diveky, and Signorell Citation2020), it needs to be taken into account that the definitions in EquationEquations (16)
(16)
(16) and Equation(17)
(17)
(17) are conceptually similar, but not identical. In the bEF-PA model, the photoacoustic signal, and thus, the
as described in EquationEquation (17)
(17)
(17) , is determined by solving a differential equation based on energy conservation, Fourier’s law for thermal conduction and Fick’s first law of diffusion (Murphy Citation2009; Diveky, Gleichweit, et al. Citation2020). The MHM-PA model however, extracts
directly from the temporal evolution of the particle and allows us to drop some of the assumptions listed in the work of Murphy (Murphy Citation2009) that were necessary before in the bEF-PA model to express the differential equations in the form of quasi steady state equations. Specifically, the assumption of small temperature gradients inside the particle is omitted, as it is the aim to determine such gradients, and with the explicit treatment of the time dependence the model avoids the use of quasi steady state equations. For the same reasons, it is not necessary to define a thermal response time in the MHM-PA model.
During the MHM-PA model simulation, the temperature and water concentration of each layer, the heat and mass flux between particle and surrounding gas, and the particle radius are saved every 100 time steps (i.e., every 200 ns) to reduce the amount of output data. The model is purely based on kinetics. Thus, during the first few steps of the simulation, small perturbations of the water concentration can occur, shifting the water concentration away from the equilibrium. This shift was corrected by a pre-simulation of 1.5 ms duration before starting the actual simulation. This ensures that the water concentration in every layer is corrected so that the mean water concentration () matches that of the equilibrium value at the given
and RH. The convergence of the MHM-PA model was tested by varying the time step and the layer thickness. All the parameters used in the model with references to their sources are listed in . The parameterizations adopted from The Dow Chemical Company (Citation2007) are also provided in the Data Repository connected to this article. The diffusion coefficients at 25 °C taken form Paduano et al. (Citation1998) are assumed to scale proportional to the quotient of temperature and temperature dependent viscosity of aqueous tetraethylene glycol (TEG) as parameterized in The Dow Chemical Company (Citation2007).
4. Results
4.1. Temporal profiles of temperature, water concentration, and droplet radius
shows typical temporal profiles of (a) the oscillation of laser intensity, (b) the temperatures in the different layers of the droplet, (c) the water concentration in different layers, and (d) the droplet radius oscillation computed with the MHM-PA model at a modulation frequency of 4 kHz for a TEG/H2O droplet of an average radius of 1 μm at 11% RH. Within one photoacoustic cycle (250 µs), the temperatures of all layers change by approximately 5 K, showing only small gradients between different layers (<0.4 K). The temperature oscillations are slightly more pronounced for layers that are closer to the center of the droplet, and the temperature differences between different layers are mainly restricted to the region around the maximum temperatures. Heat dissipation occurs only at the surface, where the heat flux is proportional to the difference between the surface temperature
and the ambient temperature
= 293.65 K. Neighboring layers equilibrate quickly, and only minor gradients build up throughout the droplets. Obviously, the thermal diffusion is fast compared to the modulation time scale of 4 kHz. As shown below, these gradients show non-trivial dependences on the droplet radius and the modulation frequencies.
In contrast to the temperature variations, the change in the water concentration during a cycle becomes increasingly pronounced for layers closer to the droplet’s surface (). At the surface, the mass flux mechanism adds or removes water which is subsequently exchanged with the lower lying layers via water diffusion. For layers inside the droplet (i > 10), only minor changes in the water concentration are observed. Substantial oscillations occur in the first approximately 6 layers; i.e., in a region approximately 300 nm deep into the droplet. The water concentration in the surface layer, for example, oscillates by up to approximately 17% (∼0.1 M) around the equilibrium concentration. The further away a layer is from the surface, the longer is the time delay between the maximum of the laser intensity and the minimum of the water concentration. The timescales of evaporation/condensation and water diffusion are comparable to the modulation time scale at 4 kHz. This explains the pronounced layer-dependent variations in the water concentration, and also the more pronounced effects in the concentration compared with those in the temperature (). Important for the latter is that water diffusion is around 2–3 orders of magnitude slower than heat diffusion ().
The temporal evolution of the droplet radius r is determined by the time-dependences of the thermal expansion and the water concentration. For the case shown in , there is almost no time delay between the maximum in the temperature (panel b) and the maximum in the radius (panel d). This indicates that here the thermal expansion is the main driver of the particle radius variation (see panels b and c). Our simulations identify this as the general behavior for micron-sized particles at medium to low RH. The droplet radius is only noticeably influenced by water evaporation and condensation for smaller droplets (r < 1.5 µm) at higher RH (high water concentration, > 10 M; graph not shown).
The MHM-PA model allows for accurate calculations of the heat and mass flux, and thus the photothermal response, even when pronounced temperature and concentration gradients are present within the droplet (e.g., at high modulation frequencies, for strong absorption of laser light by the droplet, and for large droplets). The MHM-PA model also provides access to temporal delays between different quantities, which, for example, provides direct information on the PAP (EquationEquation (16)(16)
(16) and Subsection 4.3). These pieces of information can either not be modeled accurately or not be obtained at all from the bEF-PA model.
4.2. Variation of temperature, concentration, and size with RH and average droplet size
shows the maximum deviations of the temperature (), water concentration (
), and droplet radius (Δr) defined in EquationEquations (18)–Equation(25)
(25)
(25) in a photoacoustic cycle as a function of the average droplet radius
and the relative humidity, RH. Results from the MHM-PA model are shown in the upper row, a–c, and results from the bEF-PA model in the lower row, d–e. All calculations are for a modulation frequency of 4 kHz. The range of
and RH corresponds to the ones considered in our previous work on mixed TEG/H2O droplets. (Diveky, Roy, et al. Citation2020)
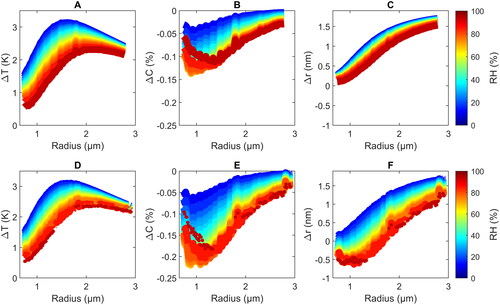
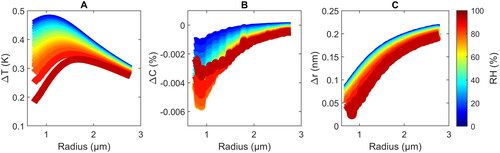
Figure 4. Simulated temperature amplitude (ΔT) (a and d), change of the water concentration ΔC in % mass (b and e) and change of the droplet radius Δr at the maximum temperature (c and f) as a function of the average droplet radius and RH (color scheme) during a PA cycle obtained with the MHM-PA model (a–c) and the bEF-PA model (d–f) for a modulation frequency of 4 kHz. The wiggles that are present in the graphs are caused by corresponding variations in the experimental mass accommodation coefficient used as input (Diveky et al. Citation2021).
The MHM-PA model () calculates as half of the difference between the maximum and minimum of the temperature averaged over all layers:
(18)
(18)
The bEF-PA model () computes from the quasi steady state equations as (Roy, Diveky, and Signorell Citation2020):
(19)
(19)
We note, here, that the two definitions are not identical, but are conceptually very close (an identical definition is not possible because of the differences in the models). For all droplet sizes, both models predict an inverse dependence of ΔT on the RH. This is a consequence of the more pronounced mass flux at higher RH, which enhances heat dissipation, and thus, reduces ΔT. Second, ΔT decreases with increasing RH because the TEG concentration in the droplet decreases, which results in lower light absorption from the IR laser. This stems from the fact that at 9.47 µm wavelength the water absorption coefficient is about one order of magnitude lower compared to TEG.
Both models predict an increase of with increasing droplet radius for radii up to
1.5–2 μm, which is caused by the increasing light absorption (increasing absorption cross section
with the droplet size). However, for even larger droplets, this trend reverses because of the slower thermal response time τ due to the larger heat capacity, while the thermal conductivity to the ambient gas phase remains the same. This effectively decreases the capacity of those droplets to respond to sudden changes in temperature. The absolute values of
show very good agreement between the two models. As discussed above, at a modulation frequency of 4 kHz, heat dissipation is comparatively fast and temperature gradients in the droplet are small (). If this holds, the bEF-PA model provides a good description of the temperature behavior and results from bEF-PA model should closely agree with those from the MHM-PA model – which is indeed the case (
in indicates a maximum change in the water concentration in mass (%) in a photoacoustic cycle defined as follows: The MHM-PA model () calculates
as half of the difference between the maximum and minimum of the concentration volume-weighed over all layers:
(20)
(20)
is the volume of layer
and
is the total particle volume. In the bEF-PA model (), the mass flux oscillation amplitude
(equation (3) in Diveky et al. (Citation2021)) is used to retrieve the mass of water that evaporates (e) or condenses (c) during one quarter of a cycle as:
(21)
(21)
where
is one quarter of the photoacoustic cycle time and stems from the integration of water loss over time (Diveky, Roy, et al. Citation2020). It can be used to determine the total water concentration
in the particle for the evaporation and condensation phase via:
(22)
(22)
is the average particle mass and
is the average water concentration in the particle. With this knowledge,
can be defined as half of the difference between the water concentrations during the evaporation and condensation phases:
(23)
(23)
For more details, refer to Diveky, Roy, et al. (Citation2020). These two definitions are conceptually the same but not identical (an identical definition is not possible because of the differences in the models).
Both models predict an increase of the absolute value of the concentration change, |ΔC|, with increasing droplet size in the range <0.8 − 1.3 μm reaching a maximum around 1 − 1.5 μm, but a decrease of |ΔC| toward higher radii. These trends with droplet size seem to qualitatively resemble those of ΔT in , which might be rationalized as follows: Higher (lower) ΔT result in higher (lower) |ΔC| because more (less) water evaporates for larger (smaller) changes in the temperature. However, with increasing droplet size also the average temperature
increases (due to increasing
), which is correlated with a decrease of the mass accommodation coefficient of water on aqueous TEG (Diveky et al. Citation2021), and hence, could explain the qualitative differences in the evolution between |ΔC| and ΔT with droplet size. The two models also show general agreement for the trends with RH. For larger droplets, |ΔC| increases with increasing RH. For smaller droplets, it first increases, and then, decreases with RH. These trends arise from a complex interplay of ΔT,
(increases with droplet size and with decreasing RH) and the mass accommodation coefficient, αM (decreases with increasing temperature and decreasing water concentration). While the trends of |ΔC| with size and RH are reproduced by both models, the absolute values differ by up to factor of approximately 2. These deviations could arise from the different definition of |ΔC| in the two models (see above) and from the pronounced gradients in the water concentration in the droplet (), which are not captured by the bEF-PA model resulting in an over-estimation of |ΔC|.
Δr in indicate a maximum change in the droplet radius during a photoacoustic cycle, defined as follows: The MHM-PA model () defines as the difference between the maximum and minimum radius:
(24)
(24)
where
denotes the particle volume, which depends on the Temperature
and water concentration
at time t. In the bEF-PA model (),
is calculated from the mass and density change during a cycle:
(25)
(25)
where
is the particle density at temperature T and water concentration C, and the plus or minus sign denote the condensation or evaporation case, respectively. For more details, refer to Diveky, Roy, et al. (Citation2020). Again, the two definitions are conceptually similar, but not identical (an identical definition is not possible because of the differences in the models).
Both models predict an inverse dependence of Δr on RH. This mainly reflects the decrease in thermal expansion with decreasing ΔT, which also shows an inverse dependence with RH (). The models generally predict an increase of Δr with increasing (). Again, the main factor for this behavior is likely the dependence of the thermal expansion on ΔT, modified by the influence of the change in water content convoluted with the change of the mass accommodation coefficient. The absolute values of Δr obtained from the two models agree well at low RH, but clearly deviate from each other at elevated RH. For example, above 40% RH the bEF-PA predicts negative Δr values for small radii in contrast to the MHM-PA model, which predicts positive Δr values for all RH. Such deviations arise because the bEF-PA model does not take into account any time-dependences of the various processes.
4.3. Modulation frequency
Since the MHM-PA approach explicitly models the time-dependence of heat and mass transfer processes, it allows us to properly describe the photothermal responses, in particular at high modulation frequencies, where the time scales of both heat and mass transfer are comparable with or even slower than the time scale of the modulation. Generally, this creates large temporal delays between the modulation of the laser excitation and the modulations of the temperature, water concentration and droplet radius, and it creates pronounced spatial gradients of the water concentration between the surface and the interior of the droplet (see below). In the following, we show selected results for modulation frequencies between approximately 4 and 100 kHz. The frequencies 12.5 kHz and 32.7 kHz were chosen because these are standard frequencies of commercially available quartz tuning forks.
shows MHM-PA results equivalent to , but for a higher modulation frequency of 32.7 kHz. Generally, one can summarize that during one photoacoustic cycle the higher modulation frequency results in smaller absolute changes of T and r by a factor of approximately 5, and in C by a factor of approximately 20. Furthermore, pronounced modulations of the water concentration becomes restricted to the outermost layers, while the inner layers experience only minor changes in C ( and ). Hence, only water transport in the outermost layers of the droplet is probed at high frequency. The higher modulation frequency in also creates larger temporal delays between the modulation of the laser excitation and the modulations of the temperature, the water concentration and the droplet radius compared with the lower modulation frequency in .
Figure 5. Simulated evolution of the normalized laser intensity (a), the temperature in the different layers (b), the water concentration in the different layers (c), and the droplet radius (d) as a function of time during several photoacoustic cycles at a modulated frequency of 32.7 kHz for a droplet with = 1 μm at 11% RH. Layer 1 (dark red) is the surface layer, layer 20 (dark blue) is the core layer.
show for ΔT, and Δr results equivalent to those in , but at a higher modulation frequency of 32.7 kHz. The trends of ΔT,
and Δr with RH and
are qualitatively the same as those at 4 kHz. The major differences compared with 4 kHz are the reduced absolute values of ΔT,
and Δr – a consequence of the fact that heat and mass transfer processes can no longer follow the fast modulation. For the temperature ( and ), for example, the relative differences between the different layers are more pronounced at 32.7 kHz than at 4 kHz, and they persist throughout the whole cycle because the particle temperature is never close to the ambient temperature of 293.65 K.
Figure 6. Simulated temperature amplitude (ΔT) (a), change of the water concentration ΔC in % mass (b), and change of the droplet radius Δr (c) as a function of the average droplet radius and RH (color scheme) during a PA cycle obtained with the MHM-PA model for a modulation frequency of 32.7 kHz. The wiggles that are present in the graphs are caused by corresponding variations in the experimental mass accommodation coefficient used as input (Diveky et al. Citation2021).
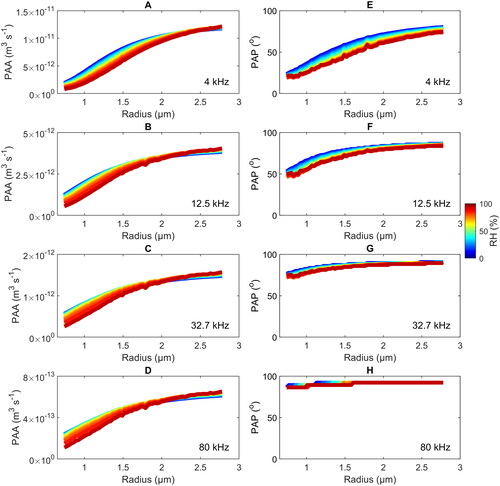
Similarly pronounced dependences on the modulation frequency are also found for the PAA and PAP, as illustrated in for the four modulation frequencies 4 kHz, 12.5 kHz, 32.7 kHz, and 80 kHz. Shown are MHM-PA simulations for the PAA (left) and the PAP (right) as a function of and RH. The results for 4 kHz are in agreement with our previous experimental results reported in Diveky, Roy, et al. (Citation2020). For all
and RH, the PAA (panels a to d) decreases by about two orders of magnitude with increasing frequency. Heat and mass transfer become increasingly subdued with increasing frequency, which results in a strong reduction of the PAA. Independently of the frequency and the RH, the model predicts an increase of the PAA with increasing droplet size. This can be attributed to the increasing absorption cross section with droplet size, which results in more pronounced heat and mass transfers, and thus, higher PAAs. The dependence of the PAA on the RH shows a more complex behavior: For small droplets, the PAA decreases with increasing RH, while the opposite behavior is observed for large droplets, resulting in crossing points that occur at lower radii for higher frequencies. The decrease of the PAA with RH for small droplets is the result of the lower absorption cross section due to the lower TEG (higher water) content at higher RH. The inversion of the trend for large particles is caused by the saturation of the heat flux contribution to the PAA due to the limited heat conductivity of the surrounding air in combination with an increasing mass flux contribution due to the higher water content at elevated RH (Diveky et al. Citation2019). With increasing modulation frequency, the PAP (panels e to h) converges toward a constant value of 90° for all
and RH, meaning that useful information on heat and mass transfer processes are largely lost in the PAP at high frequencies. At the lower frequencies, the PAP increases with
and decreases with RH (higher water content). The increases with
can be explained by the slower thermal response time of larger droplets, resulting in slower energy dissipation into the surrounding air, and thus, a higher phase delay. At elevated RH, both the heat and mass flux dissipation pathways are available to the droplet and lead to a faster energy dissipation, and thus, lower PAP.
Figure 7. Calculated PAA (A–D) and PAP (E–H) as a function of the droplet radius and the RH (color scheme) for modulation frequencies of 4 kHz (A and E), 12.5 kHz (B and F), 32.7 kHz (C and G), and 80 kHz (D and H). The noncontinuous behavior (steps, e.g., in E) arises from the chosen resolution of the saving-time. The trends are not influenced by the limited resolution.
The frequency dependence is further examined in for a droplet with a radius of 1 μm at 11% RH. During one modulation cycle, the maximum changes of the temperature ΔT (panel a), the water concentration |ΔC| (panel b), and the droplet radius Δr (panel c) first decrease substantially with increasing frequency, and then, at approximately 30–40 kHz converge to very low values (i.e., essentially no change from their respective average values
and
). The same holds for the PAP (panel d), which converges to a constant value of 90°, and for the PAA (panel e), which drops to a very small value that will be difficult to detected with state-of-the-art setups. The current photoacoustic cell setup at 4 kHz resonance frequency operates with a signal-to-noise ratio (SNR) of approximately 13 dB at a particle radius of approximately 1 µm and 5 mW of peak infrared laser power. Considering the signal drop shown in and assuming a 1/f-drop in signal response of a photoacoustic cell (Haisch Citation2012), while neglecting the microphone frequency response curve for this simple estimation, we would fall below 1 dB in SNR at approximately 18 kHz. The “noise” in panel d is an artifact caused by the finite resolution of the simulation.
Figure 8. Simulated temperature amplitude (ΔT) (a), change of the water concentration ΔC in % mass (b) and change of the droplet radius Δr (c), PAP signal (d), PAA signal (e), and the mass and heat contributions ( and
) to the PAA signal (f) as a function of modulation frequency for a droplet with a radius of 1 μm at 11% RH.
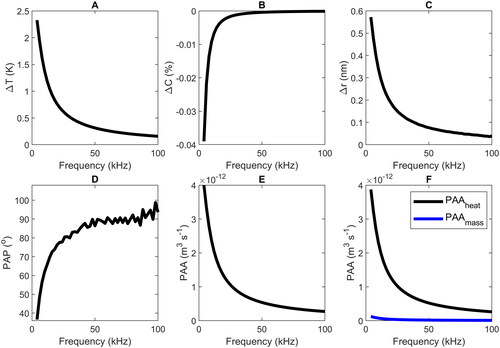
As aforementioned, this means that the information about heat and mass transfer in the PA signal is strongly reduced (PAP, ) and difficult to access (reduced PAA, ) at high frequencies, simply because these processes are too slow to follow the fast modulation. The current MMS detection system in our laboratory grants a SNR of approximately 15 dB at 1 µm radius, 5 mW of peak laser power and approximately 375 mW effective trapping laser power (532 nm), but it is not subject to a 1/f-decrease in system response due to its purely optical signal detection. The small sinusoidal change in r and T () at high frequency means that radius changes would reach the detection limit in the MMS experiments at about 80 kHz (Section 2). shows the heat and mass transfer contributions ( and
see EquationEquation (15)
(15)
(15) ) to the PAA. It illustrates that for small droplets at low RH, the contribution of the heat flux exceeds that of the mass flux by about one order of magnitude at all frequencies.
The aforementioned detection limits could be (possibly far) exceeded with higher IR laser power, yet this would imply a large departure from equilibrium conditions and significantly elevated average droplet temperatures, both of which are unfavorable for relaxation kinetics such as the retrieval of αM. Also, larger droplets produce a larger photoacoustic response and stronger MMS signal, but show a lower sensitivity to αM as the system leaves the transition regime and βM (EquationEquation (8)(8)
(8) ) approaches unity. To push the detection limit in MMS experiments, a higher trapping laser power might be considered, but one would have to account for droplet heating, cell heating, and cell response to modulated scattered light.
5. Conclusion
We apply a multilayer model based on kinetic diffusion to accurately describe heat and mass transfer in photoacoustic experiments (MHM-PA) of mixed water-tetraethylene glycol aerosol droplets with sizes between 0.75 µm and 3 µm and at relative humidities between 11% and 93%. The MHM-PA model explicitly simulates the time-dependence of heat and mass transfer processes, spatially resolved inside the droplet. Hence, it provides information on temporal variation of the droplet temperature, composition and radius during photoacoustic cycles. This is particularly relevant at high photoacoustic modulation frequencies, for which the usual assumption that heat and mass transfer are fast compared to the photoacoustic period no longer holds. However, comparison with a steady-state model (bEF-PA) shows that the MHM-PA is needed even at low frequency (4 kHz) for an accurate quantitative description.
We use the MHM-PA model to explore the dependence of the photoacoustic amplitude and the photoacoustic phase on the modulation frequency, the droplet radius and the relative humidity. The modulation frequency is varied between 4 kHz and 100 kHz. With increasing modulation frequency, the oscillations of the temperature, the composition and the radius of the droplet become increasingly dampened during a photoacoustic cycle and their phase delay with respect to the periodic excitation of the laser increases. At frequencies higher than approximately 30 kHz, heat and mass transfer processes are too slow to be able to follow the fast modulation. This results in a strong decrease of the photoacoustic amplitude by about two orders of magnitude over the studied frequency range, causing issues with the sensitivity of state-of-the art photoacoustic setups. For the amplitude, we still find characteristic dependencies on the droplet size and the humidity even at high modulation frequencies. Contrary to the amplitude, this information is almost entirely lost in the photoacoustic phase at higher frequency.
In previous studies, we have shown that at 4 kHz the phase is more suitable than the amplitude to retrieve mass accommodation coefficients from single particle photoacoustic experiments (Roy, Diveky, and Signorell Citation2020; Diveky et al. Citation2021). Using high modulation frequencies seem thus not recommendable for this application; possibly with one exception, i.e., the retrieval of true surface accommodation coefficients instead of total (surface and bulk) accommodation coefficients. At high frequency, mass exchange with the gas phase is limited to the surface region (). Photoacoustic amplitude measurements at high frequency could thus provide specific access to such surface mass accommodation coefficients.
Data Repository
Data needed to evaluate the conclusions of this article are deposited on the ETH Research Collection under the DOI 10.3929/ethz-b-000577390. Additional data related to this article may be requested from the authors.
Acknowledgment
The authors are very grateful to Dr. Sandra Roy for her contributions to the development of the initial bEF-PA model.
Additional information
Funding
References
- Ajtai, T., Á. Filep, M. Schnaiter, C. Linke, M. Vragel, Z. Bozóki, G. Szabó, and T. Leisner. 2010. A novel multi-wavelength photoacoustic spectrometer for the measurement of the UV–vis-NIR spectral absorption coefficient of atmospheric aerosols. J. Aerosol Sci. 41 (11):1020–9. doi:10.1016/j.jaerosci.2010.07.008.
- Arnott, P. W., H. Moosmüller, C. F. Rogers, T. Jin, and R. Bruch. 1999. Photoacoustic spectrometer for measuring light absorption by aerosol: Instrument description. Atmos. Environ. 33 (17):2845–52. doi:10.1016/S1352-2310(98)00361-6.
- Atkins, P. W. 1998. Physical chemistry. Oxford, Melbourne, Tokyo: Oxford University Press.
- Corrêa, S. F., L. Mota, L. B. Paiva, F. M. d Couto, M. G. d Silva, J. G. d Oliveira, M. S. Sthel, H. Vargas, and A. Miklós. 2011. Effects of ozone exposure on ‘Golden’ papaya fruit by photoacoustic phase-resolved method: Physiological changes associated with carbon dioxide and ethylene emission rates during ripening. J. Appl. Phys. 109 (11):114701. doi:10.1063/1.3592353.
- Covert, P. A., J. W. Cremer, and R. Signorell. 2017. Photoacoustic absorption spectroscopy of single optically trapped aerosol droplets. Proc. SPIE 10347, Optical Trapping and Optical Micromanipulation XIV, ed. Kishan Dholakia and Gabriel C. Spalding, 1034729, San Diego, CA, USA. doi:10.1117/12.2275627.
- Cremer, J. W., P. A. Covert, E. A. Parmentier, and R. Signorell. 2017. Direct measurement of photoacoustic signal sensitivity to aerosol particle size. J. Phys. Chem. Lett. 8 (14):3398–403. doi:10.1021/acs.jpclett.7b01288.
- Cremer, J. W., K. M. Thaler, C. Haisch, and R. Signorell. 2016. Photoacoustics of single laser-trapped nanodroplets for the direct observation of nanofocusing in aerosol photokinetics. Nat. Commun. 7:10941. doi:10.1038/ncomms10941.
- Davies, N. W., C. Fox, K. Szpek, M. I. Cotterell, J. W. Taylor, J. D. Allan, P. I. Williams, J. Trembath, J. M. Haywood, and J. M. Langridge. 2019. Evaluating biases in filter-based aerosol absorption measurements using photoacoustic spectroscopy. Atmos. Meas. Tech. 12 (6):3417–34. doi:10.5194/amt-12-3417-2019.
- Diveky, M. E., M. J. Gleichweit, S. Roy, and R. Signorell. 2021b. Data collection for: Shining new light on the kinetics of water uptake by organic aerosol particles. ETH Zürich Research Collection. doi:10.3929/ethz-b-000443481.
- Diveky, M., M. J. Gleichweit, S. Roy, E. Bartalucci, and R. Signorell. 2020. Photoacoustics of single aerosol droplets immobilised by counter-propagating optical tweezers. Proc. SPIE 11463, Optical Trapping and Optical Micromanipulation XVII, 1146316, Online Only. doi:10.1117/12.2566041.
- Diveky, M. E., M. J. Gleichweit, S. Roy, and R. Signorell. 2021. Shining new light on the kinetics of water uptake by organic aerosol particles. J. Phys. Chem. A 125 (17):3528–48. doi:10.1021/acs.jpca.1c00202.
- Diveky, M. E., S. Roy, J. W. Cremer, G. David, and R. Signorell. 2019. Assessing relative humidity dependent photoacoustics to retrieve mass accommodation coefficients of single optically trapped aerosol particles. Phys. Chem. Chem. Phys. 21 (9):4721–31. doi:10.1039/c8cp06980h.
- Diveky, M. E., S. Roy, G. David, J. W. Cremer, and R. Signorell. 2020. Fundamental investigation of photoacoustic signal generation from single aerosol particles at varying relative humidity. Photoacoustics 18:100170. doi:10.1016/j.pacs.2020.100170.
- Fan, J., Y. Wang, D. Rosenfeld, and X. Liu. 2016. Review of aerosol–cloud interactions: Mechanisms, significance, and challenges. Journal of the Atmospheric Sciences 73 (11):4221–52. doi:10.1175/JAS-D-16-0037.1.
- Gleichweit, M. J., M. Mohajer, D. Borgeaud, M. Diveky, G. David, and R. Signorell. 2022. Coupling between modulated Mie scattering and photoacoustic signal generation in optically trapped. Single aerosol particles. Proc. SPIE 12198, Optical Trapping and OpticalMicromanipulation XIX, 1219805. doi:10.1117/12.2633423.
- Gyawali, M., W. P. Arnott, R. A. Zaveri, C. Song, H. Moosmuller, L. Liu, M. I. Mishchenko, L. W. A. Chen, M. C. Green, J. G. Watson, et al. 2012. Photoacoustic optical properties at UV, VIS, and near IR wavelengths for laboratory generated and winter time ambient urban aerosols. Atmos. Chem. Phys. 12 (5):2587–601. doi:10.5194/acp-12-2587-2012.
- Haisch, C. 2012. Photoacoustic spectroscopy for analytical measurements. Meas. Sci. Technol. 23 (1):012001. doi:10.1088/0957-0233/23/1/012001.
- Haisch, C., and R. Niessner. 2012. Photoacoustic analyzer for the artifact-free parallel detection of soot and NO2 in engine exhaust. Anal. Chem. 84 (17):7292–6. doi:10.1021/ac3017899.
- Hale, G. M., and M. R. Querry. 1973. Optical constants of water in the 200-nm to 200-μm wavelength region. Appl. Opt. 12 (3):555–63. doi:10.1364/AO.12.000555.
- Hu, B., D. Chen, and Q. Su. 2006. Photoacoustic phase study on the frequency dependence of phase angle and triplet state lifetime of Nd(III)-acetylacetonate. Spectrochim. Acta. A Mol. Biomol. Spectrosc. 63 (1):55–9. doi:10.1016/j.saa.2005.04.028.
- Iulian, O., A. Stefaniu, O. Ciocirlan, and A. Fedeleş. 2010. Refractive index in binary and ternary mixtures with diethylene glycol, 1,4-dioxane and water between 293.15-313.15K. UPB Sci. Bul. Ser. B: Chem. Mater. Sci. 72:37–44.
- Kolb, C. E., R. A. Cox, J. P. D. Abbatt, M. Ammann, E. J. Davis, D. J. Donaldson, B. C. Garrett, C. George, P. T. Griffiths, D. R. Hanson, et al. 2010. An overview of current issues in the uptake of atmospheric trace gases by aerosols and clouds. Atmos. Chem. Phys. 10 (21):10561–605. doi:10.5194/acp-10-10561-2010.
- Lack, D. A., M. S. Richardson, D. Law, J. M. Langridge, C. D. Cappa, R. J. McLaughlin, and D. M. Murphy. 2012. Aircraft instrument for comprehensive characterization of aerosol optical properties, part 2: Black and brown carbon absorption and absorption enhancement measured with photo acoustic spectroscopy. Aerosol Sci. Technol. 46 (5):555–68. doi:10.1080/02786826.2011.645955.
- Lange, N. A. 2017. Langeś handbook of chemistry. New York: McGraw-Hill Education.
- Latif, I., M. Toda, and T. Ono. 2020. Hermetically packaged microsensor for quality factor-enhanced photoacoustic biosensing. Photoacoustics 18:100189. doi:10.1016/j.pacs.2020.100189.
- Linke, C., I. Ibrahim, N. Schleicher, R. Hitzenberger, M. O. Andreae, T. Leisner, and M. Schnaiter. 2016. A novel single-cavity three-wavelength photoacoustic spectrometer for atmospheric aerosol research. Atmos. Meas. Tech. 9 (11):5331–46. doi:10.5194/amt-9-5331-2016.
- Mason, B., N. L. Wagner, G. Adler, E. Andrews, C. A. Brock, T. D. Gordon, D. A. Lack, A. E. Perring, M. S. Richardson, J. P. Schwarz, et al. 2018. An intercomparison of aerosol absorption measurements conducted during the SEAC4RS campaign. Aerosol Sci. Technol. 52 (9):1012–27. doi:10.1080/02786826.2018.1500012.
- Mesquita, R. C., A. M. Mansanares, E. C. da Silva, P. R. Barja, L. C. M. Miranda, and H. Vargas. 2006. Open photoacoustic cell: Applications in plant photosynthesis studies. Instrum. Sci. Technol. 34 (1–2):33–58. doi:10.1080/10739140500373940.
- Moosmüller, H., R. K. Chakrabarty, and W. P. Arnott. 2009. Aerosol light absorption and its measurement: A review. J. Quant. Spectrosc. Radiat. Transf. 110 (11):844–78. doi:10.1016/j.jqsrt.2009.02.035.
- Mota, L., R. Toledo, R. T. Faria, E. C. da Silva, H. Vargas, and I. Delgadillo-Holtfort. 2009. Thermally treated soil clays as ceramic raw materials: Characterisation by X-ray diffraction, photoacoustic spectroscopy and electron spin resonance. Appl. Clay Sci. 43 (2):243–7. doi:10.1016/j.clay.2008.07.025.
- Murphy, D. M. 2009. The effect of water evaporation on photoacoustic signals in transition and molecular flow. Aerosol Sci. Technol. 43 (4):356–63. doi:10.1080/02786820802657392.
- Paduano, L., R. Sartorio, G. D'Errico, and V. Vitagliano. 1998. Mutual diffusion in aqueous solution of ethylene glycol oligomers at 25 °C. Faraday Trans. 94 (17):2571–6. doi:10.1039/a803567i.
- Raspet, R., W. V. Slaton, W. P. Arnott, and H. Moosmuller. 2003. Evaporation-condensation effects on resonant photoacoustics of volatile aerosols. J. Atmos. Oceanic Technol. 20 (5):685–95. doi:10.1175/1520-0426(2003)20<685:ECEORP>2.0.CO;2.
- Roy, S., M. E. Diveky, and R. Signorell. 2020. Mass accommodation coefficients of water on organics from complementary photoacoustic and light scattering measurements on laser-trapped droplets. J. Phys. Chem. C 124 (4):2481–9. doi:10.1021/acs.jpcc.9b09934.
- Rumble, J. R. 2017. CRC handbook of chemistry and physics. 98th ed. Boca Raton, FL: CRC Press.
- Sani, E., and A. Dell’Oro. 2014. Optical constants of ethylene glycol over an extremely wide spectral range. Opt. Mater. 37:36–41. doi:10.1016/j.optmat.2014.04.035.
- Shiraiwa, M., C. Pfrang, T. Koop, and U. Pöschl. 2012. Kinetic multi-layer model of gas-particle interactions in aerosols and clouds (KM-GAP): Linking condensation, evaporation and chemical reactions of organics, oxidants and water. Atmos. Chem. Phys. 12 (5):2777–94. doi:10.5194/acp-12-2777-2012.
- Shiraiwa, M., C. Pfrang, and U. Pöschl. 2010. Kinetic multi-layer model of aerosol surface and bulk chemistry (KM-SUB): The influence of interfacial transport and bulk diffusion on the oxidation of oleic acid by ozone. Atmos. Chem. Phys. 10 (8):3673–91. doi:10.5194/acp-10-3673-2010.
- Stephens, M. A., and W. S. Tamplin. 1979. Saturated liquid specific heats of ethylene glycol homologs. J. Chem. Eng. Data 24 (2):81–2. doi:10.1021/je60081a027.
- The Dow Chemical Company. 2007. "Tetraethylene glycol." Form No. 612-00005-0207X CRCG. Accessed December 2015. http://msdssearch.dow.com.
- Winkler, P. M., A. Vrtala, R. Rudolf, P. E. Wagner, I. Riipinen, T. Vesala, K. E. J. Lehtinen, Y. Viisanen, and M. Kulmala. 2006. Condensation of water vapor: Experimental determination of mass and thermal accommodation coefficients. J. Geophys. Res. 111 (D19):D19202. doi:10.1029/2006JD007194.
- Zelaya‐Angel, O., J. J. Alvarado‐Gil, R. Lozada‐Morales, H. Vargas, and A. Ferreira da Silva. 1994. Band‐gap shift in CdS semiconductor by photoacoustic spectroscopy: Evidence of a cubic to hexagonal lattice transition. Appl. Phys. Lett. 64 (3):291–3. doi:10.1063/1.111184.