?Mathematical formulae have been encoded as MathML and are displayed in this HTML version using MathJax in order to improve their display. Uncheck the box to turn MathJax off. This feature requires Javascript. Click on a formula to zoom.
Abstract
Water-insoluble aerosol particles (WIAPs), such as black carbon (BC), mineral dust, and primary biological aerosol particles (PBAPs), affect climate through their interaction with radiation and clouds. However, with the exception of BC, methods to identify WIAP types and quantify their number concentrations are limited. Here, we evaluated a method that has been recently developed to measure the number concentrations of submicron WIAPs based on atmospheric aerosol measurements at an urban site in Nagoya, Japan. In this method, atmospheric aerosol particles are collected on a filter and dispersed in water. Then, the complex forward-scattering amplitudes of individual particles are measured. This complex parameter reflects the complex refractive index, volume, and shape of each measured particle, enabling the characterization of these physical properties from the signals. The WIAPs were classified as BC-like, dust-like, and PBAP-like particles based on their complex amplitude data. The number concentrations of BC-like particles were strongly correlated with those of refractory BC particles measured by a Single Particle Soot Photometer. BC-like and dust-like particles dominated the population of the submicron WIAPs, which was also confirmed using electron microscopy and Wideband Integrated Bioaerosol Sensor observations. Under the observed atmospheric conditions, the number concentrations of WIAPs were measured with their dispersion efficiency from a filter to water of approximately 50%. These results indicate that our method based on filter sampling and complex forward-scattering amplitude measurements has the potential to become a new technique for quantifying the spatio-temporal distributions of WIAPs.
Editor:
1. Introduction
Water-insoluble aerosol particles (WIAPs) in the atmosphere, including mineral dust, black carbon (BC), primary biological aerosol particles (PBAPs), metal oxides, and some insoluble organics, have a range of climatic and environmental impacts because of their abundance and unique properties. For example, mineral dust contributes significantly to overall aerosol loading and aerosol optical depth, and therefore it directly affects the Earth’s radiation budget (Ridley et al. Citation2016; Kok et al. Citation2017). Mineral dust has light-absorbing properties and can reduce surface albedo when deposited on ice or snow (Painter et al. Citation2007; Mahowald et al. Citation2014). It also impacts the biogeochemical cycles of the ocean and land by transporting and depositing nutrients (Martin, Gordon, and Fitzwater Citation1991; Mahowald et al. Citation2014). WIAPs are considered to serve as ice nucleating particles (INPs) and influence the temporal evolution and optical properties of clouds through the formation of ice crystals (Kanji et al. Citation2017). Chemical interactions of WIAPs with atmospheric trace gases and other water-soluble aerosols are also of significant interest and have been extensively investigated (Sullivan et al. Citation2007; Zhang et al. Citation2008; Karydis et al. Citation2016). Thus, accurate measurements of the abundance of each type of WIAPs are essential for assessing their impacts on the climate and environment.
Identification and sizing of WIAPs at the single-particle level are of fundamental importance to understand their number- and size-dependent atmospheric processes and resultant climatic impacts (e.g., Mahowald et al. Citation2014; Fan et al. Citation2016). For this reason, single-particle analysis of each type of WIAPs has been performed using several different measurement approaches with advantages and disadvantages. Single-particle mass spectrometry approaches, such as aerosol-time-of-flight mass spectrometry, can measure the elemental composition of aerosols and distinguish between a wide variety of particle types (e.g., Cornwell et al. Citation2022). A combination of single-particle mass spectrometers with other online optical particle counters has been proposed to quantify the number concentrations of mineral dust particles (Froyd et al. Citation2019). However, quantifying absolute concentrations using single-particle mass spectrometry is yet challenging, mainly due to uncertainties in the transmission, detection, and ionization efficiencies for each particle type (Murphy Citation2007; Marsden et al. Citation2019). Although an electron microscope is also a powerful tool to reveal the morphology and elemental composition of individual particles (e.g., Adachi et al. Citation2022), the absolute abundance of each particle type is often difficult to quantify. Among WIAPs, BC and magnetite are unique species whose size-resolved number concentrations are quantified accurately within the detectable diameter range of the instrument used. For example, the laser-induced incandescence technique allows for the selective detection of BC and light-absorbing iron oxides such as magnetite (Schwarz et al. Citation2006; Moteki and Kondo Citation2010; Yoshida et al. Citation2016).
The single-particle extinction and scattering (SPES) method is an optical technique that primarily targets submicron particles (Potenza, Sanvito, and Pullia Citation2015; Moteki Citation2020). The SPES method detects interference of an incident laser beam and forward-scattered light from a particle dispersed in water, and thus measures the complex forward-scattering amplitude of the particle. The complex amplitude is a complex parameter that reflects the physical properties (i.e., complex refractive index, volume, shape, and orientation) of the particle. Hence, SPES has the potential to detect and quantify different types of atmospheric WIAPs if their liquid suspensions are subjected to the measurements. Cremonesi et al. (Citation2020) developed an instrument for the optical detection of ambient particles based on the SPES method. This instrument measures both water-soluble and water-insoluble particles in ambient air because particles in an air flow are measured, and focuses on the optical properties averaged over the particle population considered.
To identify and count ambient WIAPs, we must disperse the targeted particles in water prior to measurements when using an SPES instrument developed for liquid suspensions. One possible means of achieving this is to continuously collect particles directly into water (e.g., Weber et al. Citation2001; Greenwald et al. Citation2005; Orsini et al. Citation2008; Cho et al. Citation2019). Such a semi-online method may allow measurements of WIAP concentrations with relatively high time resolution. A problem with this technique is that most particle collection systems target water-soluble components, and water-insoluble particles may not be efficiently transferred to the liquid stream (e.g., Peltier, Weber, and Sullivan Citation2007). Wet-cyclone systems have been developed to overcome this difficulty and have been shown to have high (>90%) collection efficiencies for polystyrene latex particles and bioaerosol samples (e.g., Orsini et al. Citation2008; Cho et al. Citation2019). Nevertheless, experimental studies on integrating such particle collection systems with an SPES instrument are required to establish a semi-online method.
Alternatively, an offline approach can be used, i.e., aerosol particles are collected on filters and then dispersed in water prior to being subjected to analysis. The offline approach may allow for a more robust transfer of ambient WIAPs into water and would be less expensive than the semi-online method. Therefore, the offline method is suitable for long-term measurements of WIAPs in various environments. Offline WIAP analysis also has the advantage that its results can be directly compared with those obtained by chemical analysis, INP concentration analysis, and electron microscopy analysis of segments of the same filter sample.
Here, we evaluated an SPES-based method for quantifying the types and number concentrations of WIAPs in the atmosphere using ambient aerosol particles dispersed in water. First, we conducted laboratory experiments with size-standard polystyrene particles to determine the particle sensing area of the SPES instrument and the dispersion efficiency of particles collected on a polycarbonate filter into water. Then, we analyzed ambient aerosol particles collected on filters in Nagoya, Japan. To evaluate the validity of our method, we compared the number concentrations of WIAPs determined with the offline method with those obtained with the online measurements.
2. Methods
2.1. SPES instrument
The SPES instrumentation and parameter definitions used in this study are based on Moteki (Citation2020). Briefly, the complex forward-scattering amplitude (S22) of individual particles is measured by focusing a Gaussian laser beam (wavelength 632.8 nm) onto particles in water and detecting the interference between the incident beam and the forward-scattered light. In a flow cell with parallel plates, individual particles are detected when they pass near the center of the focused beam (i.e., particles passing within a specific sensing area are detected. See Figure S1 in the Supplement). It should be noted that the SPES instrument does not use a sample/sheath flow configuration, which is commonly used in aerosol instruments with an optical detection system. The SPES instrument used in this study is the same as that of Moteki (Citation2020) except for using the custom-made fused-quartz glass flow cell with a 50-µm thickness, 3.0-mm width, and 40-mm length (Japan Cell CO., Ltd.) instead of that with a 40-µm thickness, 3.0-mm width, and 35-mm length, and for using the beam expander with 5× magnification instead of that with 10× magnification (GBE5-A and GBE10-A, respectively, Thorlabs Inc.). The spot size at the beam waist was estimated to be 4.75 µm, where the medians of the real and imaginary parts of the S22 data for polystyrene latex (PSL) spheres (mean diameters of 0.508, 0.702, and 0.903 µm) agree with the theoretical values within 15%. Examples of the theoretical and experimental S22 values for particles with specific physical properties are shown in in Appendix.
The number concentration of suspended particles detectable by the SPES instrument in water (C [m−3]) is expressed by the following equation:
(1)
(1)
where R [s−1] is the particle detection rate after correction by the duty cycle of the computer of the SPES instrument for recording particle signal data, A [m2] is the effective detection area perpendicular to the sample flow in the SPES flow cell, and U [m s−1] is the average velocity of the sample water in the flow cell. The effective detection area depends on a setting value of the SPES instrument to select waveform signals of the particles passing near the center of the laser beam. The criterion for this selection follows Section 2.3 of Moteki (Citation2020). The value of A was determined by laboratory experiments using PSL spheres (see Sections 2.4.1.1 and 3.1; A ∼20 µm2). The value of U was set at ∼0.15 m s−1 (i.e., a sample flow rate of ∼1.4 mL min−1).
It should be noted that the flow velocity distribution in the flow cell might be approximated by a one-dimensional parabolic function of the particle position (i.e., a two-dimensional Poiseuille flow), assuming a laminar flow condition in the flow cell with a high aspect ratio of 60. However, in this study, the value of A was determined by laboratory experiments using the average velocity (Section 2.4.1.1), and thus the effect of the flow distribution on the quantification of particle number concentration was incorporated in the A value. In other words, the A is a virtual value determined by assuming a plug flow in the flow cell.
Because the SPES is a nondestructive particle analysis method, we continuously measured suspended particles by circulating sample water using a peristaltic pump (i.e., the inlet and outlet tubing were set in sample water in a glass vial). We used an average R value during a sample measurement to obtain the C value by EquationEquation (1)(1)
(1) . Fluctuations of the particle detection rate during each sample measurement were discussed in Section 3.2.1.
Since the time window of the data acquisition for single-particle signal detection of the SPES instrument was 200 µs, the particle detection rate should be sufficiently lower than 5000 s−1 to avoid a simultaneous detection of multiple particles (i.e., coincidence errors). This upper limit of the detection rate corresponded to the number concentration of suspended particles of ∼1015 m−3. Throughout this study, the particle detection rate was 1–3 orders lower than 5000 s−1; thus, coincidence errors were negligible.
2.2. Particle collection on a filter and dispersion into water
Laboratory PSL spheres and ambient aerosol particles were collected on a polycarbonate filter (Whatman Nuclepore track-etched membrane filter; diameter 47 mm and pore size 0.2 µm) supported by a filter cassette screen (part no 59-005147-0010, Thermo Fisher Scientific Inc.). The polycarbonate filter had a pore density of about 2.9 × 108 cm−2 (taken from the product’s datasheet) and collected particles on the surface or inside the pores of the filter (Ogura et al. Citation2016). The same type of filter has been used for measurements of INP number concentrations in previous studies (e.g., Tobo et al. Citation2019, Citation2020). The filter was mounted in a NILU (Norwegian Institute for Air Research) inline filter holder for laboratory experiments and in a custom-made stainless-steel holder for atmospheric observations. The flow rates for the sampling were 1 L min−1 and 7 L min−1 at standard temperature and pressure (STP, 0 °C and 1 atm) for the laboratory experiments and atmospheric observations, respectively. Information on aerosol sample lines and their particle transmission efficiencies for the atmospheric observations are given in Table S1 and Figure S2. Filters were pre-rinsed with Milli-Q water and methanol for the laboratory experiments and cleaned by sonification for 9 min in Milli-Q water for the atmospheric observation. For the dispersion of particles collected on a filter into water, the filter sample was transferred to a 15-mL glass vial, immersed in Milli-Q water, and sonicated with a three-frequency (28, 45, and 100 kHz) ultrasonic cleaner (VS-100III, AS ONE Corporation) for 9 min. It should be noted that the original shape and mixing states of particles when they were in ambient air may change during the measurement processes, including particle collection and dispersion into water. We did not directly assess the possible changes in particle size of WIAPs due to the effects of coagulation and sonication in water; however, a previous study showed that the change in the size distributions of BC particles due to these effects in rainwater samples was small (Ohata et al. Citation2013).
The number concentration of WIAPs in air (N [m−3]) collected on a filter is obtained by the following equation:
(2)
(2)
where Va [m3] is the total air volume aspired during particle collection on the filter, Vw [m3] is the volume of water used for dispersion of particles collected on the filter, Εc [dimensionless (-)] is the particle collection efficiency of the filter, Εd [-] is the dispersion efficiency of particles collected on the filter in water (i.e., Εd = 0 means all particles remain on the filter and Εd = 1 means complete dispersion into water), and F [-] is the mass ratio of the analyzed filter to the whole filter (e.g., F = 0.5 if the filter is cut in half before analysis). We confirmed that Εc > 0.997 for particles larger than 0.3 µm at a volumetric flow rate of 1.0 L min−1 by measuring the size-resolved number concentrations of ambient aerosols in Nagoya, Japan, upstream and downstream the filter with an Optical Particle Sizer (Section 2.3). In this study, Εc = 1 was assumed. The value of Εd was evaluated through laboratory experiments using PSL spheres (Section 2.4.1.2) and ambient measurements of BC particles (Section 2.4.2).
2.3. Other instruments
A single particle soot photometer (SP2; Model SP2-D, Droplet Measurement Technologies) was used to measure the number concentrations of BC particles in ambient air. The SP2 uses a laser-induced incandescence technique to detect individual BC particles. A detailed description of the SP2, including calibration methods, is given elsewhere (Schwarz et al. Citation2006; Moteki and Kondo Citation2010). The number size distributions of BC were measured in the mass-equivalent diameter range of 0.071–0.65 µm, assuming a void-free density for BC of 1.8 g cm−3. Information on the inlet tubing and transmission efficiencies for the ambient measurements is given in Table S1 and Figure S2. For particles with a density of 1.8 g cm−3 and a dynamic shape factor of 1.5, the transmission efficiency was calculated to be >0.96 for particles within the detectable diameter range of the SP2, based on theoretical formulas (Brockmann Citation2011).
An Optical Particle Sizer (OPS, Model 3330, TSI Inc.) was used to measure particle number concentrations in 16 size bins in the diameter range of 0.3–10 µm for both the laboratory experiments and ambient measurements. Refractive indices of 1.59 + 0i and 1.50 + 0i at the wavelength of 660 nm were assumed for the laboratory experiments and atmospheric measurements, respectively.
A Wideband Integrated Bioaerosol Sensor (WIBS; Model WIBS-NEO, Droplet Measurement Technologies) was used to measure fluorescent biological aerosol particles in ambient air. A detailed description of the WIBS is given elsewhere (Perring et al. Citation2015; Hernandez et al. Citation2016; Savage et al. Citation2017). Briefly, the WIBS uses two xenon flash lamps as excitation light sources with wavelengths of 280 and 370 nm and two emission detectors for wavelength bands of 310–400 and 420–650 nm. Following Perring et al. (Citation2015) and Savage et al. (Citation2017), the fluorescent particles can be classified into seven particle groups based on their excitation-emission wavelength pairs and their combinations: types A, B, C, AB, BC, AC, and ABC. The background signal was checked every 8 h by excitation pulses fired into an optical chamber under particle-free conditions. As a threshold value for fluorescence intensity, the mean instrument background (forced trigger; FT) + 3 standard deviations (3σ) and FT + 9σ were both used in the data analysis. Although FT + 3σ is commonly used as the threshold, FT + 9σ is recommended to eliminate non-biological particles such as mineral dust and BC that can emit weak fluorescence (Savage et al. Citation2017). The nominal diameter range of the detectable particles is from 0.5 to 30 µm; however, this study limited the diameter range for the data analysis to 0.5–10 µm, considering the particle loss in the inlet tubing (Figure S2). No correction based on the transmission efficiency (Figure S2) was applied for calculating particle number concentrations for all instruments.
In addition to the online instruments described above, a scanning electron microscope (SEM, SU 3500, Hitachi High-Technologies) with an energy dispersive X-ray spectrometer (EDS, X-max 50 mm, Horiba Ltd.) (Adachi et al. Citation2013) was used to analyze the number fractions of WIAPs collected on the polycarbonate filters used for the SPES measurements.
2.4. Experimental setup
2.4.1. Laboratory experiments
2.4.1.1. Effective detection area of the SPES instrument
The effective detection area can be experimentally determined using PSL particles with known number concentrations in water. From EquationEquation (1)(1)
(1) , the effective detection area, A, is represented by the following equation:
(3)
(3)
The number concentrations of PSL particles in water were pre-determined by placing a PSL suspension in a rectangular glass cell and measuring the attenuation of a laser beam, as described in Ohata et al. (Citation2013). A 532-nm laser and a photodiode sensor (CPS532 and S120C, Thorabs GmbH) were used. The mean diameters of the PSL spheres were 0.303, 0.345, 0.508, 0.702, 0.903, and 1.036 µm. We obtained two data for each size of PSL spheres through experiments on four different days. On each experimental day, we prepared PSL suspensions for specific sizes, determined number concentrations by laser attenuation measurements, and measured suspensions with the SPES instrument. PSL suspensions were shaken by hand before the measurements to disperse particles uniformly. The pre-determined number concentrations of PSL suspensions ranged from 4.8 × 10¹² to 2.8 × 10¹⁴ m−3. Some suspensions were diluted to the concentration order of 1012 –1013 m−3 before the SPES measurements.
2.4.1.2. Dispersion efficiency of particles collected on filters
The experimental setup for evaluating dispersion efficiency is shown in . The PSL spheres with diameters of 0.508, 0.702, and 0.903 µm were aerosolized by an atomizer (Model 3079 A, TSI Inc.) and collected on polycarbonate filters, and the number concentrations of PSL particles in the air were monitored by the OPS. The PSL particles collected on the filters were dispersed in water and their number concentrations in water were measured by the SPES instrument. From EquationEquation (2)(2)
(2) , the dispersion efficiency Εd is represented by the following equation:
(4)
(4)
Figure 1. Schematic diagram of the experimental setup for evaluating the dispersion efficiency of polystyrene latex (PSL) particles. PSL particles collected on a polycarbonate filter were dispersed in water and measured with a single-particle extinction and scattering (SPES) instrument. SG, silica gel; HEPA filter, high-efficiency particulate air filter; MFC, mass flow controller; OPS, Optical Particle Sizer; LPM, liter per minute.
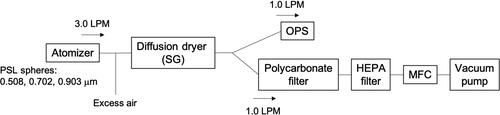
The contributions of number concentrations from coagulated PSL spheres (i.e., doublets or triplets) were excluded from the data analysis. Based on the measured number size distributions by the OPS, we regarded the PSL particles with optical diameters larger than 0.7 µm as coagulated spheres of 0.508 µm. Similarly, particles larger than 1.0 and 1.3 µm were considered to be coagulated particles of PSL spheres of 0.702 and 0.903 µm, respectively. For the measurements of PSL suspensions by the SPES instrument, particles with Re(S22) larger than specific values were regarded as coagulated PSL spheres for each size. For both measurements by the OPS and SPES, the number concentrations of these coagulated particles were less than 5% of singlet PSL particles. The whole filters were analyzed (i.e., the filters were not cut before analysis) and thus F was unity for this experiment.
2.4.2. Ambient measurements
Aerosol sampling and online measurements were conducted at the Higashiyama Campus of Nagoya University (35.15°N, 136.97°E) from 27 April to 20 May, 2021. Nagoya is located in the Chukyo metropolitan area (population of 9 million), and the studied aerosols were strongly influenced by local traffic and industrial sources. Filter samples were collected every 1–3 days. While the sample collections were primarily conducted every two days, occasionally, 1-day samples were collected to increase the number of samples. Due to inevitable reasons, the sampling duration for one of the samples was extended to 3 days. Consequently, we obtained eight 2-day samples, four 1-day samples, and one 3-day sample. Information on the sampling time and accumulated air volume for each sample is given in Table S2. Three blank samples were collected during the observation period. After the sampling, each filter was cut approximately in half. The filter cuts were weighed to determine the values of F in EquationEquation (2)(2)
(2) . The collected particles were immediately dispersed in water and analyzed by the SPES instrument. The weight of the water used for dispersion was measured, and Vw was calculated assuming the water density of 1.0 g cm−3. The value of Vw was approximately 12 mL. The typical measurement time by the SPES instrument was 10 min per sample, corresponding to the accumulated water volume introduced to the instrument of ∼14 mL. The remaining filter cuts were stored in a freezer at −20 °C, and two were used for electron microscopy analysis. The online instruments (SP2, OPS, and WIBS) were operated during the observation period, as described in Section 2.3.
3. Results and discussion
3.1. Laboratory experiments
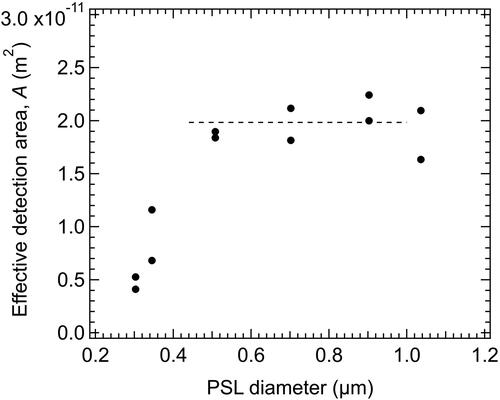
Effective detection area, A, was measured using PSL particles with diameters of 0.303–1.036 µm (). In our instrumental setup, the value of A was (1.98 ± 0.17) × 10−11 m2 (mean ± 1σ) for PSL particles in the diameter range of 0.508–0.903 µm. For particles with a diameter smaller than 0.345 µm, the waveform signals approached the background noise level, resulting in an increase in the number fraction of undetected particles (i.e., a decrease in the A value). Some saturated signals were observed for particles with a diameter of 1.036 µm and excluded from data analysis, also suggesting a decrease in the A value for particles larger than 1.036 µm. In the subsequent parts of this study, a constant value of 1.98 × 10⁻¹¹ m2 was used to derive the number concentrations of particles in water by EquationEquation (1)(1)
(1) .
Figure 2. Effective detection area of the single-particle extinction and scattering (SPES) instrument. The dashed line indicates the mean value for polystyrene latex (PSL) particles with diameters of 0.508, 0.702, and 0.903 µm.
Dispersion efficiency, Εd, was measured five times using PSL particles with diameters of 0.508–0.903 µm. The Εd value was 0.68 ± 0.18 (mean ± 1σ), indicating that the majority of the PSL particles collected on the filters were dispersed in water. No clear dependence of the Εd values on particle size was observed. For the ambient measurements described in Section 3.2, we assumed Εd = 1 because the dependence of the Εd value on particle chemical composition is unknown.
3.2. Ambient measurements
3.2.1. Classification of atmospheric WIAPs
The complex amplitude data for all measured WIAPs from the series of ambient filter samples are shown in and b. Using the parameter definitions by Moteki (Citation2020), the real part of S22 and the imaginary part of S22 with scattering correction were denoted as Re(S22) and [Im(S22)]sc, respectively. Waveform signals for particles with [Im(S22)]sc > 2.2 were considered saturated and thus excluded from further analysis.
Figure 3. (a) Complex amplitude (S22) data for all particles from filter samples collected in Nagoya, Japan. The colored bar indicates the number of particles. Waveform signals for particles with [Im(S22)]sc > 2.2 were considered saturated and thus excluded from further analysis. (b) Same as (a) but expanded to show S22 data for smaller particles. (c) Data area on the S22 scatter plot for particle classification into BC-like, dust-like, and PBAP-like particles. Lines for classification are also shown in panels (a) and (b).
![Figure 3. (a) Complex amplitude (S22) data for all particles from filter samples collected in Nagoya, Japan. The colored bar indicates the number of particles. Waveform signals for particles with [Im(S22)]sc > 2.2 were considered saturated and thus excluded from further analysis. (b) Same as (a) but expanded to show S22 data for smaller particles. (c) Data area on the S22 scatter plot for particle classification into BC-like, dust-like, and PBAP-like particles. Lines for classification are also shown in panels (a) and (b).](/cms/asset/0ba5aac2-760c-4619-accc-f79299e28dcb/uast_a_2223387_f0003_c.jpg)
Particles without signal saturation were classified into three categories: BC-like, dust-like, and PBAP-like particles, by defining separation lines on the S22 scatter plot (). The separation lines were primarily based on the plotting areas obtained from the laboratory samples () and were adjusted to approximately cover the densely distributed regions of the S22 scatter plot in . BC-like particles were defined as a group of particles satisfying [Im(S22)]sc > (Re(S22))3 + 0.8 × Re(S22). Although BC particles are indistinguishable from some light-absorbing iron oxide particles due to their overlapping S22 data (Yoshida, Moteki, and Adachi Citation2022), it is expected that the abundance of light-absorbing iron oxide particles in this group is much smaller than that of BC particles because their atmospheric number concentrations have been reported to be several orders of magnitude lower than those of BC particles in various environments including urban atmosphere in East Asia (Moteki et al. Citation2017; Ohata et al. Citation2018; Yoshida et al. Citation2020).
Dust-like particles were defined as particles whose S22 data were within the theoretically calculated range of S22 values for spheres with a refractive index of 1.45–1.65 at a wavelength of 632.8 nm and without absorption at this wavelength. The reported values of the effective refractive index for silicate particles are in the range of 1.45–1.65, as shown in Yoshida, Moteki, and Adachi (Citation2022, Table 2 of that study). We defined the dust-like region by assuming a spherical shape and a specific range of refractive indices, although the distribution of S22 data for ambient mineral dust particles can be more strongly affected by variations in their shape, rather than by variations in their refractive index (i.e., variations in their chemical composition).
The range of the real part of the complex refractive index for PBAP-like particles was assumed to be 1.33–1.40. Although a broad range of values (1.3–1.7 at visible wavelength) was previously reported for different bioaerosols (Hu et al. Citation2019), this study assumed that PBAP-like particles have a refractive index closer to that of water. Furthermore, we assumed |S22| > 0.2 to define PBAP-like particles () because the number concentrations of PBAPs were much lower than mineral dust particles in Nagoya (as discussed in Section 3.2.3), and their overlapping S22 data increased the uncertainty in discriminating PBAPs from mineral dust particles, especially for smaller particles ().
Some theoretical S22 values were compared with the observed S22 data in in the Appendix. Based on these results, the volume-equivalent diameter range detectable with our SPES instrument was estimated to be about 0.25–0.70 µm for BC-like particles and 0.35–1.4 µm for dust-like particles. Although the range for PBAP-like particles was estimated as about 0.65–2.0 µm, the estimated particle size is highly sensitive to the assumed value of the real part of the complex refractive index between 1.33 and 1.40 ().
Three blank filters were collected during the observation period, and the average number of BC-like, dust-like, and PBAP-like particles per filter were 2.1 × 10⁴, 1.9 × 10⁵, and 6.0 × 10⁴, respectively. These values correspond to 0.18%, 1.2%, and 7.1% of the averages of the quantified numbers of ambient BC-like, dust-like, and PBAP-like particles collected on the filters during the observation period. The blank data were not subtracted from the sample data when calculating particle concentrations.
The fluctuation of the particle detection rate by the SPES instrument during each sample measurement was analyzed. Figure S3 shows typical examples of particle counts per minute during the measurement time. For relatively high-concentration samples (), where the raw particle detection rate exceeded 40, 90, and 3 min−1 for BC-like, dust-like, and PBAP-like particles, we measured the samples for 10 min. The relative standard deviations of the particle detection rates during the 10 min measurements of these samples were approximately 15%, 5%, and 23% for BC-like, dust-like, and PBAP-like particles, respectively. For relatively low-concentration samples (), where the raw particle detection rates were lower than 20, 40, and 3 min−1 for BC-like, dust-like, and PBAP-like particles, we measured the samples for longer time (30 min and 50 min in these cases) to determine the concentrations with reduced statistical uncertainties. For these samples, the relative standard deviations of the particle detection rate were approximately 30%, 20%, and 100% for BC-like, dust-like, and PBAP-like particles, respectively. No clear increasing or decreasing trends of particle detection rates were observed for BC-like, dust-like, and PBAP-like particles during the measurement time, supporting the homogeneity of the measured samples and suggesting that the particle loss during measurements due to the attachment to the wall of the glass vial, tubing, and flow cell was not significant.
3.2.2. BC-like particles
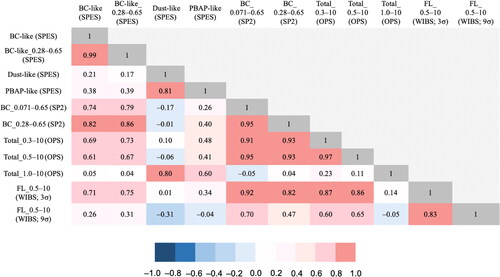
shows the time series of the number concentrations of BC-like particles measured by SPES (NBC-like (SPES)) and of BC particles measured by SP2 in the mass-equivalent diameter range of 0.28–0.65 µm (NBC_0.28–0.65 (SP2)). These data were well correlated with one another (R = 0.82) when NBC_0.28–0.65 (SP2) was averaged for each period of filter sampling (). The NBC_0.28–0.65 (SP2) showed drastic variations during 19–20 May, indicating an influence from local pollution sources near the observation site. When these exceptionally high NBC_0.28–0.65 (SP2) values were excluded (, arrow), the correlation coefficient increased (R = 0.87). shows a correlation matrix constructed between particle number concentrations measured by SPES and those measured by the online instruments. NBC-like (SPES) showed a stronger correlation with the NBC_0.28–0.65 (SP2) than did the concentration data obtained with the other online instruments. These results suggest that NBC-like (SPES) follows the variations of atmospheric BC concentrations.
Figure 4. Time series of the number concentrations of (a) BC-like particles measured by single-particle extinction and scattering (SPES) instrument and refractory BC particles measured by Single Particle Soot Photometer (SP2), (b) dust-like particles by SPES instrument and coarse particles measured by Optical Particle Sizer (OPS), and (c) PBAP-like particles measured by SPES instrument and type-C fluorescent particles measured by Wideband Integrated Bioaerosol Sensor (WIBS) in ambient air sampled in Nagoya, Japan. Time series of 1-h averaged data are shown for the data obtained from online instruments (SP2, OPS, and WIBS).
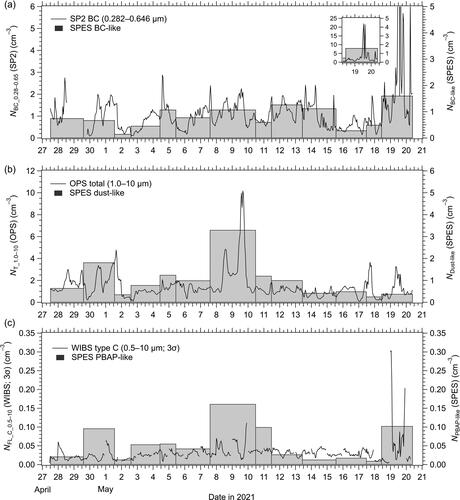
Figure 5. Scatter plots of the number concentrations of (a) BC-like particles measured by single-particle extinction and scattering (SPES) and refractory BC particles measured by Single Particle Soot Photometer (SP2), (b) BC-like particles measured by SPES and refractory BC particles measured by SP2 (both diameter ranges of 0.28–0.65 µm), (c) dust-like particles measured by SPES and coarse particles by Optical Particle Sizer (OPS), and (d) PBAP-like particles measured by SPES and type-C fluorescent particles by Wideband Integrated Bioaerosol Sensor (WIBS) in Nagoya, Japan. The arrows in panels (a) and (b) indicate local pollution event data.
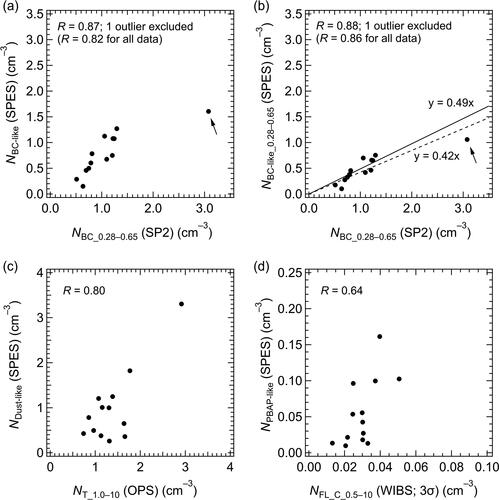
Figure 6. Correlation matrix for the number concentration of various particles measured in Nagoya, Japan. Parameter definitions are provided in the Nomenclature section of the main text. For readability, the symbol N, which denotes number concentration in the main text, is omitted here, and “Total” rather than “T” is used to represent OPS data.
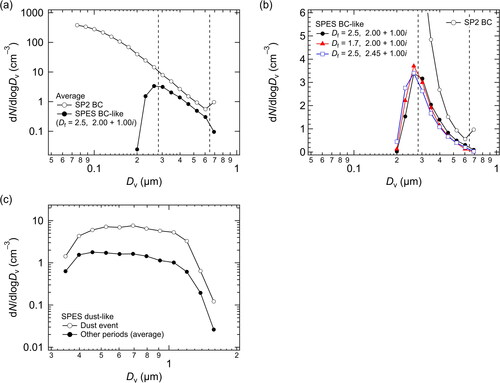
The number size distributions of BC-like particles are discussed in Appendix A2. Assuming their physical properties (i.e., fractal-like aggregates of 60-nm primary spheres (Moteki Citation2020) with a fractal dimension of 2.5 and a refractive index of 2.00 + 1.00i at a wavelength of 632.8 nm (), we estimated the size distributions of BC-like particles from their |S22| values. The average size distribution is shown in . The number concentrations of BC-like particles smaller than 0.282 µm (corresponding to |S22| < 0.224) were underestimated because of the decrease in the effective detection area for smaller particles (Section 3.1). Considering these results, the number concentration of BC-like particles in the volume-equivalent diameter range of 0.28–0.65 µm (i.e., 0.224 < |S22| < 1.817) (NBC-like_0.28–0.65 (SPES)) was calculated and compared with NBC_0.28–0.65 (SP2) (). The associated correlation coefficient was higher than that shown in , probably due to the matching of the diameter ranges. The slope of the least-squares regression forced through the origin was 0.49 when the local pollution event data were excluded (). The result indicates that the offline SPES method underestimated the number concentrations of BC by about 50% compared to those obtained with online SP2. Since we assumed Εd = 1 for this analysis, these results indicate that Εd ∼ 0.5 for ambient BC particles, which is comparable to the Εd value for PSL spheres (0.68 ± 0.18), despite the differences in physicochemical properties between BC and PSL. In other words, under the assumptions of Εd = 1, the number concentrations of WIAPs can be measured with a potential underestimate of about 50%. Incomplete dispersion observed for PSL and BC particles suggests that the adhesion of these particles to a polycarbonate filter by van der Waals and electrostatic forces was not entirely removed by the present method (i.e., the 3-frequency sonication for 9 min in water). It should be noted that there were unidentified WIAPs in our classification between BC-like/dust-like boundaries and dust-like/PBAP-like boundaries (), and they also likely contribute to the potential underestimates of BC, mineral dust, and PBAPs. Further experimental studies using mineral dust and bioaerosol samples are needed to evaluate the composition-dependent dispersion efficiency.
3.2.3. Dust-like particles
shows the time series of the number concentration of dust-like particles measured by SPES (NDust-like (SPES)) and the total number concentration of particles measured by OPS in the optical diameter range of 1.0–10 µm (NT_1.0–10 (OPS)). Here, we assume that the NT_1.0–10 (OPS) is an indicator of the abundance of mineral dust particles in the atmosphere, as coarse particles are considered to have a higher relative abundance of mineral dust particles than fine particles. The correlation between NT_1.0–10 (OPS) and the number concentration in the diameter range of 0.3–10 µm (NT_0.3–10 (OPS)) was weak (R = 0.23; ), and NT_0.3–10 (OPS) was well correlated with NBC_0.28–0.65 (SP2) (R = 0.93; ). These results suggest that organic and inorganic aerosol particles that originated from sources close to BC emission sources had a greater influence on NT_0.3–10 than on NT_1.0–10.
The correlation coefficient between NDust-like (SPES) and NT_1.0–10 (OPS) was higher (0.80; ) than that between NDust-like (SPES) and the other parameters measured by the online instruments (). A similar analysis also showed that the dust-like/BC-like number concentration ratio was more correlated with NT_1.0–10 (OPS)/NBC_0.28–0.65 (SP2) ratio (R = 0.75; Figure S4a) than with NT_0.3–10 (OPS)/NBC_0.28–0.65 (SP2) ratio (R = 0.29; Figure S4b). Furthermore, NDust-like (SPES) on 7–10 May 2021, and NT_1.0–10 (OPS) on 9 May 2021, showed the highest values during the observation period () when a distinct transport of mineral dust (Asian dust) from the Asian continent was observed over a wide area of Japan (Japan Meteorological Agency Citation2021). Meanwhile, NT_0.3–10 (OPS) and NBC_0.28–0.65 (SP2) were the highest on 19 May 2021 (Figure S5 and ), presumably due to an influence from local pollution sources near the observation site. These results suggest that the variations of NDust-like (SPES) correspond to those of mineral dust concentrations. Note, however, that the correlation between NDust-like (SPES) and NT_1.0–10 (OPS) was weak (R = 0.34) when the above-mentioned dust-event data were excluded (Figure S6b). Therefore, NT_1.0–10 (OPS) might not be a good indicator of mineral dust concentrations through the whole observation period, especially when NT_1.0–10 (OPS) was lower than 2.0 cm−3 () and contributions from other coarse particles such as sea salt and bioaerosols might be high. The number size distributions of the dust-like particles are briefly discussed in Appendix A2.
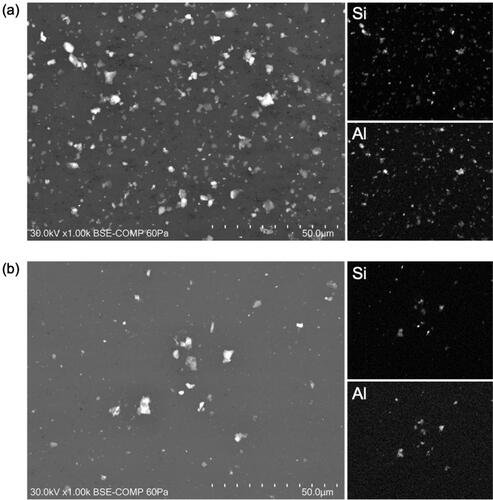
Aerosol particles collected on polycarbonate filters during the dust event (7–10 May) and the other period (13–15 May) were measured using scanning electron microscopy with an energy dispersive X-ray spectrometer (SEM-EDS) (). In total, 785 and 753 particles with an equivalent circle diameter larger than 0.6 µm were analyzed from samples collected during the dust event and another period, respectively. In the sample collected during the dust event, 97% of the particles were determined to be mineral dust containing either aluminum and silicon (silicate minerals; 90%) or calcium and sulfur (Ca-containing minerals; 7%). For the other sample, 65% of the particles were mineral dust (57% silicate minerals and 8% Ca-containing minerals). The SEM-EDS analyses showed that both samples contained very few fly-ash particles, which are combustion-derived spherical particles containing silicon and iron. These SEM-EDS results show that mineral dust particles were the dominant WIAPs in both samples. Furthermore, from the WIBS measurements during the observation period, the number concentration of fluorescent particles was only 5 ± 2% (mean ± 1σ) and 1 ± 1% of all the particles within the optical diameter range of 0.5–10 µm for FT + 3σ and FT + 9σ threshold conditions, respectively, further supporting that the number concentrations of PBAPs were much lower than those of mineral dust particles. These results are consistent with the results from the SPES measurements where the PBAP-like/dust-like number concentration ratio was 0.06 ± 0.06 (mean ± 1σ) during the observation period, although the diameter ranges considered here differ from those considered in the electron microscopy and WIBS analyses. Therefore, the number concentrations of dust-like particles in spring in Nagoya derived from our classification method were not significantly affected by the presence of PBAPs, despite the possible overlapping of the S22 data ().
Figure 7. Scanning electron microscopy with energy dispersive X-ray spectrometry mapping images of aerosols collected in Nagoya during (a) 7–10 May and (b) 13–15 May 2021. Elemental mappings for Si and Al are shown in the right column.
3.2.4. PBAP-like particles
Unlike BC-like and dust-like particles, we could not evaluate whether the present method detected ambient bioaerosol particles as PBAP-like particles because no clear correlation was observed between the number concentration of PBAP-like particles measured by SPES (NPBAP-like (SPES)) and the total fluorescent particles measured by WIBS in the optical diameter range of 0.5–10 µm (NFL_0.5–10 (WIBS)) ( = 0.34 for FT + 3σ threshold condition and R = −0.04 for FT + 9σ condition). Furthermore, NPBAP-like (SPES) was strongly correlated with NDust-like (SPES) ( = 0.81) and Figure S6 (R = 0.94 and R = 0.59)). We interpret the results that, under dust-dominant conditions, some mineral dust particles could be misclassified as PBAP-like particles due to their overlapping S22 data in the current separation method.
It is interesting to note, however, that the NPBAP-like (SPES) was moderately correlated with the concentration of type-C fluorescent particles (NFL_C_0.5–10 (WIBS) regardless of the setting of the fluorescent threshold (R = 0.64 and R = 0.75, Table S3). and show their time series and scatter plot, respectively. Although most of the pollen tended to be classified as type ABC or BC in previous studies, the type-C fluorescent particles might also include pollen or pollen-derived debris (Hernandez et al. Citation2016; Savage et al. Citation2017). In previous studies, as pollens from Fagaceae and Pinaceae families were detected in May in the temperate climate zone in Japan (e.g., Uetake et al. Citation2021), SPES possibly detected such pollen fragments. However, as the SEM-EDS analyses detected few pollen particles, the species of the particles categorized as PBAP-like particles were not determined. Further studies are needed for the quantitative analysis of PBAP-like particles.
4. Summary and conclusions
We evaluated an offline method to measure the number concentrations of submicron WIAPs through laboratory experiments and ambient observations in the urban atmosphere. In this method, particles were collected on a polycarbonate filter and dispersed in water, and then the complex forward-scattering amplitude (S22) of individual particles was measured by an SPES instrument. Laboratory experiments using PSL spheres with diameters of 0.508–0.903 µm showed that the effective detection area of the SPES instrument was (1.98 ± 0.17) × 10−11 m2 and the dispersion efficiency in water (Εd) was 0.68 ± 0.18.
WIAPs collected in the atmosphere of Nagoya, Japan, were classified as BC-like, dust-like, or PBAP-like particles based on the S22 data. The number concentrations of BC-like particles were strongly correlated with those of refractory BC particles measured by SP2, demonstrating the validity of our offline method. The Εd value for BC-like particles was estimated to be ∼0.5, which was comparable to that of PSL particles. Although further experiments using various types of WIAPs (e.g., dust, PBAPs) might be required for the evaluation of composition-dependent dispersion efficiency, the result suggests that the present method is capable of measuring the number concentrations of WIAPs with a potential underestimate of about 50% if complete dispersion (Εd = 1) is assumed. Further experimental studies with different filter materials, solvents, and sonication conditions are warranted to increase dispersion efficiency.
Dust-like particles were the dominant WIAPs other than BC-like particles in spring in Nagoya, which is consistent with electron microscopy observations. The number concentrations of dust-like particles were correlated with the total number concentrations of supermicron-sized particles, and significantly increased during a dust event. The number concentrations of particles categorized as PBAP-like particles were much lower than those of dust-like particles and their quantification was highly uncertain.
The distributions of real and imaginary parts of S22 data for ambient metal oxide particles and water-insoluble organic aerosol particles, which are possibly abundant in the urban atmosphere, are unknown. Thus, their contributions to NBC-like, NDust-like, and NPBAP-like were not quantified in the current observation. Further studies on metal oxide particles, water-insoluble organic aerosol particles, and PBAPs are recommended to improve the quantification of the number concentrations for each type of WIAPs. Under the evaluated uncertainties, the combination of filter sampling and complex amplitude measurements presented in this study will be useful in elucidating the spatio-temporal distributions of WIAPs under various atmospheric environments.
| Nomenclature | ||
| N | = | number concentration of particles in air [m−3] |
| C | = | number concentration of particles in water [m−3] |
| R | = | particle detection rate by the SPES instrument [s−1] |
| Va | = | total air volume aspired during particle collection on a filter [m3] |
| Vw | = | volume of water used for dispersion of particles collected on a filter into water [m3] |
| Ec | = | particle collection efficiency of a filter [dimensionless] |
| Ed | = | particle dispersion efficiency of particles collected on a filter to water [dimensionless] |
| A | = | effective detection area in the flow cell of the SPES instrument [m2] |
| U | = | Average velocity of the sample water in the flow cell of the SPES instrument [m s−1] |
| D | = | duty cycle of the computer of the SPES instrument for recording particle signal data [dimensionless] |
| F | = | mass ratio of the analyzed filter to the whole filter [dimensionless] |
| Dv | = | volume-equivalent diameter of a particle [ |
| NBC-like (SPES) | = | number concentration of BC-like particles measured by the SPES instrument [m−3] |
| NDust-like (SPES) | = | number concentration of dust-like particles measured by the SPES instrument [m−3] |
| NPBAP-like (SPES) | = | number concentration of PBAP-like particles measured by the SPES instrument [m−3] |
| NBC-like_0.28–0.65 (SPES) | = | number concentration of BC-like particles in the volume-equivalent diameter range of 0.28–0.65 |
| NFL_0.5–10 (WIBS) | = | number concentration of total fluorescent particles in the optical diameter range of 0.5–10 |
| NFL_C_0.5–10 (WIBS) | = | number concentration of type-C fluorescent particles in the optical diameter range of 0.5–10 |
| NBC_XXX–YYY (SP2) | = | number concentration of refractory BC particles in the mass-equivalent diameter range of XXX–YYY |
| NT_XXX–YYY (OPS) | = | total number concentration of particles in the optical diameter range of XXX–YYY measured by the OPS [m−3] |
Supplemental Material
Download PDF (1.6 MB)Acknowledgments
We thank Drs. A. Yoshida, Y. Kondo, and M. Koike for their discussions. We also thank Dr. R. Misumi and Mr. Y. Uji for the use of the WIBS in this study.
Additional information
Funding
References
- Adachi, K., M. Kajino, Y. Zaizen, and Y. Igarashi. 2013. Emission of spherical cesium-bearing particles from an early stage of the Fukushima nuclear accident. Sci. Rep. 3:2554. doi:10.1038/srep02554.
- Adachi, K., Y. Tobo, M. Koike, G. Freitas, P. Zieger, and R. Krejci. 2022. Composition and mixing state of Arctic aerosol and cloud residual particles from long-term single-particle observations at Zeppelin Observatory, Svalbard. Atmos. Chem. Phys. 22 (21):14421–39. doi:10.5194/acp-22-14421-2022.
- Brockmann, J. E. 2011. Aerosol transport in sampling lines and inlets. In Aerosol Measurement: Principles, techniques, and applications, Ed. P. Kulkarni, P. A. Baron, and K. Willeke, 69–105. 3rd ed. Hoboken, NJ: John Wiley & Sons.
- Cho, Y. S., S. C. Hong, J. Choi, and J. H. Jung. 2019. Development of an automated wet-cyclone system for rapid, continuous and enriched bioaerosol sampling and its application to real-time detection. Sens. Actuators. B Chem. 284:525–33. doi:10.1016/j.snb.2018.12.155.
- Cornwell, G. C., C. M. Sultana, M. D. Petters, H. Al-Mashat, N. E. Rothfuss, O. Möhler, P. J. Demott, A. C. Martin, and K. A. Prather. 2022. Discrimination between individual dust and bioparticles using aerosol time-of-flight mass spectrometry. Aerosol Sci. Technol. 56 (7):592–608. doi:10.1080/02786826.2022.2055994.
- Cremonesi, L., A. Passerini, A. Tettamanti, B. Paroli, B. Delmonte, S. Albani, F. Cavaliere, D. Viganò, G. Bettega, T. Sanvito, et al. 2020. Multiparametric optical characterization of airborne dust with single particle extinction and scattering. Aerosol Sci. Technol. 54 (4):353–66. doi:10.1080/02786826.2019.1699896.
- Fan, J., Y. Wang, D. Rosenfeld, and X. Liu. 2016. Review of aerosol–cloud interactions: Mechanisms, significance, and challenges. J. Atmos. Sci. 73 (11):4221–52. doi:10.1175/JAS-D-16-0037.1.
- Froyd, K. D., D. M. Murphy, C. A. Brock, P. Campuzano-Jost, J. E. Dibb, J.-L. Jimenez, A. Kupc, A. M. Middlebrook, G. P. Schill, K. L. Thornhill, et al. 2019. A new method to quantify mineral dust and other aerosol species from aircraft platforms using single-particle mass spectrometry. Atmos. Meas. Tech. 12 (11):6209–39. doi:10.5194/amt-12-6209-2019.
- Greenwald, R., M. H. Bergin, C. M. Carrico, and D. Grant. 2005. New real-time technique to measure the size distribution of water-insoluble aerosols. Environ. Sci. Technol. 39 (13):4967–73. doi:10.1021/es048366p.
- Hernandez, M., A. E. Perring, K. Mccabe, G. Kok, G. Granger, and D. Baumgardner. 2016. Chamber catalogues of optical and fluorescent signatures distinguish bioaerosol classes. Atmos. Meas. Tech. 9 (7):3283–92. doi:10.5194/amt-9-3283-2016.
- Hu, Y., X. Zhao, Y. Gu, X. Chen, X. Wang, P. Wang, Z. Zheng, and X. Dong. 2019. Significant broadband extinction abilities of bioaerosols. Sci. China Mater. 62 (7):1033–45. doi:10.1007/s40843-018-9411-9.
- Japan Meteorological Agency. 2021. List of observation dates and locations for Kosa in 2021 (in Japanese). Accessed December 14, 2022. https://www.data.jma.go.jp/gmd/env/kosahp/kosa_table_2021.html.
- Kanji, Z. A., L. A. Ladino, M. Krämer, D. J. Cziczo, M. Burkert-Kohn, Y. Boose, and H. Wex. 2017. Overview of ice nucleating particles. Meteorol. Monogr. 58:1.1–.33. doi:10.1175/AMSMONOGRAPHS-D-16-0006.1.
- Karydis, V. A., A. P. Tsimpidi, A. Pozzer, M. Astitha, and J. Lelieveld. 2016. Effects of mineral dust on global atmospheric nitrate concentrations. Atmos. Chem. Phys. 16 (3):1491–509. doi:10.5194/acp-16-1491-2016.
- Kok, J. F., D. A. Ridley, Q. Zhou, R. L. Miller, C. Zhao, C. L. Heald, D. S. Ward, S. Albani, and K. Haustein. 2017. Smaller desert dust cooling effect estimated from analysis of dust size and abundance. Nat. Geosci. 10:274–8. doi:10.1038/NGEO2912.
- Mahowald, N., S. Albani, J. F. Kok, S. Engelstaeder, R. Scanza, D. S. Ward, and M. G. Flanner. 2014. The size distribution of desert dust aerosols and its impact on the earth system. Aeolian Res. 15:53–71. doi:10.1016/j.aeolia.2013.09.002.
- Marsden, N. A., R. Ullrich, O. Möhler, S. Eriksen Hammer, K. Kandler, Z. Cui, P. I. Williams, M. J. Flynn, D. Liu, J. D. Allan, et al. 2019. Mineralogy and mixing state of North African mineral dust by online single-particle mass spectrometry. Atmos. Chem. Phys. 19 (4):2259–81. doi:10.5194/acp-19-2259-2019.
- Martin, J., R. M. Gordon, and S. E. Fitzwater. 1991. The case for iron. Limnol. Oceanogr. 36 (8):1793–802. doi:10.4319/lo.1991.36.8.1793.
- Moteki, N. 2020. Capabilities and limitations of the single-particle extinction and scattering method for estimating the complex refractive index and size-distribution of spherical and non-spherical submicron particles. J. Quant. Spectrosc. Radiat. Transfer 243:106811. doi:10.1016/j.jqsrt.2019.106811.
- Moteki, N. 2021. Measuring the complex forward-scattering amplitude of single particles by self-reference interferometry: CAS-v1 protocol. Opt. Express. 29 (13):20688–714. doi:10.1364/OE.423175.
- Moteki, N., K. Adachi, S. Ohata, A. Yoshida, T. Harigaya, M. Koike, and Y. Kondo. 2017. Anthropogenic iron oxide aerosols enhance atmospheric heating. Nat. Commun. 8:15329. doi:10.1038/ncomms15329.
- Moteki, N., and Y. Kondo. 2010. Dependence of laser-induced incandescence on physical properties of black carbon aerosols: Measurements and theoretical interpretation. Aerosol Sci. Technol. 44 (8):663–75. doi:10.1080/02786826.2010.484450.
- Murphy, D. M. 2007. The design of single particle laser mass spectrometers. Mass Spectrom. Rev. 26 (2):150–65. doi:10.1002/mas.20113.
- Ogura, I., M. Kotake, H. Sakurai, and K. Honda. 2016. Surface-collection efficiency of Nuclepore filters for nanoparticles. Aerosol Sci. Technol. 50 (8):846–56. doi:10.1080/02786826.2016.1200007.
- Ohata, S., N. Moteki, J. Schwarz, D. Fahey, and Y. Kondo. 2013. Evaluation of a method to measure black carbon particles suspended in rainwater and snow samples. Aerosol Sci. Technol. 47 (10):1073–82. doi:10.1080/02786826.2013.824067.
- Ohata, S., A. Yoshida, N. Moteki, K. Adachi, Y. Takahashi, M. Kurisu, and M. Koike. 2018. Abundance of light-absorbing anthropogenic iron oxide aerosols in the urban atmosphere and their emission sources. J. Geophys. Res. Atmos. 123:8115–34. doi:10.1029/2018JD028363.
- Orsini, D. A., K. Rhoads, K. Mcelhoney, E. Schick, D. Koehler, and O. Hogrefe. 2008. A water cyclone to preserve insoluble aerosols in liquid flow—An interface to flow cytometry to detect airborne nucleic acid. Aerosol Sci. Technol. 42 (5):343–56. doi:10.1080/02786820802072881.
- Painter, T. H., A. P. Barrett, C. C. Landry, J. C. Neff, M. P. Cassidy, C. R. Lawrence, K. E. Mcbride, and G. L. Farmer. 2007. Impact of disturbed desert soils on duration of mountain snow cover. Geophys. Res. Lett. 34 (12):L12502. doi:10.1029/2007GL030284.
- Peltier, R. E., R. J. Weber, and A. P. Sullivan. 2007. Investigating a liquid-based method for online organic carbon detection in atmospheric particles. Aerosol Sci. Technol. 41 (12):1117–27. doi:10.1080/02786820701777465.
- Perring, A. E., J. P. Schwarz, D. Baumgardner, M. T. Hernandez, D. V. Spracklen, C. L. Heald, R. S. Gao, G. Kok, G. R. Mcmeeking, J. B. Mcquaid, et al. 2015. Airborne observations of regional variation in fluorescent aerosol across the United States. J. Geophys. Res. Atmos. 120 (3):1153–70. doi:10.1002/2014JD022495.
- Potenza, M. A. C., T. Sanvito, and A. Pullia. 2015. Measuring the complex field scattered by single submicron particles. AIP Adv. 5 (11):117222. doi:10.1063/1.4935927.
- Ridley, D. A., C. L. Heald, J. F. Kok, and C. Zhao. 2016. An observationally constrained estimate of global dust aerosol optical depth. Atmos. Chem. Phys. 16 (23):15097–117. doi:10.5194/acp-16-15097-2016.
- Savage, N. J., C. E. Krentz, T. Könemann, T. T. Han, G. Mainelis, C. Pöhlker, and J. A. Huffman. 2017. Systematic characterization and fluorescence threshold strategies for the wideband integrated bioaerosol sensor (WIBS) using size-resolved biological and interfering particles. Atmos. Meas. Tech. 10 (11):4279–302. doi:10.5194/amt-10-4279-2017.
- Schwarz, J. P., R. S. Gao, D. W. Fahey, D. S. Thomson, L. A. Watts, J. C. Wilson, J. M. Reeves, M. Darbeheshti, D. G. Baumgardner, G. L. Kok, et al. 2006. Single-particle measurements of midlatitude black carbon and light-scattering aerosols from the boundary layer to the lower stratosphere. J. Geophys. Res. 111 (D16):D16207. doi:10.1029/2006JD007076.
- Sullivan, R. C., S. A. Guazzotti, D. A. Sodeman, Y. Tang, G. R. Carmichael, and K. A. Prather. 2007. Mineral dust is a sink for chlorine in the marine boundary layer. Atmos. Environ. 41 (34):7166–79. doi:10.1016/j.atmosenv.2007.05.047.
- Tobo, Y., K. Adachi, P. J. Demott, T. C. J. Hill, D. S. Hamilton, N. M. Mahowald, N. Nagatsuka, S. Ohata, J. Uetake, Y. Kondo, et al. 2019. Glacially sourced dust as a potentially significant source of ice nucleating particles. Nat. Geosci. 12 (4):253–8. doi:10.1038/s41561-019-0314-x.
- Tobo, Y., J. Uetake, H. Matsui, N. Moteki, Y. Uji, Y. Iwamoto, K. Miura, and R. Misumi. 2020. Seasonal trends of atmospheric ice nucleating particles over Tokyo. J. Geophys. Res. Atmos. 125 (23):e2020JD033658. doi:10.1029/2020JD033658.
- Uetake, J., Y. Tobo, S. Kobayashi, K. Tanaka, S. Watanabe, P. J. Demott, and S. M. Kreidenweis. 2021. Visualization of the seasonal shift of a variety of airborne pollens in western Tokyo. Sci. Total Environ. 788:147623. doi:10.1016/j.scitotenv.2021.147623.
- Weber, R. J., D. Orsini, Y. Daun, Y.-N. Lee, P. J. Klotz, and F. Brechtel. 2001. A particle-into-liquid collector for rapid measurement of aerosol bulk chemical composition. Aerosol Sci. Technol. 35 (3):718–27. doi:10.1080/02786820152546761.
- Yoshida, A., N. Moteki, and K. Adachi. 2022. Identification and particle sizing of submicron mineral dust by using complex forward-scattering amplitude data. Aerosol Sci. Technol. 56 (7):609–22. doi:10.1080/02786826.2022.2057839.
- Yoshida, A., N. Moteki, S. Ohata, T. Mori, M. Koike, Y. Kondo, H. Matsui, N. Oshima, A. Takami, and K. Kita. 2020. Abundances and microphysical properties of light‐absorbing iron oxide and black carbon aerosols over East Asia and the Arctic. J. Geophys. Res. Atmos. 125 (15):e2019JD032301. doi:10.1029/2019JD032301.
- Yoshida, A., N. Moteki, S. Ohata, T. Mori, R. Tada, P. Dagsson-Waldhauserová, and Y. Kondo. 2016. Detection of light-absorbing iron oxide particles using a modified single-particle soot photometer. Aerosol Sci. Technol. 50 (3):1–4. doi:10.1080/02786826.2016.1146402.
- Zhang, R., A. F. Khalizov, J. Pagels, D. Zhang, H. Xue, and P. H. Mcmurry. 2008. Variability in morphology, hygroscopicity, and optical properties of soot aerosols during atmospheric processing. Proc. Natl. Acad. Sci. USA 105 (30):10291–6. doi:10.1073/pnas.0804860105.
Appendix
A1. Theoretical and experimental S22 values
Following parameter definitions by Moteki (Citation2020), the real part of the S22 and the imaginary part of the S22 data with scattering correction are denoted as Re(S22) and [Im(S22)]sc, respectively. S22 values calculated for spheres with refractive indices of 1.35 + 0i, 1.40 + 0i, and 1.50 + 0.0i at the wavelength of 632.8 nm are shown in . The S22 values for fractal-like aggregates of 60-nm primary spheres (Moteki Citation2020) with refractive indices of 2.00 + 1.0i and 2.45 + 1.0i are also presented as the theoretical values for BC particles. shows the S22 values for laboratory samples of BC (fullerene soot, 572497, Sigma-Aldrich), mineral dust (Arizona test dust, ISOTEST DUST 12103-1, A2 fine, Powder Technologies, Inc.), and biological materials from the bacterium Pseudomonas syringae (Snomax, Snomax International). The cluster of S22 data for the fullerene soot samples was clearly separated from that for the Arizona test dust and Snomax samples. However, overlapping of the S22 clusters for Arizona test dust and Snomax was observed, especially for smaller particles. More laboratory samples were tested with an SPES instrument by Yoshida, Moteki, and Adachi et al. (Citation2022). shows experimental and theoretical S22 values for polystyrene latex spheres (mean diameters of 0.508, 0.702, and 0.903 µm). The medians of the measured Re(S22) and [Im(S22)]sc data agreed with the theoretical values within 15%. Random errors of the measured Re(S22) and [Im(S22)]sc for these PSL spheres, partly originating from the variations in the particle position along the optical axis within the detection volume in the flow cell of the SPES instrument, were estimated to be less than 11%, from their relative standard deviations. The effect of the particle position on complex forward-scattering amplitude measurements was investigated in detail by Moteki (Citation2021).
shows the S22 data for ambient WIAPs collected in Nagoya, together with theoretical S22 curves. From these comparisons, the detectable diameter range of the SPES instrument was roughly estimated to be 0.25–0.70 µm for BC-like particles and 0.35–1.4 µm for dust-like particles.
A2. Size distributions of BC-like and dust-like particles
Particle sizes of ambient BC-like particles were estimated from their |S22| values, assuming the physical properties of BC-like particles as follows: fractal-like aggregates of 60-nm primary spheres (Moteki Citation2020) with a fractal dimension of 2.5 and a refractive index of 2.00 + 1.00i at a wavelength of 632.8 nm. It should be noted that Moteki (Citation2020) presented a Bayesian inversion method to estimate the complex refractive index, shape, and volume-equivalent size distributions from the S22 data clusters. For simplicity, however, this study derived volume-equivalent sizes from the |S22| values preassuming their fractal dimension and refractive index. shows the average size distribution of BC-like particles measured by the SPES instrument and that of refractory BC particles measured by the SP2. The number concentrations of BC-like particles smaller than 0.282 µm were underestimated because of the decreased effective detection area for smaller particles. The dN/dlogDv values for Dv = 0.282–0.646 µm measured by the SPES instrument were about 50% lower than those measured by the SP2, partly because of the assumed Εd of unity. No clear size dependence was observed for the ratios between dN/dlogDv values measured by SPES and SP2 within the Dv range of 0.282–0.646 µm, suggesting a small dependence of dispersion efficiency on particle size for this diameter range.
The sensitivity of the number size distributions to the assumed fractal dimension and refractive index was also examined. shows the size distributions derived by assuming the pairs of fractal dimension and refractive index of (2.5, 2.00 + 1.00i), (1.7, 2.00 + 1.00i), or (2.5, 2.45 + 1.00i). The dN/dlogDv values for Dv = 0.282–0.646 µm were not significantly affected by these assumed values, and the NBC-like_0.28–0.65 (SPES) values calculated for (2.5, 2.00 + 1.00i) agreed to those for (1.7, 2.00 + 1.00i) or (2.5, 2.45 + 1.00i) within 19%. Because the theoretical S22 values for (2.5, 2.00 + 1.00i) were more consistent with the observed S22 data than those for (1.7, 2.00 + 1.00i) or (2.5, 2.45 + 1.00i) ( and ), the values of (2.5, 2.00 + 1.00i) were assumed for further analysis in Section 3.2.
Particle sizes of ambient dust-like particles were also estimated from their |S22| values, assuming spherical shapes and a refractive index of 1.50 + 0.0 i at λ = 632.8 nm. shows the size distribution of dust-like particles during the dust event and the average distribution during the whole observation period other than the dust-event data. The former dN/dlogDV values were generally more than four times higher than the latter values.
Figure A1. (a) Theoretical S22 values for spheres and fractal-like aggregates. The fractal dimension is denoted as Df. Assumed complex refractive indices at the wavelength of 632.8 nm are shown in parentheses. Volume equivalent diameters for some data points are also shown. (b) Experimental S22 values for fullerene soot, Arizona test dust, and Snomax particles. (c) Experimental and theoretical S22 values for polystyrene latex spheres (mean diameters of 0.508, 0.702, and 0.903 μm). The gray dots indicate single-particle measurement data. The solid black circles with bars indicate the median and 25th–75th percentile ranges of single-particle data for each particle size. The solid red circles with bars indicate the theoretical values and their uncertainty ranges calculated from the expanded uncertainties (k = 2) specified in the sample datasheets.
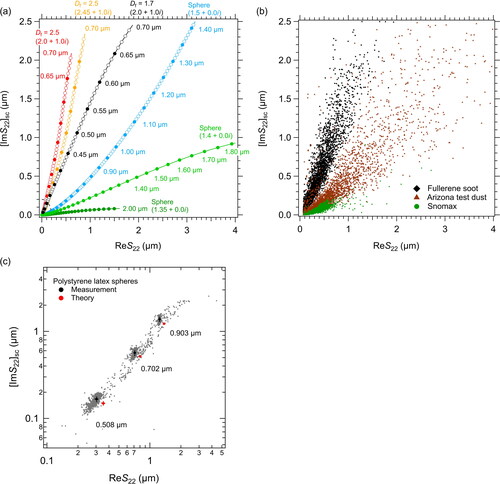
Figure A2. (a) S22 data obtained for ambient particles collected in Nagoya, Japan (gray). Color markers indicate theoretical S22 values for spheres and fractal-like aggregates with assumed refractive indices. Volume equivalent diameters for some data points are also shown. Open circles and solid triangles indicate data points every 10 nm and 50 nm, respectively. (b) Same as (a) but expanded to show S22 data for smaller particles.
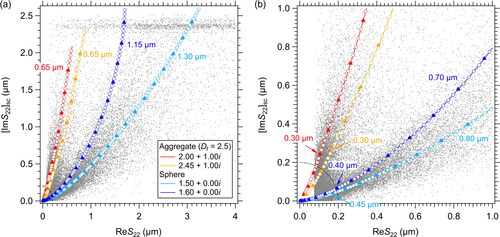
Figure A3. (a) Average number size distribution of BC measured by Single Particle Soot Photometer (SP2) and that of BC-like particles measured by single-particle extinction and scattering (SPES). For the SPES data, a fractal dimension (Df) of 2.5 and a refractive index of 2.00 + 1.00i at a wavelength of 632.8 nm were assumed. The dashed lines indicate the diameter range where the effective detection area of the SPES instrument is considered constant. (b) Same as (a) but with different assumptions of the physical properties of BC-like particles and vertical axis with a linear scale. (c) Number size distribution of dust-like particles measured by SPES during the dust event and the other periods (average).