
 ?Mathematical formulae have been encoded as MathML and are displayed in this HTML version using MathJax in order to improve their display. Uncheck the box to turn MathJax off. This feature requires Javascript. Click on a formula to zoom.
Abstract
This article presents the first experimental analysis of the influence of single, micrometer-sized aerosol particles on the reflectivity of a resonant Fabry-Pérot etalon (FPE). The results are presented along with a theoretical model capable of describing and predicting the particle influence on the transfer function of the etalon. The presence of the particle in the cavity alters the etalon reflectivity in the operating point up to several percent. Based on our findings, we show that the etalon reflectivity is mainly affected by light extinction by the particle. Phase effects due to interference of forward scattered light could not be observed experimentally in the investigated size range. However, extrapolations on the presented theoretical model show a significant dependence of the phase contribution on the collection angle of the etalon. Comparable magnitudes of the phase and extinction contribution are reached if the etalon geometry is slightly altered. This could be exploited to obtain the phase shift of the coherently forward scattered light. Cavity geometries can also be adapted to reduce the direct particle effect if it is undesired. In addition, the change in the transfer function of the etalon is analyzed and discussed, as it is especially relevant for measurement techniques such as photothermal interferometry.
Editor:
Introduction
Cavity-enhanced spectroscopy methods are widely used in environmental and emission monitoring, chemical analysis, process engineering, and healthcare. They offer superior sensitivity compared to cavity-free approaches. The most notable cavity-based techniques include cavity ring-down spectroscopy (CRDS) (Maity, Maithani, and Pradhan Citation2021; Berden, Peeters, and Meijer Citation2010; Wheeler et al. Citation1998; Mellon et al. Citation2011) with the related technique of Cavity-Enhanced Raman Spectroscopy (CERS) (Niklas, Wackerbarth, and Ctistis Citation2021; Wang et al. Citation2020), Cavity-Enhanced Photoacoustic Spectroscopy (CPAS) (Wang et al. Citation2019; Hayden et al. Citation2019), Cavity-Enhanced Absorption Spectroscopy (CEAS) (Fiedler, Hese, and Ruth Citation2003) and Photothermal Interferometry (PTI) (Davis and Petuchowski Citation1981; Krzempek Citation2019; Jin et al. Citation2015; Lin and Campillo Citation1985). Off-axis configurations operating outside the resonance condition of the cavity have also been implemented (Shao et al. Citation2022). All these techniques were originally developed for trace gas detection and chemical analysis due to their low detection limit and high sensitivity, outperforming conventional spectroscopic techniques. Because of their high sensitivity, cavity-based techniques recently gained interest for investigating physical and physicochemical properties of aerosol particles down to the single particle level. A special focus is devoted to determine the radiative forcing potentials of different aerosol species, which are still not known with the required precision according to the IPCC (Masson-Delmotte et al. Citation2021; Stocker et al. Citation2013). Especially the evolution of the radiative properties due to photochemical aging by atmospheric processes and the influence of coatings on highly absorbing species are active research fields. A fundamental understanding of those processes is crucial for accurately describing aerosols in climate models. Cotterell et al. (Citation2022, Citation2015) have shown that CRDS can be used to accurately retrieve the complex refractive index of single non-absorbing aerosol particles. Furthermore, they suggest using CRDS to monitor particle growth and measuring the acceleration of reaction kinetics in micrometer-sized droplets. Highly absorbing aerosol particles such as soot are usually studied with photoacoustic or photothermal methods, which directly probe sample absorption without any background signals from scattering (Visser et al. Citation2020; Radeschnig et al. Citation2021; Moosmüller, Chakrabarty, and Arnott Citation2009). For this purpose, the cavity reflectivity or transmissivity is monitored to retrieve the sample absorption from the cavity phase change.
Particular caution must be taken when measuring particles with cavity-enhanced techniques, as they directly affect the cavity reflectivity and transmissivity by extinction via scattering and absorption as well as interference effects. This creates a background signal and increases the measurement noise when those cavity properties are monitored for sensing purposes. The particle effect occurs for both resting or moving particles that are partially or entirely exposed to the standing wave inside the cavity. Optically or electrodynamically trapped particles are not completely at rest, as Brownian motion causes random particle movement on micrometer scales in a broad frequency range (Jones, Maragò, and Volpe Citation2015). Lock-in detection can significantly reduce this influence in single particle set-ups but also requires a periodic excitation of the particles. Optical forces exerted by modulated excitation lasers create again a spatial oscillation of the particle at the frequency of the excitation laser and its higher harmonics, superimposing the undesired particle signal to the signal of interest. Hence, understanding the influence of particles on the optical properties of a cavity is highly relevant in order to increase the accuracy of cavity-enhanced spectroscopic techniques. However, this topic has not been addressed in literature yet.
To fill this gap, we model and measure the influence of a single aerosol particle on the cavity of a Fabry-Pérot etalon (FPE) to increase the accuracy of cavity-based measurement techniques. The Fabry-Pérot interferometer serves as a well-described model for other methods where cavity reflection or transmission characteristics are monitored for sensing purposes. An analytical model of the interferometer is derived that combines the description of an ideal Fabry-Pérot cavity with generalized Lorenz Mie theory (GLMT) to incorporate the influence of the inter-cavity standing wave on the scattering properties of aerosol particles. The model is validated with experimental results from single aerosol particles optically-trapped in an air-spaced Fabry-Pérot etalon with medium-high fineness (). Very good agreement between the model and experiment was observed. Finally, the influence of variations of the cavity geometry is discussed.
Methods
Fabry-Pérot interferometer
The Fabry-Pérot interferometer was described at the end of the nineteenth century by Charles Fabry and Alfred Pérot for measuring sub-micron length scales (Pérot and Fabry Citation1899; Buisson and Fabry Citation1910). The concept of a multi-pass interferometer with high sensitivity and simple design soon found many applications in metrology, spectroscopy, and astrophysics (Vaughan Citation1989). Compared to other interferometer designs, the main advantage is its rigid and simple construction, consisting of two plane parallel or concave mirrors forming an optical resonator, denoted as an optical cavity or etalon. The transmissivity and reflectivity of the cavity are governed by the refractive index n of the medium inside, the wavelength of the incident light, and the distance d between the mirrors. Those parameters define the etalon phase lag
which is obtained by a ray propagating with a wave vector
along the z-axis trough the etalon:
(1)
(1)
The time dependant oscillation of the field is omitted for the following considerations and the initial amplitude of the electric field
is set to one without the loss of generality. The polarization direction of the beam in the x-y plane is not relevant, as etalons do not show a polarization dependency, or are symmetric upon rotation.
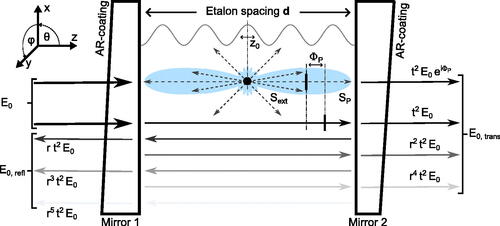
The ideal Fabry-Pérot etalon can be completely described using geometric ray optics (Vaughan Citation1989). Consider a ray of light entering the cavity as shown in the lower half of . Depending on the reflectivity R of the mirrors, a part of the ray is reflected inside the etalon, and a part is transmitted to the outside. Note that there is a difference between the intensity reflectivity R and the electric field reflectivity r, which are related by for dielectric surfaces (Vaughan Citation1989). The reflected rays gain the phase shift
each round trip inside the cavity:
(2)
(2) where d is the distance between the two mirrors and
the angle of incidence with respect to the cavity axis. The angular dependence can be dropped for near zero incidence
A standing wave is formed inside the cavity due to interference, whose amplitude is maximized for phase shifts
equal to multiples of
The out-coupled beams on both sides are composed of interfering partial rays with different phase lags. Depending on their phase lag, the intensity is shifted in forward (transmission) or backward direction (reflection) with respect to the incident beam. The reflectivity and transmissivity of the etalon can be found by a summation of all partially reflected or transmitted rays. This is described by the sharply peaked and periodic Airy function. For example, the reflected field (
) and the intensity (
) are given by Vaughan (Citation1989):
(3a)
(3a)
(3b)
(3b) where the coefficient of finesse F of the etalon is defined as
and
denotes the complex conjugate. F only depends on the mirror reflectivity. With increasing finesse, the Airy functions becomes sharper, with correspondingly decreased full width at half maximum (
). The phase dependency of the Airy function is often referred as the transfer function of the etalon. In the absence of losses, the intensity of the transmitted beam is given by the energy conservation:
(4)
(4)
Figure 1. Schematic drawing of a Fabry-Pérot-cavity with a particle located at a maximum of the standing wave (). The phase function of the particle is schematically indicated in light blue. The scattering loss contribution to the extincted contribution (
), as well as the forward scattered fraction (
) with the particle phase shift (
) are indicated. The angle of incidence
is chosen to be zero, and no reflections of the forward scattered fraction are drawn for better visibility. Furthermore, the etalon phase shift (
) on the reflected and transmitted rays is not indicated.
For measurement purposes, the operating point of the interferometer must be selected. The operating point defines the etalon phase shift in the absence of any external influence, and therefore the initial position on the Airy curve. It is typically set to the inflection point of the Airy function, where output sensitivity and linearity are maximized. A feedback stabilization mechanism continuously monitoring the etalon transmission or reflection is necessary to compensate for ambient pressure and temperature drifts driving the etalon out of its operating point. The necessary compensation is achieved by continuously adapting the laser wavelength.
Theoretical model
Influence of a particle on a Fabry-Pérot cavity
Particles in optical cavities scatter and absorb parts of the standing wave established in the cavity. Scattering of a standing wave differs significantly from plane wave scattering, as the amplitude of the standing wave varies with a sinusoidal profile along the etalon axis. Therefore, the observed scattering-cross section varies in the extreme case for particles much smaller than the wavelength between zero in the standing wave nodes () and twice the value of plane wave scattering in anti-nodes (
) (Miller and Orr-Ewing Citation2007). Larger particles still show a deviation of up to 10%, although they average over multiple oscillations of the standing wave. This effect has been previously observed and extensively studied in CRDS (Miller and Orr-Ewing Citation2007; Cotterell et al. Citation2016), and is incorporated in the position dependency of the amplitude scattering elements
and
in our computations. A detailed description can be found in Section I. of the supplementary information.
The particle-light interaction affects the interferometer in two ways. First, a part of the standing wave is absorbed, or scattered into angles larger than the collection angle of the etalon, causing an overall intensity decrease. We denote this extinct contribution
creating the extinction effect. The portion
of the light scattered toward the etalon (corresponding to backward and forward direction) gains a phase shift
proportional to particle radius and refractive index, causing interference with the non-scattered part of the standing wave. This interference is referred to as the phase effect.
The extinct contribution is defined by the ratio of the extinct power
to the total power
of the beam. We start by computing the position-dependent scattering cross-section
for scattering into angles larger than the collection angle of the etalon
(5)
(5)
Adding the absorption cross-section yields in the extinction cross-section
(6)
(6)
The next step is to evaluate the beam’s intensity at the particle’s position. This can be achieved by integrating the intensity distribution over the beam profile over the area corresponding to the extinction cross-section of the particle at its transversal position (
) in the beam profile:
(7)
(7) where
is an indicator function, restricting the integration to an area corresponding to extinction cross-section of the particle, located at the position of the particle within the beam. The function is defined for a spherical particle by:
(8)
(8)
The extinct contribution can be now formulated as:
(9)
(9) where
is the total power of the beam. The computation can be simplified if the beam diameter is significantly larger than the particle radius. In total, the intensity decreases by a factor of
during each pass in the etalon. This is equivalent to a reduction of the electric field by
Therefore, a cavity with a particle that scatters or absorbs light deviates from the ideal loss-free case.
The forward scattered fraction is computed by evaluating EquationEquation (5)
(5)
(5) for scattering into angles still collected by the etalon. This is fulfilled by forward and backward scattering by the particle and is also expressed in terms of a scattering cross-section:
(10)
(10)
(11)
(11)
Both contributions are summed up due to the symmetry of forward and backward scattering in the maxima and nodes of the standing wave. The so-obtained cross-section for forward scattering is again integrated over the product of its indicator function () and the beam profile and divided by the total power
to define
(12)
(12) where
is defined for the forward scattered energy. Correspondingly, a fraction of
of the electric field obtains a phase shift of
during each pass through the particle. The phase shift is calculated based on a linear phase model. It is considered to be directly proportional to the particle radius a and the refractive index difference between the particle and surrounding medium
(Pettit and Peterson Citation1982; van der Hulst Citation1981). Based on the very small scattering angles, the phase front is assumed to be planar, and phase differences due to propagation under different angles are neglected. The phase model was validated by comparing it with results obtained using GLMT for scattering a linear polarized standing wave.
Analytical model for an etalon with a scattering particle
The analytical model is derived following the same concept as for an ideal Fabry-Pérot interferometer, with additional extension for the extinction and phase contribution. We restrict our considerations to the reflected intensity, as the transmitted intensity can be easily found using the same principle. The particle position is incorporated in the model through the position dependency of the factors describing the extinction of the standing wave, and
describing the forward scattering by the particle in the standing wave. For a more concise notation, the explicit position dependence of the factors
and
are omitted from now on. The following section summarizes the most important steps of the derivation of the model.
The magnitude of the reflected electric field can be expressed as a series of all partially reflected rays, gaining the etalon phase lag per round trip. The intensity of the rays decreases by
per round trip in the cavity, which is equivalent to a decrease of the electric field by
The forward scattered fraction
gains a phase shift
due to the presence of the particle:
where
The factor
is necessary to account for the fraction of the beam interacting with the particle. However, we neglect multiple passes through the particle as they are proportional to
Introducing a summation over all passes yields:
This can be simplified to the final expression of the complex reflected field by expressing it as a geometric series:(13)
(13)
From comparing EquationEquation (13)(13)
(13) to EquationEquation (3a)
(3a)
(3a) , it becomes clear that the presence of a particle alters the Airy function of the etalon. Two contributions can be identified in the brackets affecting the initial Airy profile. The first term expresses the extinction effect, causing a signal reduction dependent on the extinction cross-section of the particle. The second term creates the phase effect, responsible for interference effects proportional to the scattering magnitude of the forward scattered light. The result must be multiplied with its complex conjugate to retrieve the reflected intensity
from the complex electric fields.
We evaluated the model numerically for droplets in the size range from to
and with the refractive index of tetraethylene glycol (TEG) at the wavelength (
) of the interferometer
(
) (The Dow Chemical Company Citation2007). The amplitude scattering matrix was computed for homogeneous, spherical particles located at
and
of the standing wave, corresponding to its maximum and node. All other possible particle positions lie in between those two positions. The etalon geometry and interferometer parameters represent the conditions of our experimental setup. The operating point was set to the inflection point of the Airy function by choosing the etalon phase lag
correspondingly. Calculations with Mie-theory for the model evaluation were implemented by using the framework of Schäfer, Lee, and Kienle (Citation2012) and Schäfer (Citation2011). Extending the model to non-spherical or inhomogeneous particles requires the use of more advanced techniques as FDTD or the T-matrix formalism for evaluating the position dependent scattering matrix elements. See the work of Gouesbet (Citation2010, Citation2014) for more details.
Experimental setup
The theoretical model was experimentally validated by measuring the direct particle effect created from single aerosol droplets interacting with a Fabry-Pérot cavity. The cavity used in the experiment was a modified, commercially available fiber-coupled Fabry-Pérot interferometer (Xarion Laser Acoustics, Eta250 Ultra) operating in reflection mode. The cavity has a coefficient of finesse of uses a
laser with a Gaussian beam with a waist radius (
) of approximately
and an etalon collection angle of
The beam waist diameter was determined experimentally with an oscillating, optically trapped particle. The collection angle was defined based on the etalon geometry to contain approximately 100 consecutive reflections within the plain parallel mirrors. The operating point of the interferometer, defines the etalon phase shift without any external influence. It is continuously stabilized with a cutoff frequency set to
compensating for ambient pressure and temperature variations. The stabilization was done by an internal feedback mechanism, which varied the laser emission wavelength. Wavelength shifts are typically induced by varying the temperature of a fiber Bragg grating attached to the laser diode (Morton and Morton Citation2018). However, the exact mechanism used in the commercial Fabry-Pérot interferometer is not known.
The interferometer was mounted in counter-propagating optical tweezers (CPT) to trap and manipulate single aerosol droplets. The CPT consists of two cross-polarized beams of a continuous-wave laser (Laser Quantum opus 660) formed by the combination of an electro-optical modulator (EOM, Conoptics 350-50-01) with a polarization beam-splitter cube and a half-wave plate. The laser emission power was set to
Two aspheric ZnSe lenses (Edmund Optics 39-477) with
focal length focus the beams into the trapping cell holding the interferometer. A
continuous wave infrared laser (QCL, AdTech optics,
) is brought into the trapping cell collinear with one of the trapping beams. The laser is targeted at an absorption band of the trapped droplets to speed up their shrinking rate by evaporation. The laser is pre-defocused with a CaF2 telescope to compensate for the dispersion of the ZnSe trapping lens. A drawing of the optical setup and the trapping cell is given in . For a more detailed description of the optical trap see Diveky (Citation2022) and Cremer et al. (Citation2016).
Figure 2. Detailed sketch of the trapping cell (a), the tabletop setup (b), and the microscope tower (c). Pre-defocusing was applied with the CaF2 telescope to the IR laser to ensure its focal point overlapped with the trapping beam. (b) adapted from Diveky (Citation2022).
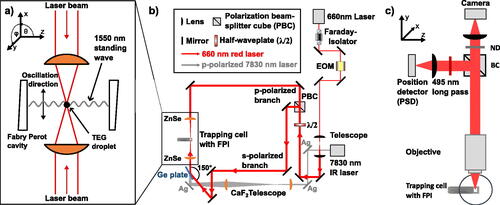
The experiments were performed in a dry nitrogen environment with tetraethylene glycol (TEG) droplets. The TEG droplets were generated using a medical nebulizer (Pari XLent) and compressed nitrogen. After generation, the droplets agglomerated in the trapping region of the tweezers, and the remaining aerosol was flushed with dry nitrogen. During the experiment, the flow was set to zero and the particle oscillation was enabled. The oscillation was induced by sinusoidally modulating the power balance ratio of the two trapping arms between approximately 45:55 and 55:45 using the EOM in combination with a polarization beam-splitter cube. This method is also used in optical balances, and a more detailed description can be found in Reich et al. (Citation2020). The TEG droplets were spatially oscillated with perpendicular to the standing wave formed in the FPI using the optical tweezers. The amplitude of the oscillation was approximately
centered around on one side of the Gaussian profile. Therefore, during one oscillation, the particle probed regions with high intensity close to the beam center and regions with low intensity in the tail of the beam profile. Oscillating the particle into the standing wave allows to measure the effect of the particle by recording the interferometer signal with a lock-in amplifier at the modulation frequency (Zurich Instruments MFLI,
time constant).
During the measurement, the particle was shrunk while oscillating from several micrometers to less than a micrometer in radius over half an hour by exposing it to the colinear infrared laser. Measurements were conducted with and without the IR laser, and no influence by the IR laser on the interferometer signal was observed. The particle was also continuously imaged with a microscope objective and a camera. The integrated scattered intensity detected by the camera was fitted with Mie theory for size retrieval (David et al. Citation2019).
The interferometer signal was recorded for ten droplets and averaged over the individual measurements to obtain an ensemble average. The corresponding ensemble variance was also computed (see Results and Discussion section). Furthermore, a linear transformation was applied to the data based on a least mean square approach with the interferometer model. This step was necessary as the bias and gain of the photodiode in the commercial Fabry-Pérot interferometer were unknown.
Results and discussion
Analytical model
We evaluated our analytical model in MATLAB for the aforementioned experimental configuration. The phase and extinction effects were computed individually as a function of the particle radius for particles located at the maxima () and the node (
) of the standing wave. The model computes the reflected intensity of the etalon, which needs to be normalized by the reflected intensity in the absence of a particle (
) to better study the particle influence. By doing so, we define the relative phase effect (RPE) and the relative extinction effect (REE) as follows:
(14)
(14)
(15)
(15)
(16)
(16)
Both effects are depicted in as a function of particle radius and position in the standing wave. The sum of both effects corresponding to the total relative reflectivity change (TRRC) is shown in and compared with experimental data.
Figure 3. Computed relative phase (a) and extinction (b) effect as a function of the droplet radius for the experimental setup and TEG droplets between and
The two particle positions are indicated individually in each plot.
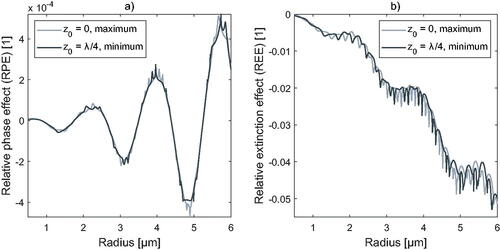
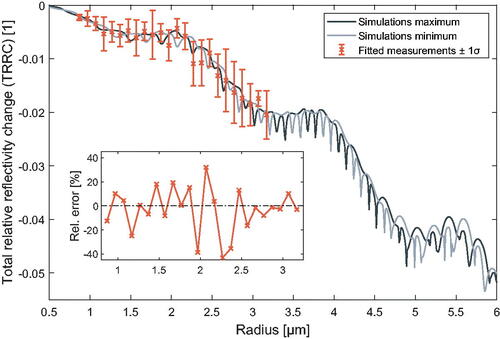
Figure 4. Comparison between simulated reflectivity change and measurements with TEG droplets between and
radius. The insert displays the relative error of the experimental TRRC compared to the model predictions simulated for a particle located between both extrema (
).
Phase effect
The relative phase effect () creates an oscillatory component with increasing amplitude for increasing particle size. The oscillations originate from the interference of the coherently forward scattered light with the non-scattered part of the standing wave. The spatial period of the oscillation is directly proportional to the phase shift of the scattered wave and, therefore, inversely dependent on the refractive index difference between the particle and medium (). The phase effect exhibits no dependence on the position within the standing wave. The small sharp peaks superimposed on the oscillatory structure arise from enhanced forward scattering when morphology-dependent resonances (Mie-resonances) are excited (Bohren and Huffman Citation1998). The amplitude of the phase effect increases strongly with particle radius and is directly proportional to forward scattering (not shown). Nevertheless, the amplitude of the phase effect is approximately two orders of magnitude smaller than the extinction effect () for the investigated particle size range. Furthermore, for our experimental configuration, the phase effect drops nearly to zero for particles smaller than
This is also consistent with the strong decrease of forward scattering when the particle size gets close to the wavelength of the probe beam (
). The particle size dependence shows that the reflectivity change of our FPI for small particles is essentially dominated by extinction.
Extinction effect
The relative extinction effect () dominates the reflectivity change of the interferometer over the studied size range. It exceeds the phase effect by two orders of magnitude for our experimental setup. The extinction effect shows a clear dependence on the particle position, with the locations of Mie resonances undergoing shifts of several between the maxima and minima of the standing wave. This effect has previously been documented in cavity ring-down spectroscopy (Cotterell et al. Citation2016) and is expected due to the position dependency of the effective scattering cross-section. Due to the small collection angle of the etalon, the extinction effect is closely related to the scattering cross-section of the particle and its magnitude continuously increases with increasing particle radius. Due to its negative sign, the REE in decreases with increasing particle radius. Due to the low absorbance of the TEG droplets at the interferometer wavelength (
), no absorption effects could be observed.
Experimental results
The comparison between experimental results obtained from our setup and the theoretical model in shows very good agreement within the investigated size range. The relative error is in the insert is defined as the relative difference between the fitted experimental TRRC data and the results from the model evaluation. The largest relative error (40%) was observed for particles with a radius of For other radii, the error was typically less than 20%. As the exact particle position was not known, the error was computed for particles between the maximum and the node of the standing wave (
). Our measurements represent the first direct and size-resolved measurement of single micrometer-sized particles with a Fabry-Pérot-interferometer. The size fitting error on the radius axis is not indicated as its magnitude is typically below
(David et al. Citation2019).
The variance of the experimental data can be attributed to two main sources. First, the particles probe randomly different positions within the standing wave due to the limited lateral confinement of (2–) within the optical trap. The simulations act as an envelope for this position variability, containing all possible particle positions between the maximum and node. Second, particle movement along the z-axis causes a variation in the oscillation amplitude of the particle between the individual measurements. This variation in amplitude directly transfers into a fluctuation of the demodulated particle signal. The experiment was performed without a feedback stabilization, which would keep the amplitude of the spatial oscillation constant for all particle radii. Therefore, a part of the observed measurement uncertainty is likely created by variations in oscillation amplitude. Higher particle confinement by, e.g., a stronger focus of the trapping beam, could effectively reduce both effects. In addition, implementing feedback stabilization in the optical trap reduces unwanted particle movement and allows to precisely control the oscillation amplitude. Ultimately, morphology-dependent (Mie) resonances should become apparent in the particle signal when both effects are sufficiently reduced.
Variations of cavity geometry
The magnitude of the scattering and phase effect can be tuned by varying the etalon geometry. To assess the geometry dependence, we investigated the influences of small changes in the beam waist radius and the collection angle
Calculations were performed for two beam waist radii (the original and half of its value) and five different etalon collection angles. lists the calculated changes of the phase and extinction effect relative to the original geometry with
and
for three different particle radii of
, and
.
Table 1. Effect of variations in the interferometry geometry evaluated for three different particle radii.
The simulation results indicate that variations in the beam waist radius simultaneously influence the scattering and phase contribution. Reducing the beam waist radius by a factor of two causes up to a fourfold signal increase for the extinct contribution and a twofold increase of the phase effect. The difference arises due to the square root dependency of the reflected electric field on the forward scattered fraction (
), and the linear dependency on the extinct fraction (
see EquationEquation (13)
(13)
(13) ). In contrast, the variations of the opening angle mainly influence the phase contribution. These changes scale proportional to the variation of
causing a fourfold signal increase for four times the initial angle. The effects of changes in the collection angle and beam waist radius are multiplicative. This is directly linked to the computation of the phase and extinction effect where the area of integration scales quadratic with
(see EquationEquation (5)
(5)
(5) ). Furthermore, the scattered and extinct power depend on the beam intensity, which varies quadratic with the beam radius (see EquationEquation (7)
(7)
(7) ). The simulations also show that the enhancement due to the beam waist radius reduction is weaker for larger particles. This is caused by increased forward scattering of large droplets. The collection angle of an etalon could be significantly increased by using confocal resonators, which provide higher tolerance toward off-axis rays (Siegman Citation1986). In such a geometry, values of
(=
) should be achievable. For this example, our model predicts up to a 100-fold signal enhancement of the relative phase effect for half the original beam waist diameter. Both effects show comparable magnitudes in this configuration, and the interference structure of the phase effect should be visible in the measurements.
Another important parameter in the etalon design is the mirror reflectivity R. It defines the quality of the optical resonator, which is quantified by the coefficient of finesse F. Increasing the etalon finesse decreases the width of the resonance peaks, enhancing the phase sensitivity in the operating point. At the same time, the etalon becomes more prone to losses and imperfections, dampening the resonance and changing the Airy profile (Hernandez Citation1985). The etalon employed in our study had a medium-high coefficient of finesse () and exhibited a clear, direct particle effect. The effect becomes even more significant for cavities with higher finesse, where smaller particles will already significantly disturb the Airy profile. Strong disturbance of the transfer function can alter the phase sensitivity in the operating point by changing the slope at this point. This influence should be considered when cavities with high finesse are used, or particles with very high extinction are studied. More details on the change of the transfer function are given in the supplementary information, chapter III.
Implications and outlook
The good agreement between theory and experiments validates the appropriateness of our theoretical approach. Our results indicate that the observed reflectivity change of the Fabry-Pérot interferometer employed in this study is primarily caused by the scattering of the particle. Interference effects inside the cavity were insignificant in the investigated size range. Consequently, similar experimental designs will primarily exhibit a particle signal proportional to the extinction cross-section. The interference contribution becomes relevant for larger particles or cavities with a larger collection angle. A generalized model allows us to extrapolate the influence of such geometry changes on the interferometer signal. The extrapolation suggests that the RPE can be significantly enhanced by increasing the collection angle of the etalon. In combination with changes in the beam waist diameter, the amplitude of RPE and REE should reach comparable magnitudes, making the phase effect experimentally accessible. However, the errors due to the simplifications made in the model derivation will increase with increasing collection angle. Especially phase shifts due to propagation length differences of off-axis rays inside the etalon create a complex fringe pattern (Hercher Citation1968) if the collection angle is set too large. This has not been accounted for in the model so far. Such effects must be considered if collection angles significantly larger than the values presented are investigated.
Understanding the interaction between particle and cavity is relevant for various research methodologies, e.g., photothermal interferometry, cavity-enhanced absorption spectroscopy or continuous wave cavity ring-down spectroscopy. In those techniques, the direct influence of particles on the cavity transfer function is unwanted and contributes to the observed measurement uncertainty by creating a background signal. This problem becomes especially apparent when aerosol particles are studied on a single-particle level. Our results show that this unwanted direct interaction can be reduced using a cavity with a small collection angle and large probe beam diameter. Furthermore, the contribution can be completely eliminated when the particle is not interacting with the cavity beam, e.g., for particles located outside the intra-cavity standing wave. The ability to mathematically describe the particle influence allows also to correct measurements from the direct particle signal in post-processing. However, a necessary requirement for this data correction is precise and continuous monitoring of the particle radius and position within the standing wave.
We propose that the particle signal could also be exploited to characterize aerosol particles without needing an additional characterization method. Based on our findings, the dominant extinction effect makes particle extinction easily experimentally accessible. Probing particle extinction directly with a cavity would follow a similar approach to CRDS but does not require a pulsed laser and a fast photodiode. The phase effect was not accessible with the investigated geometry due to its small magnitude. However, we expect a significant enhancement with small changes in the cavity geometry. Furthermore, with such an adapted experimental design, the phase and extinction effects should be experimentally distinguishable by concurrently measuring the reflected and transmitted intensity of the cavity. In this case, the sum signal of both channels is reduced by the extinct contribution, whereas the difference signal can be related to the phase effect. By using such an adapted cavity geometry, the phase of the coherently forward scattered light could be retrieved from the direct particle signal. The detection of phase information from the interference of forward scattered light opens new possibilities to infer information about the complex refractive index of the particles if their size is known.
Conclusion
With this study, we describe the influence of a single micrometer-sized particle on the reflectivity of a Fabry-Pérot cavity and model it analytically. The model incorporates the cavity geometry, particle properties, and the particle’s position within the standing wave. We find that the direct interaction of a single particle with the standing wave inside a resonant Fabry-Pérot cavity changes the cavity reflectance by several percent. The effect can be separated into two contributions: a phase effect and an extinction effect. The latter depends on the particle position within the intra-cavity standing wave formed in the etalon. Furthermore, the extinction effect is about two orders of magnitude larger than the phase effect for the experimental setup investigated. The phase effect shows an explicit oscillatory behavior following the interference of the coherently forward scattered light of the particle with the non-scattered part in the cavity. The analytical model was successfully validated with experimental data obtained from measurements on isolated tetraethylene glycol droplets optically trapped within the cavity of a Fabry-Pérot interferometer with medium high finesse. We demonstrate that the effect of the particle on the interferometer reflectivity was mainly based on light scattering, and no interference effects could be observed in the size range investigated. Extrapolations based on the theoretical model show that small geometry changes of the cavity can significantly enhance or reduce the phase and scattering contribution. These results can be used for cavity-based measurement techniques such as photothermal interferometry or cavity ring-down spectroscopy to minimize and correct for the unwanted signal directly created by the particle. In addition, the effect could be exploited in a specifically designed cavity to measure particle extinction or forward scattered phase shift.
Supplemental Material
Download PDF (451.6 KB)Acknowledgement
We are grateful to David Stapfer, Markus Steger and Sitaram Stepponat for technical support.
Disclosure statement
No potential conflict of interest was reported by the author(s).
Additional information
Funding
References
- Berden, G., R. Peeters, and G. Meijer. 2010. Cavity ring-down spectroscopy: Experimental schemes and applications. Int. Rev. Phys. Chem. 19 (4):565–607. doi:10.1080/014423500750040627.
- Bohren, C. F., and D. R. Huffman. 1998. Absorption and scattering of light by small particles. New York, NY: Wiley, 4. https://onlinelibrary.wiley.com/doi/book/10 .1002/9783527618156.
- Buisson, H., and C. Fabry. 1910. Mesures de petites variations de longueurs d’onde par la méthode interférentielle. application à différents problèmes de spectroscopie solaire. J. Phys. Theor. Appl. 9 (1):298–316. doi:10.1051/jphystap:019100090029800.
- Cotterell, M. I., J. W. Knight, J. P. Reid, and A. J. Orr-Ewing. 2022. Accurate measurement of the optical properties of single aerosol particles using cavity ring-down spectroscopy. J. Phys. Chem. A 126 (17):2619–31. doi:10.1021/acs.jpca.2c01246.
- Cotterell, M. I., B. J. Mason, T. C. Preston, A. J. Orr-Ewing, and J. P. Reid. 2015. Optical extinction efficiency measurements on fine and accumulation mode aerosol using single particle cavity ring-down spectroscopy. Phys. Chem. Chem. Phys. 17 (24):15843–56. doi:10.1039/c5cp00252d.
- Cotterell, M. I., T. C. Preston, A. J. Orr-Ewing, and J. P. Reid. 2016. Assessing the accuracy of complex refractive index retrievals from single aerosol particle cavity ring-down spectroscopy. Aerosol Sci. Technol. 50 (10):1077–95. doi:10.1080/02786826.2016.1219691.
- Cremer, J. W., K. M. Thaler, C. Haisch, and R. Signorell. 2016. Photoacoustics of single laser-trapped nanodroplets for the direct observation of nanofocusing in aerosol photokinetics. Nat. Commun. 7 (1):10941. doi:10.1038/ncomms10941.
- David, G., O. Reich, M. E. Divéky, S. Roy, E. A. Parmentier, J. W. Cremer, K. Esat, and R. Signorell. 2019. Characterization and control of droplets optically trapped in air. In Optical Trapping and Optical Micromanipulation XVI, SPIE, 9. doi:10.1117/12.2528743.
- Davis, C. C., and S. J. Petuchowski. 1981. Phase fluctuation optical heterodyne spectroscopy of gases. Appl. Opt. 20 (24):4151. doi:10.1364/ao.20.002539.
- Diveky, M. E. 2022. Photothermal single-particle spectroscopy - water transport across the air-liquid interface of organic aerosol droplets photothermal single-particle. PhD thesis. ETH Zuerich.
- Fiedler, S. E., A. Hese, and A. A. Ruth. 2003. Incoherent broad-band cavity-enhanced absorption spectroscopy. Chem. Phys. Lett. 371 (3–4):284–94. doi:10.1016/S0009-2614(03)00263-X.
- Gouesbet, G. 2010. T-matrix formulation and generalized Lorenz-Mie theories in spherical coordinates. Optics Commun. 283 (4):517–21. doi:10.1016/j.optcom.2009.10.092.
- Gouesbet, G. 2014. Latest achievements in generalized Lorenz-Mie theories: A commented reference database. Annalen der Physik 526 (11–12):461–89. doi:10.1002/andp.201400184.
- Hayden, J., B. Baumgartner, J. P. Waclawek, and B. Lendl. 2019. Mid-infrared sensing of CO at saturated absorption conditions using intracavity quartz-enhanced photoacoustic spectroscopy. Appl. Phys. B. 125 (9):159. doi:10.1007/s00340-019-7260-6.
- Hercher, M. 1968. The spherical mirror Fabry-Perot interferometer. Appl. Opt. 7 (5):951–66. doi:10.1364/AO.7.000951.
- Hernandez, G. 1985. Fabry-Perot with an absorbing etalon cavity. Appl. Opt. 24 (18):3062. doi:10.1364/ao.24.003062.
- Hulst, H. C. d. 1981. Light scattering by small particles. New York, NY,: Dover Publications, Inc. ISBN: 0486642283.
- Jin, W., Y. Cao, F. Yang, and H. L. Ho. 2015. Ultra-sensitive all-fibre photothermal spectroscopy with large dynamic range. Nat. Commun. 6 (1):6767. doi:10.1038/ncomms7767.
- Jones, P. H., O. M. Maragò, and G. Volpe. 2015. Optical tweezers. Cambridge: Cambridge University Press. doi:10.1017/CBO9781107279711.
- Krzempek, K. 2019. A review of photothermal detection techniques for gas sensing applications. Appl. Sci. (Switzerland) 9 (14): 2826. doi:10.3390/app9142826.
- Lin, H. B., and A. J. Campillo. 1985. Photothermal aerosol absorption spectroscopy. Appl. Opt. 24 (11):668–81. doi:10.1364/ao.24.000422.
- Maity, A., S. Maithani, and M. Pradhan. 2021. Cavity ring-down spectroscopy: Recent technological advancements, techniques, and applications. Anal. Chem. 93 (1):388–416. doi:10.1021/acs.analchem.0c04329.
- Masson-Delmotte, V., P. Zhai, A. Pirani, S. L. Connors, C. Péan, S. Berger, N. Caud, Y. Chen, L. Goldfarb, M. I. Gomis, et al. 2021. IPCC, 2021: Summary for Policymakers. In: Climate Change 2021: The Physical Science Basis. Contribution of Working Group I to the Sixth Assessment Report of the Intergovernmental Panel on Climate Change. https://www.ipcc.ch/report/ar6/wg1/chapter/summary-for-policymakers/.
- Mellon, D., S. J. King, J. Kim, J. P. Reid, and A. J. Orr-Ewing. 2011. Measurements of extinction by aerosol particles in the near-infrared using continuous wave cavity ring-down spectroscopy. J. Phys. Chem. A 115 (5):774–83. doi:10.1021/jp109894x.
- Miller, J. L., and A. J. Orr-Ewing. 2007. Cavity ring-down spectroscopy measurement of single aerosol particle extinction. II. Extinction of light by an aerosol particle in an optical cavity excited by a cw laser. J. Chem. Phys. 126 (17):174303. doi:10.1063/1.2723736.
- Moosmüller, H., R. K. Chakrabarty, and W. P. Arnott. 2009. Aerosol light absorption and its measurement: A review. J. Quantitative Spectrosc. Radiative Transfer 110 (11):844–78. doi:10.1016/j.jqsrt.2009.02.035.
- Morton, P. A., and M. J. Morton. 2018. Ultra-low noise hybrid lasers for microwave photonics and optical sensing. J. Lightwave Technol. 36 (21):5048–57. doi:10.1109/JLT.2018.2817175.
- Niklas, C., H. Wackerbarth, and G. Ctistis. 2021. A short review of cavity-enhanced Raman spectroscopy for gas analysis. Sensors (Basel) 21 (5):1–21. doi:10.3390/s21051698.
- Pérot, A., and L. Fabry. 1899. Sur l’application de phénomènes d’interférence à la solution de divers problèmes de spectroscopie et de métrologie. bastr. 16 (1):5–32. doi:10.3406/bastr.1899.11401.
- Pettit, D. R., and T. W. Peterson. 1982. Coherent detection of scattered light from submicron aerosols. Aerosol Sci. Technol. 2 (3):351–68. doi:10.1080/02786828308958640.
- Radeschnig, U., M. Knoll, B. Lang, and A. Bergmann. 2021. Photothermal monitor for black carbon mass concentration using a fiber-coupled fabry-pérot interferometer. Optics InfoBase Conference Papers 2021:5–6. doi:10.1364/es.2021.eth1a.5.
- Reich, O., G. David, K. Esat, and R. Signorell. 2020. Weighing picogram aerosol droplets with an optical balance. Commun. Phys. 3 (1):223. doi:10.1038/s42005-020-00496-x.
- Schäfer, J., S. C. Lee, and A. Kienle. 2012. Calculation of the near fields for the scattering of electromagnetic waves by multiple infinite cylinders at perpendicular incidence. J. Quantitative Spectros. Radiative Transfer 113 (16):2113–23. doi:10.1016/j.jqsrt.2012.05.019.
- Schäfer, J.-P. 2011. Implementierung und Anwendung analytischer und numerischer Verfahren zur Lösung der Maxwellgleichungen für die Untersuchung der Lichtausbreitung in biologischem Gewebe. PhD thesis, Open Access Repositorium der Universität Ulm und Technischen Hochschule Ulm. doi:10.18725/OPARU-1914.
- Shao, L., J. Mei, J. Chen, T. Tan, G. Wang, K. Liu, and X. Gao. 2022. Recent advances and applications of off-axis integrated cavity output spectroscopy. Micro. & Optical Tech. Lett. 65 (5):1489–505. doi:10.1002/mop.33220.
- Siegman, A. 1986. Lasers. Mill Valley, CA: University Science Books.
- Stocker, T. F., D. Qin, G.-K. Plattner, L. V. Alexander, S. K. Allen, N. L. Bindoff, F.-M. Bréon, J. A. Church, U. Cubasch, S. Emori, et al. 2013. Technical summary. In The Physical Science Basis: Working Group I Contribution to the Fifth Assessment Report of the Intergovernmental Panel on Climate Change, 31–116. Cambridge, UK: Cambridge University Press. doi:10.1017/CBO9781107415324.005.
- The Dow Chemical Company. 2007. The Dow Chemical Company: Tetraethylene glycol. Hoboken, NJ: The Dow Chemical Company. Technical Report.
- Vaughan, J. M. 1989. The fabry-perot interferometer: History, theory, practice and applications, 89–101. New York, NY: Taylor & Francis. doi:10.1201/9780203736715.
- Visser, B., J. Röhrbein, P. Steigmeier, L. Drinovec, G. Močnik, and E. Weingartner. 2020. A single-beam photothermal interferometer for in situ measurements of aerosol light absorption. Atmos. Meas. Tech. 13 (12):7097–111. doi:10.5194/amt-13-7097-2020.
- Wang, P., W. Chen, F. Wan, J. Wang, and J. Hu. 2020. A review of cavity-enhanced Raman spectroscopy as a gas sensing method. In: Applied Spectroscopy Reviews 55 (5):393–417. doi:10.1080/05704928.2019.1661850.
- Wang, Z., Q. Wang, W. Zhang, H. Wei, Y. Li, and W. Ren. 2019. Ultrasensitive photoacoustic detection in a high-finesse cavity with Pound–Drever–Hall locking. Opt. Lett. 44 (8):1924–7. doi:10.1364/ol.44.001924.
- Wheeler, M. D., S. M. Newman, A. J. Orr-Ewing, and M. N. Ashfold. 1998. Cavity ring-down spectroscopy. Faraday Trans. 94 (3):337–51. doi:10.1039/a707686j.