
Abstract
Portable instruments that can measure the number concentration and size of airborne nanoparticles are very useful for assessing their impacts on human health and climate, mainly because they can enable personal monitoring when carried by individuals, and/or 2- or 3-dimensional mappings when employed onboard mobile platforms. Partector 2 (P2), which is a lightweight and portable instrument manufactured by Naneos Particle Solutions GmbH (Windisch, Switzerland), can determine the concentration (up to 106 #/cm3) and average diameter of aerosol particles having sizes from 10 to 300 nm, making it an excellent candidate for such measurements. Although its performance has been investigated at standard conditions (i.e., ground level pressure and room temperatures), it has not been assessed under reduced pressure and temperature conditions that are typically encountered at higher altitudes; e.g., when employed outdoors in mountainous environments and/or onboard Unmanned Aerial Systems; UASs. Here we assess the counting and sizing capabilities of P2 at temperatures from ca. 22 down to 4 °C, and pressures from 1013 down to 710 hPa that correspond to altitudes from sea level to ca. 3 km. Our results show that the performance of the instrument is not substantially affected when operated at these conditions, remaining within the accuracy thresholds of ±30% reported by the manufacturer. P2, therefore, qualifies for outdoor use at higher altitudes, and can be employed in such environments to determine the number concentration and mean size of sub-300 nm aerosol particles, complementing existing portable optical particle counters that are already employed onboard aerial systems.
EDITOR:
1. Introduction
Aerosol particles in the atmospheric environment affect the local, regional and global climate (IPCC Citation2013; Seinfeld et al. Citation2016), and have adverse impacts upon human health (Schwartz and Neas Citation2000; WHO Citation2000; Atkinson et al. Citation2015). Measuring their concentration and probing their physicochemical properties, both in indoor and outdoor environments, is therefore of high importance for assessing their environmental and health impacts, and subsequently for setting and optimizing strategies for their mitigation. For indoor air quality studies, typically a suite of aerosol instruments is employed for probing the properties of indoor aerosol particles (Asbach, Clavaguera, and Todea Citation2015; Lowther et al. Citation2019), and for assessing exposure and potential associated health impacts of occupants (Morawska et al. Citation2013; Morawska et al. Citation2017). In the outdoor environment, networks of ground-level observational stations (e.g., the Aerosols, Clouds and Trace gases Research Infrastructure; ACTRIS; Pappalardo Citation2018; ACTRIS Citation2023), equipped with a wide range of laboratory-grade aerosol instruments, are employed to probe the physicochemical properties of atmospheric aerosol particles for studying their impacts on climate and human health. While valuable information can be obtained by laboratory-grade instruments, their use is often prohibited by their limited portability, their relatively high installation and operational costs, and the fact that they require stable conditions (i.e., temperature-controlled rooms) to operate.
Efforts over the recent years have been devoted to make aerosol instruments more compact and less expensive, in order to 1. deploy them in big numbers within dense observational networks that can provide measurements of high spatial resolution (Kumar et al. Citation2015; Barmpounis et al. Citation2016; Tanzer et al. Citation2019; Sá et al. Citation2022), and 2. use them on mobile platforms or as personal monitoring systems (Koehler and Peters Citation2015; Wang et al. Citation2019). Achieving these goals comes at the expense that compact and cost-effective instruments typically exhibit inferior performance in terms of accuracy, detection thresholds and measuring range compared to their bench-type/laboratory-grade counterparts. Despite that, however, they comprise the only realistic choice for use onboard lightweight mobile platforms, such as Unmanned Aerial Systems (UASs), for determining vertical profiles of certain parameters of the atmospheric aerosol as they have significant advantages over manned research aircraft (Villa et al. Citation2016; Lambey and Prasad Citation2021; Kezoudi et al. Citation2021). We should note here that UASs do not have enclosed pressure and temperature regulated compartments as the manned aerial vehicles, and thus the performance of the instruments they carry has to be verified under different pressure and temperature conditions.
Lightweight Optical Particle Counters (OPCs), tested at reduced pressure and temperature conditions (e.g., Bezantakos, Schmidt-Ott, and Biskos Citation2018), are commonly employed onboard UASs for counting and sizing airborne particles having diameters larger than ca. 300 nm (e.g., Kezoudi et al. Citation2021). Smaller particles can be detected and counted by Condensation Particle Counters (CPCs; Agarwal and Sem Citation1980), but information on their size is lost as the sampled particles have to be grown to the micrometer range by condensation in order to be detected and counted. To this end, we have recently tested the performance of the portable TSI Model 3007 CPC (TSI Inc., Shoreview, MN, USA) at reduced pressure and temperature conditions (Bezantakos and Biskos Citation2022), which has already been used onboard UASs (e.g., Lampert et al. Citation2020; Brus et al. Citation2021) for measuring the number concentration of sub-micrometer aerosol particles at higher altitudes.
To determine the size and number concentration of sub-300 nm aerosol particles at higher altitudes with UASs, thus complementing observations conducted already with OPCs, portable instruments relying on unipolar diffusion charging and subsequent measurement of the current induced by the charged aerosol particles, offer great opportunities. One of the first lightweight and portable instruments based on this principle is the miniaturised diffusion size classifier (DISCmini; Testo North America, West Chester, USA), introduced by Fierz et al. (Citation2008, Citation2011). The concept was further developed by Fierz et al. (Citation2014), who introduced an instrument (referred to as Partector; Naneos Particle Solutions GmbH, Windisch, Switzerland) that employs a pulsating corona charger and an open-path (i.e., without a particle filter) Faraday cage aerosol electrometer. In this manner, the Partector is capable of measuring an oscillating current, which is induced when packets of charged and uncharged aerosol particles pass through the open-path Faraday cage electrometer (cf. Fierz et al. Citation2014, and Fierz et al. Citation2015 for more details). This instrument offers significant advantages over the DISCmini, including less frequent maintenance, due to the fact that particle counting by the open-path electrometer is contactless, avoiding particle deposition on a filter, which also allows for additional measurements to be conducted downstream the device if necessary. In addition, due to its open-path design and mode of operation driven by an oscillating current, the electrometer employed in the Partector is not affected by environmental conditions (i.e., temperature, relative humidity, etc.), or other factors producing offsets to the signal of filter-equipped Faraday-cage aerosol electrometers that need to be “zeroed” periodically. We should note here that due to its design and operating principle, the Partector produces a signal that is proportional to the particle Lung-Deposited Surface Area (LSDA), without providing information on the particle size and number concentration (Fierz et al. Citation2014).
The performance of the “DISCmini” and the “Partector” has been evaluated by Fierz et al. (Citation2011) and Fierz et al. (Citation2014), as well as by a number of independent research groups (e.g., Asbach et al. Citation2017; Todea et al. Citation2017) more recently. The consensus from these studies is that these instruments have counting accuracies within ±30% when sampling neutral and polydisperse aerosol particles. Higher deviations are observed when sampling particles larger than 400 nm (Todea et al. Citation2017), or when the geometric standard deviation of the sampled aerosol particles significantly differs from those used for calibration. Deviations have also been reported when using conductive silicone tubing upstream these instruments, as degassing species entering the aerosol sample can affect the composition of the ions produced by the corona charger and consequently the particle charging efficiency (Asbach et al. Citation2016; Asbach et al. Citation2017). Despite that, the portability and ease of operation has enabled a number of personal monitoring and indoor/workplace exposure studies using these two instruments (e.g., Geiss, Bianchi, and Barrero-Moreno Citation2016; Lavicoli et al. Citation2018; Salo et al. Citation2021; Khaki, Rio, and Marin Citation2022). In addition, these instruments have also been used onboard UASs for airborne measurements (Kuuluvainen et al. Citation2018; Haugen et al. Citation2022), conducted at low (i.e., near ground) altitudes, where the temperature and pressure were similar to that at ground level.
“Partector 2” (Naneos Particle Solutions GmbH, Windisch, Switzerland; referred to as P2 from this point onward), is an updated version of Partector in the sense that it can provide information on the particle number concentration and average particle diameter in addition to the LDSA. To the best of our knowledge, the performance of P2, and in general of portable instruments using unipolar chargers and induced currents, at low temperature and pressure conditions encountered at higher altitudes, has not been tested yet. In this work we characterize the P2 under conditions of reduced temperatures and pressures that the instrument can encounter when operated at altitudes of up to ca. 3 km above sea level.
2. Methods
2.1. Operating principle of P2
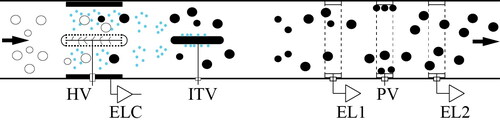
A short description of P2, including its dimensions, is included in the online supplementary information (SI, (cf. Section S.1). The instrument has a sample flow rate of 500 cm3/min, driven by a self-regulated internal pump. The P2 uses an open-path electrometer, similarly to Partector (Fierz et al. Citation2014, Citation2015), but in addition this is followed by an electrostatic deposition stage and one more open-path electrometer in an in-series configuration (cf. ). In brief, the sample flow passes through a unipolar diffusion charger, an ion trap, the first open-path Faraday-cage aerosol electrometer, the electrostatic precipitator and finally through the second aerosol electrometer. The charger is operated in a pulsing on-off mode at a frequency of 0.5 Hz, thus periodically changing the charge state of the sampled aerosol. Excess ions are removed by the ion trap, while parcels of charged aerosol particles induce oscillating currents as they pass through the open-path aerosol electrometers. The amplitude of the induced currents is proportional to the charge state of the sampled aerosol (Fierz et al. Citation2014), which in turn is proportional to the product of the number concentration and average charge per particle that depends on their size (cf. Fierz et al. Citation2014, Citation2015 and references therein). The electrostatic precipitator between the two aerosol electrometers acts as a low pass mobility filter, exhibiting different transmission efficiency for particles of different mobilities. By comparing the signal of the second electrometer with the signal of the first electrometer, one can determine both the concentration and the average particle diameter of the sampled particles using the approach employed in the DISCmini (Fierz et al. Citation2011).
Figure 1. Schematic layout of the P2, including the pulsating corona, the ion trap, the two open-path Faraday cage electrometers, and the electrostatic precipitator between them. The first electrometer measures the oscillating current induced by all the charged particles, while the second measures the oscillating current induced by charged particles, larger than a threshold size, penetrating the electrostatic precipitator.
2.2. Experimental setup and procedure
The performance of P2 at reduced temperature and pressure conditions (i.e., from ca. 22 down to 4°C, and from 1013 to 710 hPa, respectively) was assessed with polydisperse and monodisperse ammonium sulfate aerosol particles produced by atomization in two different sets of experiments. The experimental configurations employed in our tests are shown in . In all experiments the tested P2 was placed within a temperature- and pressure-controlled stainless steel cylindrical chamber having a diameter of 0.4 m and a length of 1.4 m (cf. Bezantakos, Schmidt-Ott, and Biskos Citation2018, for more details). Polydisperse ammonium sulfate aerosol particles were produced by an aerosol atomizer (TSI Model 3076; TSI Inc., Shoreview, MN, USA) operated with particle-free compressed air. The particles were then dried by passing them through a silica diffusion dryer (TSI Model 3062; TSI Inc., Shoreview, MN, USA) and subsequently charged-neutralized by a soft X-ray source (TSI Model 3088; TSI Inc., Shoreview, MN, USA). One part of the flow was directed to a Scanning Mobility Particle Spectrometer (SMPS; Wang and Flagan Citation1990) located outside the environmental chamber, and the other to the P2 that was placed in the chamber (cf. ). The SMPS consisted of a long cylindrical DMA, (TSI Model 3081; TSI Inc., Shoreview, MN, USA), driven by a classifier (TSI 3080; TSI Inc., Shoreview, MN, USA), and a water-based CPC (TSI Model 3786; TSI Inc., Shoreview, MN, USA). The sheath and sample flow rates through the DMA were set to 6 and 0.6 lpm, respectively, yielding a sheath to aerosol flow ratio of 10:1.
Figure 2. Schematic layout showing the main parts of the experimental setups used for assessing the performance of P2 with polydisperse (a) and monodisperse (b) ammonium sulfate aerosol particles.
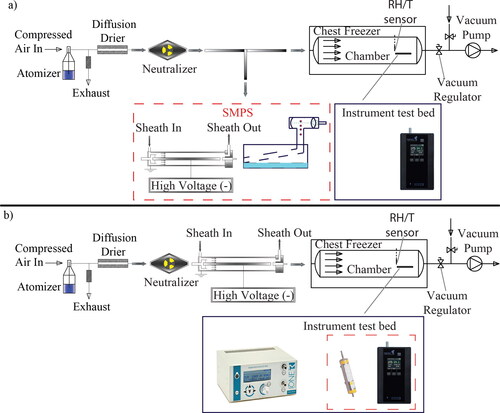
The measurements carried out with the experimental setup shown in were employed to determine the sizing performance of P2, but not its counting accuracy. This is because particle losses in the valve and along the tubing bringing the aerosol in the chamber are difficult to determine accurately in order to directly compare the particle number concentration measured by the SMPS (located outside the chamber) with that measured by P2 (located in the chamber). To circumvent this problem, we carried out experiments with monodisperse ammonium sulfate aerosol particles having sizes from 20 to 160 nm, produced by the atomizer and size-selected by the DMA of the SMPS. In these measurements, we placed an aerosol electrometer (Ioner Model EL-5030; RAMEM S.A, Torrejón de Ardoz, Spain) next to P2 within the chamber for direct comparison of the concentration of particles reported by the two instruments, similarly to Hermann and Wiedensohler (Citation2001), as shown in . Any effects on the sizing performance of P2 caused by changes in the pressure and temperature along the experimental setup could also be assessed by comparing the average particle diameter reported by the instrument to that selected by the DMA upstream. In this setup, the DMA was operated at a constant voltage and with a sheath flow rate fixed at 12 lpm. The sample flow through the DMA was adjusted from 0.6 to 1.2 lpm, yielding sheath to aerosol flow ratios ranging from 20:1 to 10:1, in order to produce aerosols with particle number concentrations from a couple of thousand to few tens of thousands #/cm3 (depending on the particle size and pressure conditions) within the chamber.
A second 85Kr-source charge neutralizer (TSI Model 3077 A; TSI Inc., Shoreview, MN, USA) was placed upstream the P2 within the chamber in order to bring the sampled particles to an equilibrium charge distribution, with the majority of them being neutral. This was necessary considering that the open-path electrometers within the P2 produce a signal that is sensitive to changes in the charge state of the sampled particles, which is also the reason why the instrument is calibrated with charge-neutralized particles by the manufacturer. We should note here that although the P2, similarly to the DISCmini, is calibrated with monodisperse aerosol particles, it employs a calibration curve calculated for a lognormal size distribution having a geometric standard deviation (GSD) of 1.9 (Naneos GmbH, 2024). As a result, when the P2 samples monodisperse aerosol particles it exhibits systematic biases in both the reported particle number concentration and the average particle diameter, which do not reflect its performance when sampling polydisperse aerosols.
Before any experiment we tested all instruments and ensured that they were synchronized. The chamber was flushed with aerosol-free air (i.e., HEPA filtered) for ca. 20 min prior any experiment, reducing the aerosol concentration to <40 #/cm3.
In the experiments with the polydisperse aerosol particles, P2 was reporting measurements with a temporal resolution of 1 Hz, whereas the scanning time of the SMPS was set to 3 min. During these experiments the pressure within the chamber was maintained at 1013 hPa, while the temperature was continuously reduced from ca. 22 to ca. 4 °C over a period of almost 4 h. Once the lowest temperature was reached, the pressure within the chamber was reduced to 811 and finally to 710 hPa, whereas measurements by both instruments (i.e., the P2 and the SMPS) were collected for at least 10 min at each pressure setting. In the tests using monodisperse aerosol particles, we first “zeroed” the reference electrometer immediately after flashing the chamber. The signals from the P2 and the reference electrometer were then recorded with a time resolution of 1 Hz over a period of ca. 15 min for each temperature/pressure combination. Experiments were conducted at 22, 15, 10, and 4°C at a pressure of 1013 hPa, and at three different pressures (i.e., 710, 861, and 1013 hPa) at room temperature (i.e., at 22 °C). An additional experiment was conducted at conditions of both reduced temperature (i.e., 4 °C) and pressure (i.e., 710 hPa). We paid special attention to maintaining the relative humidity below 40% in all parts of the setup, and especially within the temperature/pressure-controlled chamber, at all tested conditions in order to ensure that the ammonium sulfate particles remained dry.
In addition to the instruments described above, a Rotronic HC2-05 sensor (Rotronic AG, Bassersdorf, Switzerland) and a Sensidyne Gilibrator 2 (Sensidyne, St. Petersburg, FL, USA) were used, respectively, to monitor the temperature and relative humidity inside the chamber, and various flow rates of the experimental setup.
2.3. Data processing
In all our experiments, the P2 measurements were recorded and converted to particle concentrations and average particle diameters by the latest firmware (version 222) of the instrument. We should note that while P2 reports measurements every 1 s, a moving average filter with a time interval of 4 s (i.e., the preceding 3 s were also accounted for) is employed in its firmware. During the experiments with the polydisperse aerosol particles, the measurements were further averaged over the duration of each SMPS sample (i.e., 180 s). The sizing performance of the P2 in this case was expressed as the ratio between the average particle diameter reported by the instrument and the fitted geometric mean diameter (GMD) determined by the SMPS measurements, which were inverted by the software (TSI AIM, version 9c; TSI Inc., Shoreview, MN, USA) provided by the manufacturer. In the experiments with monodisperse aerosol particles, the counting efficiency of P2 was calculated as the ratio of the particle number concentration reported by the instrument divided by that measured by the reference electrometer, whereas its sizing performance as the ratio of the reported average particle diameter divided by the nominal size of particles selected by the DMA. The particle number concentration measured by the reference electrometer was determined by dividing the measured current by the flow rate through the electrometer and the elementary charge (i.e., 1.15 lpm and 1.6 × 10⁻¹⁹ Cb; cf. section A1 in the SI for additional information). We should note that multiply charged particles did not have any significant impact in the experiments with monodisperse particles, considering the size distributions of the particles produced by the atomizer and their charge distribution (cf. section A2 in the SI for more details). Similarly to the data processing conducted by the P2 firmware, a moving average filter of 4 s was further applied to the reference electrometer measurements.
3. Results and discussion
3.1. Effects of reduced temperatures and pressures
Potential effects on the performance of P2 caused by the reduced temperature and pressure conditions used in the tests conducted in this work can be understood by examining how the performance of the different parts of the instruments are affected at different conditions.
The first part of the instrument that can be affected by the reduced temperature/pressure conditions is its pulsating unipolar charger (cf. Section 2.2). Pressure affects the electrical mobility of the ions, while temperature their mean thermal velocity, which in turn both affect their diffusion coefficient and mean free path (Baron and Willeke Citation2001). For instance, a pressure reduction of 30% (i.e., similar to exposing the instrument to 710 hPa of absolute pressure compared to the pressure at sea level) will cause a 30% increase in these properties. On the other hand, operating the instrument at 4 °C causes a reduction of ca. 3% to the mean ionic thermal velocities and mean free path, and a reduction of ca. 7% in the ionic diffusion coefficients when compared to the values at standard conditions (i.e., 22 °C and 1013 hPa).
The response of the instrument depends on the mean number of charges that the particles pick up from the corona charger, and specifically on the properties of the ions produced in its charger, which can be affected by the operating temperature and, most importantly, pressure. To investigate the effects of pressure and temperature on the charging efficiency and on the mean number of charges picked up by the particles passing through the corona charger, we employed the birth-and-death model proposed by Boisdron and Brock (Citation1970) with combination coefficients calculated by the limiting sphere theory (Fuchs Citation1963), as described by Biskos, Reavell, and Collings (Citation2005). Based on these calculations, by decreasing the temperature to 4 °C and the pressure to 710 hPa, the mean charge of the particles, having diameters from 10 to 300 nm, that undergo unipolar diffusion charging, is increased by less than 3%.
Another part of the instrument that can be affected by the operating temperature and pressure, is the electrostatic precipitator located between the two open-path electrometers (cf. Section 2.2), as a result of changes of the electrical mobility of the sampled aerosol particles assuming that their charged state remains unchanged. Pressure affects the mean free path of air, while temperature its viscosity, both of which determine the electrical mobility of the particles (Hinds Citation1999). Reducing the temperature from 22 to 4 °C causes a small increase (ca. 5%) in the electrical mobility of the sampled particles ranging in size from 20 to 160 nm. Similarly, reduction of the pressure from 1013 to 710 hPa increases the electrical mobility of the particles by 25 to 40%, depending on their size, with the smaller particles being affected more significantly.
Taken together, the performance of the corona charger is not significantly altered at the reduced temperature and pressure conditions tested here, but any potential effects on the operating principle of the instrument would be associated with changes in the performance of the electrostatic precipitator stage, which is related to the dependence of the particle electrical mobility on temperature and pressure. These effects, together with relevant corrections applied to the flow measuring system used to compensate for changes of the environmental conditions, were taken into account by the manufacturer in firmware versions above version 195, including the one (version 222) used in the system we tested here (personal communication with Naneos Particle Solutions Gmbh). With these upgrades, the manufacturer aimed in maintaining the accuracy of P2 within ±30%, even when the instrument is subjected to reduced pressures and temperatures.
3.2. Experiments with polydisperse aerosol particles
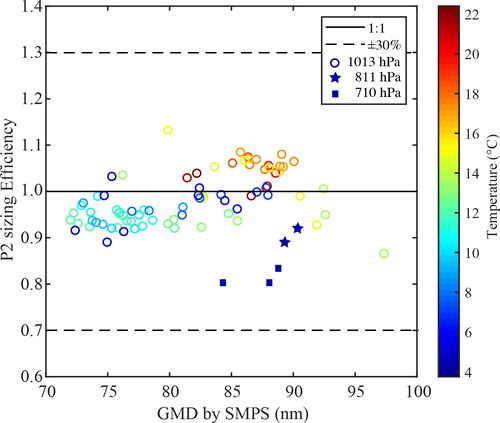
The sizing performance of P2, when sampling polydisperese aerosol particles, at 1013 hPa pressure and at temperatures ranging from ca. 22 to 4 °C, as well as at a combination of reduced temperature and lower than atmospheric pressures (i.e., 4 °C and 811 or 710 hPa), is shown in . The polydisperse aerosol particles had an average GMD of ca. 80 nm (ranging from ca. 70 to 100 nm) and an average GSD of 1.61 (ranging between 1.56 and 1.76) as determined by the SMPS measurements (cf. Figure S2 in the SI for a typical example of these measurements). Our observations showed that the average particle diameters reported by P2 were not affected by reducing the temperature. Even without any compensation from the firmware of the instrument, this is expected by the insignificant temperature-related changes of the deposition efficiency of the sampled aerosol particles in its electrostatic precipitator (cf. section 3.1). At reduced pressures and temperatures, P2 exhibited a small decreasing trend in its sizing efficiency, reporting average particle diameters that were ca. 10 and 20% less than the GMDs determined from the SMPS measurements at 811 and 710 hPa, respectively. Such deviations are, however, well within the accuracy reported by the manufacturer, and demonstrate that the pressure compensation included in the firmware of the instrument is capable of maintaining its accuracy even at these conditions. As discussed above, the counting efficiency of P2 was not assessed in this set of measurements because the SMPS and the P2 sampled the test aerosol outside and inside the chamber, respectively, where the concentrations of the particles are different due to losses within the tubes and the valves that were hard to quantify.
Figure 3. Sizing performance of the P2 when sampling polydisperse ammonium sulfate aerosol particles at temperatures ranging from ca. 4 to 22 °C and 1013 hPa of pressure (circle symbols with color denoting temperature), as well as at pressures of 811 (star symbols) and 710 (square symbols) hPa at the lowest temperature (i.e., 4 °C) used in our experiments. The x axis represents the geometric mean diameter (GMD) of the sampled aerosol particles determined by the SMPS measurements, which was located outside the chamber at room temperature. The sizing efficiency (shown in the y axis) is determined as the ratio between the average particle diameter reported by the P2 and the GMD derived by the SMPS measurements. We should note that each point corresponds to one SMPS measurement (carried out over 180 s), thus corresponding to 180 measurements recorded by the P2.
3.3. Experiments with monodisperse aerosol particles
shows the counting and sizing efficiency of P2 when measuring monodisperse ammonium sulfate aerosol particles having nominal sizes from 20 to 160 nm at the lowest experimental temperature and pressure conditions (i.e., 4 °C temperature and 710 hPa pressure), normalized by the respective counting and sizing efficiency determined under normal conditions, i.e., at 22 °C and 1013 hPa. We should note here that the counting and sizing efficiency of P2 when sampling monodisperse aerosol particles do not reflect its performance when sampling particles in ambient air because the instrument is calibrated with polydisperse laboratory-generated aerosols (cf. Section 2) that mimic those commonly observed in the atmospheric environment. Nevertheless, the use of monodisperse aerosol particles downstream the DMA enables using an electrometer within the environmental chamber, which can serve as a reference instrument for the particle number concentration in our experiments given that its counting efficiency is not affected by the test conditions. This is in contrast to CPCs whose performance is affected by temperature and pressure conditions, such as the TSI 3007 CPC that is compact enough to be used in the chamber we employed, but has a counting efficiency that is affected by temperature (Bezantakos and Biskos Citation2022).
Figure 4. Normalized detection (a) and sizing (b) efficiency of the P2 at 4°C and 710 hPa, when sampling monodisperse aerosol particles having sizes from 20 to 160 nm. The efficiencies are normalized with respect to those measured with the same test aerosol, but under standard operating conditions (i.e., ca. 22°C and 1013 hPa). The measurements correspond to average detection and sizing efficiencies determined experimentally over a period of ca. 15 min, whereas error bars denote ±1 standard deviations.
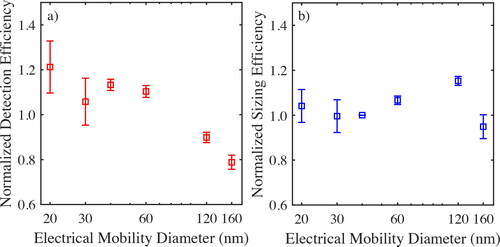
The counting efficiency of the P2 when exposed to reduced temperature and pressure conditions shows small deviations from that at standard conditions (i.e., 22 °C temperature and 1013 hPa pressure) that are lower than 25% for all the sizes of the tested particles (cf. ). These variations are more pronounced for the smallest and largest monodisperse aerosol particles (i.e., particles having sizes of 20 and 160 nm), for which the concentrations are, respectively, overestimated and underestimated. Reducing both pressure and temperature to 4 °C and 710 hPa, respectively, affects the sizing efficiency of P2 at a lesser extend; i.e., within less than 15% on average as shown in . However, such deviations are not considered substantial as the nominal accuracy of the P2 is ±30% at normal pressure and temperature conditions, according to the manufacturer. Maintaining the accuracy of the instrument within the same range at reduced pressure and temperature conditions, shows that the inversion algorithm effectively compensates for such changes. The actual (i.e., not normalized) performance of P2 when sampling monodisperse aerosols at standard and reduced pressure/temperature conditions remains rather unaffected (cf. Figure S1 in the SI). The discrepancies between the reported number concentrations and average particle diameters between the P2 and the reference instruments, which results in size dependent deviations in its counting and sizing performance (cf. Figure S3 in the SI), are the result of the monodispersity of the sampled aerosols, i.e., something that the instrument is not designed to comply with.
4. Conclusions
We have carried out experiments to determine the performance of the Naneos P2 when operated under lower than standard pressure and temperature conditions (i.e., from 710 to 1013 hPa, and from ca. 4 to ca. 22 °C, respectively). Such conditions can affect the response of the instrument by changing the charging efficiency of the sampled particles and their deposition efficiency on its electrostatic precipitator. The updated inversion algorithm embedded in the firmware (versions 195 and above) of the instrument, compensates for the effects of reduced temperature and most importantly pressure. The results show that the measurements reported by the instrument are not substantially affected by the environmental conditions tested here, being always within the accuracy limits reported by the manufacturer; i.e., within less than ±30%. Reduced temperatures alone had no effect on the performance of the instrument. Considering the operating principles of the instrument and the results reported here, we can safely say that P2 can be employed for measurements at temperatures even lower than the 4 °C that we tested here. On the other hand, by reducing the pressure to 710 hPa, the instrument underestimated the average diameter of the sampled particles by less than 20% compared to measurements by the SMPS. Such a deviation, however, falls within the accuracy threshold reported by the manufacturer. Further tests would be necessary to test the performance of the instrument at pressures below 710 hPa, which correspond to altitudes higher than ca. 3 km above sea level. That said, and considering that the majority of aerial observations with UASs are conducted at altitudes lower than 3 km, the P2 can be employed for effectively measuring vertical profiles of the mean concentration of size of airborne nanoparticles. This conclusion complements findings from previous tests of the Naneos P2, expanding its applicability for outdoor measurements encountered at elevated altitudes, such as those reached by UASs.
Supplemental Material
Download PDF (157.4 KB)Disclosure statement
No potential conflict of interest was reported by the author(s).
Data availability statement
10.5281/zenodo.8416676
Additional information
Funding
References
- ACTRIS. 2023. The Aerosol, Clouds and Trace Gases Research Infrastructure, https://www.actris.eu/about, accessed on 06/07/2023
- Agarwal, J. K., and G. J. Sem. 1980. Continuous flow, single particle counting condensation nucleus counter. J. Aerosol Sci. 11 (4):343–57. doi: 10.1016/0021-8502(80)90042-7.
- Asbach, C., S. Clavaguera, and A. M. Todea. 2015. Measurement methods for nanoparticles in indoor and outdoor air. In Indoor and outdoor nanoparticles. The handbook of environmental chemistry, ed. M. Viana, vol 48. Cham: Springer.
- Asbach, C., H. Kaminski, Y. Lamboy, U. Schneiderwind, M. Fierz, and A. M. Todea. 2016. Silicone sampling tubes can cause drastic artifacts in measurements with aerosol instrumentation based on unipolar diffusion charging. Aerosol Sci. Technol. 50 (12):1375–84. doi: 10.1080/02786826.2016.1241858.
- Asbach, C., V. Neumann, C. Monz, D. Dahmann, M. van Tongeren, C. Alexander, L. MacCalman, and A. M. Todea. 2017. On the effect of wearing personal nanoparticlemonitors on the comparability of personalexposure measurements. Environ. Sci. Nano. 4 (1):233–43. doi: 10.1039/C6EN00362A.
- Atkinson, R. W., I. C. Mills, H. A. Walton, and H. R. Anderson. 2015. Fine particle components and health—A systematic review and meta-analysis of epidemiological time series studies of daily mortality and hospital admissions. J. Expo. Sci. Environ. Epidemiol. 25 (2):208–14. doi: 10.1038/jes.2014.63.
- Barmpounis, K., A. Maisser, A. Schmidt-Ott, and G. Biskos. 2016. Lightweight differential mobility analyzers: Toward new and inexpensive manufacturing methods. Aerosol Sci. Technol. 50 (1):2–5. doi: 10.1080/02786826.2015.1130216.
- Baron, P. A., and K. Willeke. 2001. Aerosol Measurement: Principles, Techniques and Applications. 2nd ed., Hoboken: Willey-InterScience, Inc.
- Bezantakos, S., and G. Biskos. 2022. Temperature and pressure effects on the performance of the portable TSI 3007 condensation particle counter: Implications on ground and aerial observations. J. Aerosol Sci. 159:105877. doi: 10.1016/j.jaerosci.2021.105877.
- Bezantakos, S., F. Schmidt-Ott, and G. Biskos. 2018. Performance evaluation of the cost-effective and lightweight Alphasense optical particle counter for use onboard unmanned aerial vehicles. Aerosol Sci. Technol. 52 (4):385–92. doi: 10.1080/02786826.2017.1412394.
- Biskos, G., K. Reavell, and N. Collings. 2005. Unipolar diffusion charging of aerosol particles in the transition regime. Aerosol Sci. 36 (2):247–65. doi: 10.1016/j.jaerosci.2004.09.002.
- Boisdron, K., and J. R. Brock. 1970. On the stochastic nature of the acquisition of electrical charge and radioactivity by aerosol particles. Atmos. Environ. 4 (1):35–50. doi: 10.1016/0004-6981(70)90052-1.
- Brus, D., J. Gustafsson, V. Vakkari, O. Kemppinen, G. de Boer, and A. Hirsikko. 2021. Measurement report: Properties of aerosol and gases in the vertical profile during the LAPSE-RATE campaign. Atmos. Chem. Phys. 21 (1):517–33. doi: 10.5194/acp-21-517-2021.
- Fierz, M., H. Burtscher, P. Steigmeier, and M. Kasper. 2008. Field measurement of particle size and number concentration with the diffusion size classifier (DiSC). SAE 2008-01-1179
- Fierz, M., D. Meier, P. Steigmeier, and H. Burtscher. 2014. Aerosol measurement by induced currents. Aerosol Sci. Technol. 48 (4):350–7. doi: 10.1080/02786826.2013.875981.
- Fierz, M., D. Meier, P. Steigmeier, and H. Burtscher. 2015. Miniature nanoparticle sensors for exposure measurement and TEM sampling. J. Phys: Conf. Ser. 617:012034. doi: 10.1088/1742-6596/617/1/012034.
- Fierz, M., P. Steigmeier, C. Houle, and H. Burtscher. 2011. Design, calibration and field performance of a miniature diffusion size classifier. Aerosol Sci. Technol. 45 (1):1–10. doi: 10.1080/02786826.2010.516283.
- Fuchs, N. A. 1963. On the stationary charge distributions on aerosol particles in a bipolar ionic atmosphere. Geofisica Pura e Applicata 56 (1):185–93. doi: 10.1007/BF01993343.
- Geiss, O., I. Bianchi, and J. Barrero-Moreno. 2016. Lung-deposited surface area concentration measurements in selected occupational and non-occupational environments. J. Aerosol Sci. 96:24–37. doi: 10.1016/j.jaerosci.2016.02.007.
- Haugen, M. J., S. Gkantonas, I. El Helou, R. Pathania, E. Mastorakos, and A. M. Boies. 2022. Measurements and modelling of the three-dimensional near-field dispersion of particulate matter emitted from passenger ships in a port environment. Atmos. Environ. 290:119384. doi: 10.1016/j.atmosenv.2022.119384.
- Hermann, M., and A. Wiedensohler. 2001. Counting efficiency of condensation particle counters at low-pressures with illustrative data from the upper troposphere. J. Aerosol Sci. 32 (8):975–91. doi: 10.1016/S0021-8502(01)00037-4.
- Hinds, W. C. 1999. Aerosol technology: Properties, behavior, and measurement of airborne particles. 2nd ed., Hoboken: John Willey & Sons, Inc.
- IPCC. 2013. Climate change 2013: The Physical science basis. Contribution of working group i to the fourth assessment report of the intergovernmental panel on climate change. In IPCC: Summary for policymakers. Geneva: IPCC.
- Kezoudi, M., C. Keleshis, P. Antoniou, G. Biskos, M. Bronz, C. Constantinides, M. Desservettaz, R.-S. Gao, J. Girdwood, J. Harnetiaux, et al. 2021. The unmanned systems research laboratory (USRL): A new facility for UAV-based atmospheric observations. Atmosphere 12 (8):1042. doi: 10.3390/atmos12081042.
- Khaki, S., M. Rio, and P. Marin. 2022. Characterization of emissions in fab labs: An additive manufacturing environment issue. Sustainability 14 (5):2900. And doi: 10.3390/su14052900.
- Koehler, K. A., and T. M. Peters. 2015. New methods for personal exposure monitoring for airborne particles. Curr. Environ. Health Rep. 2 (4):399–411. doi: 10.1007/s40572-015-0070-z.
- Kumar, P., L. Morawska, C. Martani, G. Biskos, M. Neophytou, S. Di Sabatino, M. Bell, L. Norford, and R. Britter. 2015. The rise of low-cost sensing for managing air pollution in cities. Environ. Int. 75:199–205. doi: 10.1016/j.envint.2014.11.019.
- Kuuluvainen, H., M. Poikkimäki, A. Järvinen, J. Kuula, M. Irjala, M. Dal Maso, J. Keskinen, H. Timonen, J. V. Niemi, and T. Rönkkö. 2018. Vertical profiles of lung deposited surface area concentration of particulate matter measured with a drone in a street canyon. Environ. Pollut. 241:96–105. doi: 10.1016/j.envpol.2018.04.100.
- Lambey, V., and A. D. Prasad. 2021. A review on air quality measurement using an unmanned aerial vehicle. Water. Air. Soil Pollut. 232 (3):109. doi: 10.1007/s11270-020-04973-5.
- Lampert, A., B. Altstädter, K. Bärfuss, L. Bretschneider, J. Sandgaard, J. Michaelis, L. Lobitz, M. Asmussen, E. Damm, R. Käthner, et al. 2020. Unmanned aerial systems for investigating the polar atmospheric boundary layer—technical challenge sand examples of applications. Atmosphere 11 (4):416. doi: 10.3390/atmos11040416.
- Lavicoli, I., L. Fontana, P. Pingue, A. M. Todea, and C. Asbach. 2018. Assessment of occupational exposure to engineered nanomaterials in research laboratories using personal monitors. Sci. Total Environ. 627:689–702. doi: 10.1016/j.scitotenv.2018.01.260.
- Lowther, S. D., K. C. Jones, X. Wang, J. D. Whyatt, O. Wild, and D. Booker. 2019. Particulate matter measurement indoors: A review of metrics, sensors, needs, and applications. Environ. Sci. Technol. 53 (20):11644–56. doi: 10.1021/acs.est.9b03425.
- Morawska, L., A. Afshari, G. N. Bae, G. Buonanno, C. Y. H. Chao, O. Hänninen, W. Hofmann, C. Isaxon, E. R. Jayaratne, P. Pasanen, et al. 2013. Indoor aerosols: From personal exposure to risk assessment. Indoor Air. 23 (6):462–87. doi: 10.1111/ina.12044.
- Morawska, L., G. A. Ayoko, G. N. Bae, G. Buonanno, C. Y. H. Chao, S. Clifford, S. C. Fu, O. Hänninen, C. He, C. Isaxon, et al. 2017. Airborne particles in indoor environment of homes, schools, offices and aged care facilities: The main routes of exposure. Environ. Int. 108:75–83. (), doi: 10.1016/j.envint.2017.07.025.
- Naneos, G. 2024. Partector 2 aerosol dosimeter operation manual. Naneos Particle Solutions gmbh, 2022, version ZB, 1–28.
- Pappalardo, G. 2018. ACTRIS aerosol, clouds and trace gases research infrastructure. EPJ Web Conf. 176:09004. doi: 10.1051/epjconf/201817609004.
- Sá, J. P., M. C. M. Alvim-Ferraz, F. G. Martins, and S. I. V. Sousa. 2022. Application of the low-cost sensing technology for indoor air quality monitoring: A review. Environ. Tech. Innov. 28:102551. doi: 10.1016/j.eti.2022.102551.
- Salo, L., T. Rönkkö, S. Saarikoski, K. Teinilä, J. Kuula, J. Alanen, A. Arffman, H. Timonen, and J. Keskinen. 2021. Concentrations and size distributions of particle lung-deposited surface area (LDSA) in an underground mine. Aerosol Air Qual. Res. 21 (8):200660. doi: 10.4209/aaqr.200660.
- Schwartz, J., and L. M. Neas. 2000. Fine particles are more strongly associated than coarse particles with acute respiratory health effects in schoolchildren. Epidemiology 11 (1):6–10. doi: 10.1097/00001648-200001000-00004.
- Seinfeld, J. H., C. Bretherton, K. S. Carslaw, H. Coe, P. J. DeMott, E. J. Dunlea, G. Feingold, S. Ghan, A. B. Guenther, R. Kahn, et al. 2016. Improving our fundamental understanding of the role of aerosol-cloud interactions in the climate system. Proc. Natl. Acad. Sci. U S A 113 (21):5781–90. doi: 10.1073/pnas.1514043113.
- Tanzer, R., C. Malings, A. Hauryliuk, R. Subramanian, and A. A. Presto. 2019. Demonstration of a low-cost multi-pollutant network to quantify intra-urban spatial variations in air pollutant source impacts and to evaluate environmental justice. Int. J. Environ. Res. Public Health. 16 (14):2523. doi: 10.3390/ijerph16142523.
- Todea, A. M., S. Beckmann, H. Kaminski, D. Bard, S. Bau, S. Clavaguera, D. Dahmann, H. Dozol, N. Dziurowitz, K. Elihn, et al. 2017. Inter-comparison of personal monitors for nanoparticles exposure atwork places and in the environment. Sci. Total Environ. 605–606:929–45. doi: 10.1016/j.scitotenv.2017.06.041.
- Villa, T. F., F. Gonzalez, B. Miljievic, Z. D. Ristovski, and L. Morawska. 2016. An overview of small unmanned aerial vehicles for air quality measurements: Present applications and future prospectives. Sensors 16 (7):1072. doi: 10.3390/s16071072.
- Wang, K., F. Chen, W. Au, Z. Zhao, and Z. –L. Xia. 2019. Evaluating the feasibility of a personal particle exposure monitor in outdoor and indoor microenvironments in Shanghai, China. Int. J. Environ. Health Res. 29 (2):209–20. doi: 10.1080/09603123.2018.1533531.
- Wang, S. C., and R. C. Flagan. 1990. Scanning electrical mobility spectrometer. Aerosol Sci. Technol. 13 (2):230–40. doi: 10.1080/02786829008959441.
- WHO. 2000. Air quality guidelines for Europe. 2nd ed. World Health Organisation Regional Publications, European Series, No.91, accessed on line 14/01/2021: https://www.euro.who.int/__data/assets/pdf_file/0005/74732/E71922.pdf.