
 ?Mathematical formulae have been encoded as MathML and are displayed in this HTML version using MathJax in order to improve their display. Uncheck the box to turn MathJax off. This feature requires Javascript. Click on a formula to zoom.
Abstract
Dry powder inhalers (DPIs) are commonly used devices for delivering inhalable pharmaceuticals. The overall efficacy of any inhalable pharmaceutical is a function of total and regional dose, and the bioavailability of the active pharmaceutical ingredient upon deposition in the lung. Thus, a detailed understanding of the dissolution dynamics of particles from a DPI from the point of generation through to deposition in the lung may shed additional insights into the interpretation of the pharmacokinetic effects, resulting in the design of improved formulations. We present the design and benchmarking of a novel technology that directly measures the dissolution dynamics of dry aerosol particles in situ, where the relative humidity and temperature are directly comparable to the highly humid conditions within the lungs. The rate of water uptake (mass) as well as changes in the physical structure of the particle are directly measured using a combination of electrodynamics and laser light scatter. This technique offers unique insights into the dissolution dynamics of DPI starting formulations.
Editor:
Introduction
The efficacy of inhalable pharmaceuticals is dependent on total and regional dose (Cheng Citation2014), both of which depend on the initial particle/droplet diameter and the rate of hygroscopic growth during inhalation (Haddrell et al. Citation2017). Thus, in order to optimize the design of inhaled pharmaceutics, a detailed understanding of the uptake of water by the pharmaceutical aerosol during inhalation is not only key, but exploitable (Longest and Hindle Citation2012; Tian et al. Citation2011; Worth Longest and Xi Citation2008). Historically, nebulizers and metered dose inhalers (MDIs) have been the most popular delivery devices for pharmaceuticals to the lungs (Stein and Thiel Citation2017). From the point of generation through to deposition in the lungs, the aerosol produced by solution MDI formulations and nebulizers remain as liquid droplets, making their hygroscopic growth during inhalation simply the loss/addition of water to an already liquid droplet (Haddrell et al. Citation2017). Dry powder inhalers (DPIs) have become a popular method for drug delivery to the lung over the last decade (de Boer et al. Citation2017). There are many reasons for this, ranging from claims of a smaller carbon footprint than MDIs such as Ventolin Evohaler; which contain HFA134a propellant (Janson et al. Citation2020) and in some cases claims of that specific DPI devices are easier to use for select patient groups (Svedsater et al. Citation2013), through the nature of the specific active pharmaceutical agent (API) itself (Tarara et al. Citation2022).
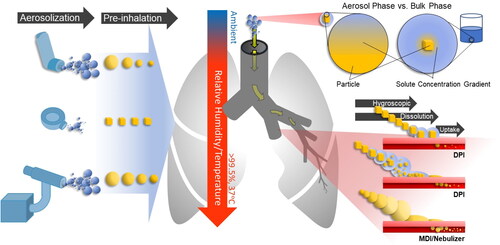
The microphysical dynamics of dry aerosol particles from a DPI and MDI (suspension formulation) are quite different to those from a nebulizer or MDI (solution formulation) (, Left). The process by which water is taken up by a solid particle involves additional processes, such as deliquescence and dissolution, prior to the potential hygroscopic growth, and all may affect where the dose is deposited in the lung. Finally, the structure of the particle itself on deposition may affect the bioavailability of the API (Akhuemokhan et al. Citation2023) (). The pharmacokinetics of a DPI’s API is dependent on two factors, the deposition profile and the rate at which the API is taken up by the lungs (). The degree to which the API has been solubilized into water prior to deposition can have a significant influence on the rate at which the API is solubilized into the body (Eedara, Bastola, and Das Citation2022). Collectively, this means that the degree to which a DPI absorbs water and is dissolved during inhalation will affect efficacy both through where the dose is delivered (, Middle), and through affecting the bioavailability of the drug post deposition in the lung (, Right).
Figure 1. Dynamic behavior of inhaled pharmaceutical aerosol from aerosolization, through inhalation and to deposition. (Left) The source of the API will dictate the phase of the droplet/particle at the point of aerosolization. (Center) Upon entering the respiratory system, the API containing aerosol will experience a dramatic change in environmental conditions, from ambient to warm and humid. (Right) The exposure of the aerosol to the humid conditions in the lungs will result in the particle/droplet taking up water. For liquid aerosol droplets (e.g., MDI/nebulizer), they will simply undergo hygroscopic growth, where the amount of water taken up will affect total and regional deposition. For dry aerosol particles (e.g., DPI), they will take up water; the amount of water that the dry particles take up may result in partial or complete dissolution prior to deposition.
The dissolution rates of particles used in DPI formulations have been traditionally measured in the bulk solution phase, where a known mass of the starting formulation is placed into a container of solvent, typically saline solution or water. The solution is mixed and the dissolved concentration of the API is measured over time (May et al. Citation2012). Although this approach can provide valuable insights into how the formulation dissolves post deposition, it does not mimic any dissolution process that may occur in an aerosol particle (, top right corner), where the sink of solubilizing vapor phase water into which the dissolved fraction is released is limited. For this reason, studies of the dissolution of DPIs in the aerosol phase at conditions that are environmentally relevant can provide insight into the first step of solubilization that dry powders encounter, leading to a more complete understanding of the DPI pharmacokinetics. In this study, we present a novel technology to study the dissolution of individually trapped aerosol particles in conditions that directly mimic the lungs (37 °C, >99.5% relative humidity (RH)). In benchmarking this technology, the dissolution kinetics of well understood particle types are measured.
Method development
Single particle electrodynamic lung (SPEL)
Measurement of the physicochemical properties of an individual particle trapped in an electrodynamic field is a well-established approach, particularly for interrogating time-dependent variations in particle size, mass and chemical composition (Davies, Haddrell, and Reid Citation2012; Fernandez et al. Citation2020; Haddrell et al. Citation2012; Valenzuela et al. Citation2021; Walker et al. Citation2021). The Single Particle Electrodynamic Lung (SPEL) described here consists of a pair of concentric cylinder electrodes to trap the droplet/particle () that are similar to those used in a comparative kinetic electrodynamic balance (CK-EDB) (Davies, Haddrell, and Reid Citation2012; Fernandez et al. Citation2020). Differences between the CK-EDB and the SPEL include the open-air design of the SPEL (), the CK-EDB is mostly sealed) and the SPEL’s ability to reach supersaturated conditions in water vapor concentration; the maximum RH achievable in the CK-EDB is ∼95%. Another unique feature of the SPEL is the capability to suspend both liquid droplets and solid particles in an air flow at a precisely predefined instant of time.
Figure 2. (a) Critical components of the SPEL to create both the electrodynamic fields and the environmental conditions that mimic the conditions an aerosol experiences during inhalation (in two consecutive instants of time). The principle of operation, presented in (a), will be described later in the text. (b) A photograph of the SPEL with a suspended particle. Inset shows a needle coated with NaCl particles. (c) Top down view of the components used to trap and probe individual droplets/particles in SPEL. (d) Sample phase functions of four difference particle types: homogeneous, core-shell, spherical containing inclusions and inhomogeneous/non-spherical.
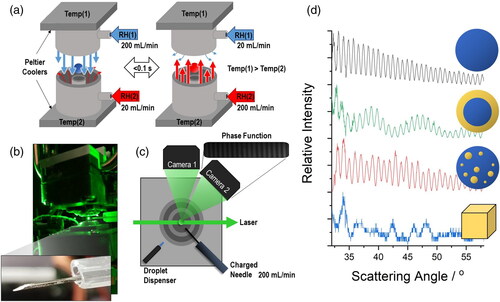
All liquid droplets probed in this study are generated with a droplet-on-demand dispenser (Microfab, MJ-ABP-01, 30 µm orifice). The tip of the droplet dispenser is positioned 1 mm from an induction electrode (+200 V DC (Direct Current)), which is then targeted to the center of the trap (). The presence of the induction electrode ensures that the individual droplets have a slight net charge (<5 fC) of a polarity that is opposite to the induction electrode when generated (Haddrell et al. Citation2012). The presence of this net charge is required for a droplet to be trapped in the electrodynamic field generated by the concentric cylinder electrodes. Since a droplet-on-demand dispenser is used to produce the droplet, and the starting composition is known (e.g., ultrapure water), the complete chemical composition of the droplet can be readily inferred. The initial radius of the droplets probed in this study were typically between 25 and 30 µm; the SPEL is capable of levitating/probing these droplets until their radius is ∼2–3 µm.
Trapping and measuring the dissolution of an individual, levitating, dry particle
In order to trap an individual dry particle with the SPEL, particles with a dry radius as low as <3 µm and as high as >15 µm can be captured. As a result, samples may need to be milled (via mortar and pestle) before the particle size is sufficiently small that a particle can be trapped; this is a fairly crude processing technique, resulting in a range of dry particle sizes. Conversely, DPI starting formulations are designed to be within the size regime, and thus are readily captured by the SPEL. Similarly, spray dried particles can also be readily captured with the SPEL.
Dry particles are injected into the SPEL through the use of a temporarily charged needle. The needle is lightly coated with a small amount of dry powder. +1.2 kV DC is then applied to the needle for ∼0.5 s. After the voltage is no longer applied, the needle is positioned near the trap and an individual particle, spontaneously ejected from the needle, is trapped in the electrodynamic fields (). The open-air design of the SPEL is necessary to allow access and injection of a particle with the needle (). The precise mechanism of the particle transfer from the needle to the trap is unclear, and was not the objective of the current work. For the sake of this study, the “dusting” of the needle needs to be subtle, the application of a high voltage DC is necessary, multiple particles can be ejected and trapped at once, the distance from the needle to the trap is variable at the point a particle transfers, and the needle should not be positioned between the electrodes. If multiple particles are trapped at once, it is impossible to measure their size, and thus all of them are ejected before the particle trapping step is repeated. There is little control over the absolute size of the dry starting particle and the absolute size of the original particle can only be estimated from the wet size once the particle has fully dissolved. However, importantly, the precise moment of aerosolization is defined as the instant that light scattering from the particle is detected.
Once the droplet or particle is trapped in the center of the trap, it is illuminated by a 532 nm laser (). The light scattered from the particle is collected by two cameras positioned at 90° and 45° to the forward scattering direction of the laser. The scattered light at 90° is used to infer the absolute height of the particle in the trap. As the particle changes mass (e.g., from the loss or uptake of water), a DC offset (−10 to +10 V) to the AC waveform is applied to the top concentric cylinder electrode to maintain the vertical position of the particle in the trap. The DC offset is recorded and is proportional to the relative mass of the particle. The out of focused light scatter collected at 45°, termed the phase function, is used to infer both the absolute radius of a droplet and the particle morphology. The use of Mie theory to convert the phase function to an estimate of the absolute radius has been used extensively (Davies, Haddrell, and Reid Citation2012). Recently, the ability to use the phase function to assign the morphology of a trapped particle has been demonstrated (Haddrell et al. Citation2019), allowing differentiation between the various structures during the dissolution of a particle. Briefly, analysis of the phase function is able to differentiate between four distinct morphologies: a homogeneous droplet, a core-shell structured droplet, a droplet with inclusions and an inhomogeneous non-spherical particle ().
Calibrating the relative humidity and temperature in the SPEL
The environment that the individual particle is suspended in is dictated by the gas flow passing over it (). The gas flow (200 mL/min) forms as a sheath flow around the particle, flowing through the outer cylindrical electrode (top or bottom), effectively isolating the droplet from the ambient environment. The relative humidity (RH) of the gas flow is set by mixing a wet and dry flow prior to introduction through the electrodes. The temperature of the gas flow (and thus the actual RH in the trap) is set by the Peltier cooler that is used to heat or cool the entire electrode. The temperature and RH of the gas flow passing over the particle are crudely estimated and controlled with a thermometer mounted to each electrode and by setting the independent flow rates of the wet and dry airflows. To achieve an accurate measurement of the temperature and relative humidity in the position of the levitated particle, a probe droplet is used. Using the evaporation profile of an evaporating saline droplet to measure the relative humidity in an electrodynamic trap has been demonstrated previously (Davies, Haddrell, and Reid Citation2012). This is possible as the exact time of droplet generation and its starting composition are known; coupled with the absolute radius of the droplet once it reaches equilibrium, the radial growth factor can then be estimated. The radial growth factor is then used to estimate the water activity/relative humidity of the gas flow from the radius of the droplet once it reaches equilibrium (). The radial growth factor is invariant with temperature and, thus, the relative humidity estimate is independent of temperature.
Figure 3. Using the evaporation dynamics of a saline droplet to measure both relative humidity and temperature in the SPEL. Model predictions of the evaporation profile of a saline droplet into gas flows of varying (a) relative humidity (at 20 °C) and (b) temperature (at a relative humidity of 80%). (c) The measured evaporation profile of the probe droplet is compared to a series of model predictions with a fixed relative humidity constant and a varied temperature. (d) Model prediction of the evaporation profile of saline compared to experimental data. The measured error in droplet radius at each time point was ±50 nm.
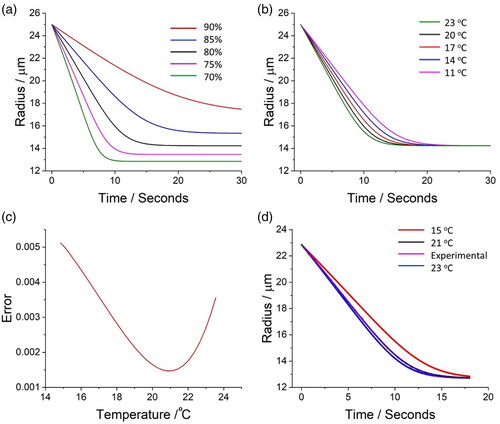
The temperature of the gas flow affects the evaporation profile (in particular, the evaporation rate) of a saline droplet (). Thus, once the RH is obtained from the equilibrium growth factor, the same evaporation profile can be then used to solve for the temperature of the gas flow through minimizing the cumulative error between a fit of the experimental and model evaporation profiles (Kulmala, Vesala, and Wagner Citation1993) (). Accurately reproducing the evaporation profile of a NaCl droplet of known starting composition allows characterization of both the RH and temperature of the flow (). The accuracies of the relative humidity and temperature measurements are < ±0.1% and < ±1.5 °C, respectively. If the RH is equal to or above 100%, the NaCl droplet never achieves equilibrium, and the RH can only be inferred from the rate or growth of a pure water droplet. Measuring the temperature and RH of the gas flow is independent of the probe droplet size; note that the initial radius of the probe droplet was limited by the DoD, where the initial radius ranged between ∼25 to ∼30 µm.
Accessing relative humidities greater than 100%
The temperature of the gas flow is controlled by changing the temperature of the electrode the gas passes through (); the temperatures of the electrode assemblies are controlled by a pair of Peltier coolers. The temperature that each electrode achieves is a function of the power applied to the Peltier cooler/heater (). As a result, a temperature gradient can be established across the region where the droplet is held between the top and bottom pairs of electrodes (). While the conditions that the levitated droplet experiences are dominated by the gas flow through either the top or bottom electrode, the temperature gradient also has an impact on the temperature in the trapping region. At room temperature (∼19 °C), when the RH of the air flow passing through the bottom electrode is set to its maximum (i.e., a fully humidified flow with no mixing of dry air), a consistent RH of 90% is achieved (as measured by saline or water droplet evaporation). The effect of increasing the temperature gradient on the evaporation profile of pure water droplets is shown in ; the temperature of the top electrode is lowered while the temperature of the bottom electrode is maintained constant. The air flow passing from the bottom electrode is slightly cooled as it travels upward through the trapping region, leading to an apparent elevation in the saturation level of the gas flow; this results in the droplet experiencing a dramatically increased RH. As the difference in the temperatures between the electrodes is increased, the RH in the central trapping region of the SPEL can reach super saturated levels (). The ability to stably produce a microenvironment where a particle can be held at an RH that is greater than 100% may have applications far beyond drug delivery to the lung, such as aerosol particle activation to form cloud droplets. Conditions simulating those in the lung (>99.5% relative humidity and ∼37 °C) are readily achievable in this system by warming the bottom electrode to 37 °C and cooling the top electrode to <15 °C.
Figure 4. (a) The temperature of the electrode in the SPEL as a function of the power applied to the Peltier cooler/heater connected to it. (b) The temperature gradient between the electrodes in the SPEL where the temperature gradient is assumed to be linear. The temperature gradient between the electrodes is assumed to be a linear gradient and the RH is a function of the initial RH (90%) and the temperature of the position in the trap. (c) Evaporation profile of a series of water droplets injected into gas flows with increasing temperature gradient. The color indicates the temperature of the top electrode while the temperature of the bottom electrode is set to 18 °C. (d) The relative humidity a levitated droplet experiences in the SPEL as a function of the temperature of the top electrode; the temperature of the bottom electrode is locked at 20 °C. Given the presence of the gas flow, the linear gradient in (b) breaks down, and a much larger temperature difference is required to reach the higher RH range. Below 100% RH, the RH is estimated using the evaporation dynamics of a NaCl solution. Above 100% RH, the RH is estimated using the growth rate of a pure water droplet.
Simulating inhalation dynamics with the SPEL
Upon inhalation, the environment rapidly (<0.1 s) changes from ambient conditions to a relative humidity >99.5% and a temperature of 37 °C, and an aerosol particle size and composition must respond to this change. By changing the relative flow rates of the two gas flows entering the SPEL through the concentric cylinder electrodes (), the environment at the null point in the trap can be rapidly changed between two set points to simulate the inhalation process ().
Figure 5. The effect that changes in relative humidity (a) and temperature (b) on the radius of an evaporating water droplet as a function of time. The temperature in (a) was set to 20 °C and the relative humidity in (b) was dry air. Red and blue lines indicate the RH and temperature that the evaporating water droplet experiences while it is evaporating.
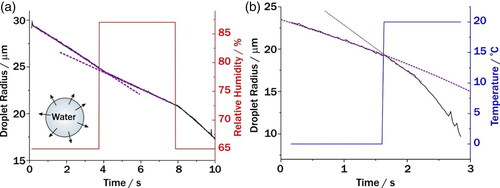
The time taken for the evaporation rate of a pure water droplet to change was used to measure the transition time for the conditions in the trap to change. For changes in both relative humidity () and temperature (), the transition time was found to be <0.1 s. Moreover, given that the conditions in the trap null point are governed by the dominate airflow (), both the temperature and relative humidity can be changed simultaneously. This rapid change in conditions can be used to directly simulate those during the inhalation of an aerosol. To simulate the RH profile a dry powder from a DPI would experience during inhalation, the rapid change in gas flows is not required. Rather, the conditions at the trapping null point in the SPEL are simply set to 37 °C and 99.5% RH, and the dry powder is injected directly into the air flow, thus somewhat replicating the RH profile experienced by a dry particle.
It should be noted that, in practice, the air flow that a DPI particle experiences from generation through to deposition in the lung is exceedingly complex. For low resistance DPIs, the airflow through the inhaler peaks at 160 Lpm which is far higher than the 200 mL/min in the SPEL. The higher airflow speeds during inhalation are accompanied by turbulence, which may play a further role in particle dissolution. In effect, the SPEL is mimicking the change in gas phase composition that a DPI particle would experience in the absence of these compounding factors. The degree to which processes such as turbulence plays a role in particle dissolution in aerosol prior to deposition needs to be explored further.
Data collection and analysis
Directly Measuring particle dissolution
The steps that lead to the dissolution of a particle in the aerosol phase at high RH are fundamentally different to a particle dissolving in a bulk liquid phase. Consider the sequence of steps involved in the dissolution of a suspended NaCl particle (). If the relative humidity is above the deliquescence point (75% for NaCl), water will begin to form “islands” on the surface of the crystal. Eventually, the “islands” will grow to the point where the entire surface of the crystal is covered. Ions from the crystal dissolve into the surrounding water layer, eventually forming a spherical droplet that still contains either a single large residual crystal or multiple crystalline inclusions. Finally, limited by gas phase diffusional transport, the residual crystal(s) fully dissolve resulting in a homogeneous saline droplet with the salt concentration and water activity set by the surrounding vapor phase RH. The overall aim of this work is to probe this complex process in a single levitated particle ().
Figure 6. (a) Schematic of the four steps/phases of the dissolution of a NaCl crystal in the aerosol phase; the colored squares indicate the structure of the particle droplet for (c) and (e). Data shown in (b) to (e) are from the same dissolving NaCl crystalline particle. (b) Changes in the phase function of a dissolving NaCl crystal in a gas flow with a relative humidity of 88% as a function of time. (c) Change in radius, particle structure and relative mass (inferred from the DC offset) as a function of time for a dissolving NaCl particle. (d) Correlation between the absolute mass of water added to the dissolving NaCl crystal and the DC offset necessary to keep the particle in the middle of the trap. The data used to generate this figure were taken from the inset square in (c). (e) The absolute mass and morphology of a dissolving NaCl crystal/droplet.
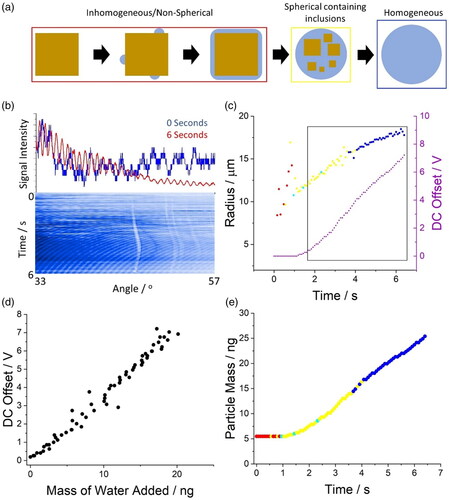
Following the trapping of a NaCl crystal, a phase function of the levitated particle is collected every 10 ms. The phase function can be used to infer the radius of the droplet over time through analyzing the angular separation between the peaks in the phase function (and applying a geometric optics approximation), and to describe the morphology of the particle over time (/Radius). If the particle is non-spherical, the radius cannot be estimated (first second of particle levitation). The blue line (/Top) is the form of the phase function when the particle is a solid crystal while the red line is the form when the droplet is full dissolved/homogeneous. When the evolving phase function over time is examined (/Bottom, 600 individual phase functions shown), a structure appears. Prior to 3 s there is no regularity in the tertiary structure (all of the phase functions combined into a single image where the y-axis is time, x-axis is angle and color is intensity), indicating that the particle morphology is non-spherical or inhomogeneous. After ∼3 s, the phase function begins to exhibit order; this is a result of the particle dissolving to a spherical droplet which then yields the characteristic regularly spaced intensity peaks described by Mie theory (/Top/6 s). As the droplet grows, the angular separation between peaks shifts; this results in a subsequent change in their angular position (a series of curves appear, /Bottom/3 to 6 s). Thus, a rudimentary scan of the tertiary structure of the cumulative phase functions indicates that the morphology of the particle changes from a dry particle to a spherical droplet over a time of ∼3 s.
The dissolution of the particle can also be probed by monitoring the DC offset required to maintain the particle at the center of the trap (/DC Offset). The DC offset is directly proportional to the absolute mass of the droplet/particle and, thus, mass changes (e.g., through the uptake of water) can be inferred. The trajectory of the particle in the SPEL is defined by the electrodynamic fields, which are described by the Matheiu equation (Aardahl et al. Citation1997). The Matheiu equation is a second order differential equation that has been used to model the motion of an ion within an ion trap, where the analytic solutions allow for the stability of an individual particle with net charge to be predicted (EquationEquations (1)(1)
(1) to Equation(4)
(4)
(4) ):
(1)
(1)
(2)
(2)
(3)
(3)
(4)
(4)
az, az, qr and qz are dimensionless parameters, U is the DC voltage offset applied to an AC electrode (top concentric cylinder shown in ), VAC is the amplitude of the AC waveform applied to the cylinder electrode, ꞷ, is equal to 2πf where f is the frequency applied to the cylinder electrode. ro is half the distance between the electrodes and mi is the mass of the ion (assuming the net charge on the ion is constant). βr and βz are stability parameters; for an ion to be trapped, both parameters must be between 0 and 1. Thus, when a trapped particle with net charge changes mass, either through evaporation or water uptake, the AC fields must be adjusted to maintain both constant a and q values.
The relative change in particle mass can be calibrated to an absolute change in mass through correlating the relationship between the change in DC offset with the changes in absolute mass of the droplet inferred from the change in radius and the compositional dependence of particle density (). This is possible only when these two parameters (DC offset and mass) are independently measured (square in ). When the particle is non-spherical over the first second, the correlation cannot be made. Once calibrated, the DC offset can be used to measure the absolute mass change of the dissolving particle as a function of time (). Furthermore, the phase function can be used to describe the morphology of the dissolving particle. Collectively, this information yields a detailed description of the dissolution process previously unattainable in the aerosol phase.
Characterizing the limitations of absolute mass measurements in the SPEL
Consider a dissolving particle; as water condenses, the particle mass increases. In order to keep the droplet stable in the center of the trap, the DC offset (U) is adjusted such that the vertical location of the particle (as measured with a camera) is maintained in a single position. Since the DC offset is directly proportional to the mass of the trapped droplet (EquationEquation (1)(1)
(1) ), the relative mass of the droplet/particle can be inferred from the relative change in the DC offset needed to maintain the droplet in the center of the trap. There are, however, limitations to using the DC offset to measure changes in the particle mass. Consider an evaporating solution droplet with a starting radius of 25 µm and an equilibrium size of 5 µm. During evaporation, it will change in mass by over 2 orders of magnitude. Such a large change in mass over a timescale of seconds cannot be effectively compensated by changes to the DC offset. For cases such, the AC frequency of the trap must be altered to ensure trapping stability during such large mass change (EquationEquations (1)
(1)
(1) and Equation(2)
(2)
(2) ). Given the potential for both the DC offset and AC frequency to affect droplet stability, the interplay between these two parameters on the ability to measure relative particle mass is systematically probed ().
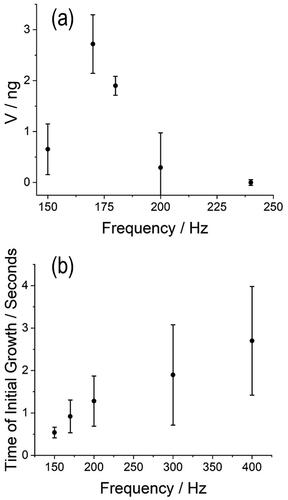
Figure 7. Exploring the limitations of the SPEL to measure absolute mass changes in a dissolving sucrose particle at 89% RH. (a) The correlation between the total offset to maintain a sucrose particle at the center of the trap with the absolute mass change of the particle (as described in ) as a function of the AC frequency applied to the electrodes of the SPEL. (b) The time for initial growth when the SPEL can detect a mass change of the particle as a function of the AC frequency applied to the electrodes. Each data point represents between 6 to 10 individual particle levitations, and the error bars indicate the standard deviation.
As described by EquationEquation (1)(1)
(1) , the strength/stiffness of the AC trap is a function of the frequency applied across the electrodes in the SPEL (). At AC frequencies greater than 200 Hz, the DC offset shifts only slightly during dissolution and the absence of a DC shift means that an assessment of the absolute change in mass (such as those described in ) is not possible. In order to be the most sensitive to changes in the absolute mass change of a particle during dissolution, the AC frequency of the SPEL should be held between 180 and 170 Hz.
The variation (i.e., size of the error bar) observed in can be attributed to particle parameters, including initial particle size and shape. The variability between particles means that the correlation described in is unique to each particle and that the sensitivity in the DC offset to mass changes, maintaining the position of the particle in the center of the trap, is relative. Thus, the correlation between DC offset and absolute particle mass must calibrated for each individual particle to infer a detailed picture of the dissolution dynamics (such as those reported in ).
Dissolution of crystalline NaCl particles injected directly into the SPEL
The hygroscopic properties of crystalline and solution phase NaCl particles are well understood. As such, it is a simple system that serves as an excellent model to explore the capabilities of the SPEL to measure dissolution dynamics. NaCl crystals were crushed into a fine powder with a mortar and pestle, injected into the trap dry and their dissolution kinetics were examined ().
Figure 8. Exploring the dissolution kinetics of crystalline NaCl in the SPEL. (a) Change in the DC offset of the SPEL as a function of time to account for the water uptake by a crystalline NaCl particle in various relative humidities. For each relative humidity, data for two individual particles are given. (b) Correlation between the measured radius of a dissolving crystalline NaCl particle at equilibrium versus the estimated radius at equilibrium predicted from the radius of the droplet when fully dissolved (e.g., homogeneous). Line indicates a 1:1 correlation. (c) The change in mass and structure of 3 individually trapped NaCl crystalline particles dissolving in a gas flow with a relative humidity of 88% as a function of time. Dashed lines indicate time in which the particles have fully dissolved. (d) Time taken for crystalline NaCl particles to dissolve as a function of initial dry particle mass. Error bars indicate standard deviation of binned data sets.
Although the absolute change in mass cannot be reported without simultaneously recording the radius change, the relative change in the DC offset can be used to qualitatively describe the approximate change in mass of a particle as a function of time (). The relative change in the DC offset positively correlates with the relative humidity of the gas flow the particle experiences; the degree of DC offset change corresponds to the relative change in mass for each particle, where the particle mass change is higher at a higher relative humidity. The deliquescence point is defined as the relative humidity at which a dry particle spontaneously takes up significant quantities of water, dissolving to form a saturated solution; it has been reported that crystalline NaCl particles can reversibly take up trace amounts of water below the deliquescence point (Wise et al. Citation2008). Indeed, the apparent condensation of water on a crystalline particle below the deliquescence point is observed in the aerosol phase in this work (, RH 73%). However, the absolute amount of water condensing on the particle is unclear as significant dissolution must be observed to calibrate the DC offset to an absolute mass change from the radius measurement (e.g., , where droplet density was estimated using the E-AIM model (Wexler and Clegg Citation2002)).
Since the relationship between the radial growth factor (wet radius of a droplet at a given RH/dry radius) of an NaCl droplet and relative humidity is well understood, the utility/accuracy of the phase function analysis can be assessed (). The measured radius of the dissolved droplet upon reaching equilibrium directly correlates with predicted radius at equilibrium based solely on the measured radius of the droplet at the first point of being homogeneous (where the water activity is presumed to be 0.75 ()). The 1:1 linear relationship between the expected and observed radius indicates:
That the phase analysis accurately reports when the droplet is truly homogeneous,
The dry mass of the particle can be inferred from either the radius once the droplet is homogeneous or at equilibrium,
The dynamic behavior of the fully dissolved particle can be readily estimated, and
The point at which the phase function analysis reports that the particle is homogeneous is an effective end point of the dissolution process as at that point the crystalline solute is indeed fully dissolved.
With the definitive endpoint of dissolution clearly defined ( (checkered lines) and b), the dependence of the time taken for a particle to fully dissolve on the initial mass of a crystalline NaCl particle is investigated (). A linear relationship between the starting dry mass of the crystalline NaCl particle and the time taken to fully dissolve is observed; the complete dissolution time of crystalline NaCl in a gas flow of a known relative humidity is found to be consistent. Particles of an inhalable size (<5 µm radius) are seen to fully dissolve over the course of a single inhalation period (<10 s). The time to fully dissolve is RH independent across the RH range studied (84% to 90%).
Dissolution of crystalline organic particles injected directly into the SPEL
Sucrose can be a proxy for excipients for dry powder inhalers (Shetty et al. Citation2018), while long chain alcohols are common surfactants in both the atmosphere and in industrial aerosol. The dissolution kinetics of crystalline forms of the organic molecules sucrose and pentadecanol particles have been studied ().
Figure 9. Exploring the dissolution kinetics of proxies for secondary organic aerosol in the SPEL across a range of RH (temperature set to 20 C). (a) Time taken for crystalline sucrose particles to reach a homogeneous state as a function of initial dry particle mass. Error bars indicate standard deviation of binned data sets. (b) The change in mass of two sucrose crystal particles dissolving in a gas flow with a relative humidity of 88% as a function of time. Change in the DC offset of the SPEL as a function of time to account for the water uptake by a (c) crystalline sucrose and (d) pentadecanol particle in various relative humidities.
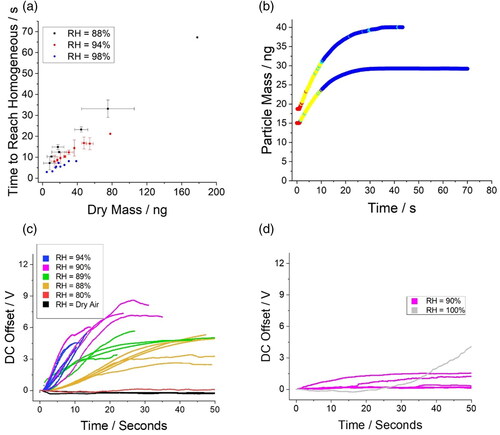
Much like the complete dissolution of NaCl (), a linear relationship between the dissolution time for crystalline sucrose particles and the starting dry mass is observed (). This linear relationship extends across a broad range in particle mass (>150 ng). Complete dissolution of crystalline sucrose particles under 40 ng would be expected to occur for inhalable particles during a single inhalation. Unlike NaCl, the time taken for sucrose particles to fully dissolve is RH dependent within the RH range studied (88–98%). This is likely due to closeness of the lower RH studied to the deliquescence point of sucrose (∼84% (Yao et al. Citation2011)).
The absolute change in mass and morphology of two dissolving crystalline sucrose particles is reported in with many of the same features observed for crystalline NaCl particles. These include a delay between 0.5 and 1 s before a detectable mass of water is added, a prolonged region wherein the droplet contains inclusions (as inferred from the synchronous light scattering measurement), and subsequent complete dissolution into a homogeneous droplet. Notably, given that the relative change in mass of the sucrose crystal is much smaller than that of a NaCl crystal (radial growth factors at each deliquescence point are 1.165 and 1.896, respectively (Wexler and Clegg Citation2002)), the dissolution of sucrose is much easier to measure. Given the high hygroscopicity of NaCl, it is one of the more challenging systems to probe as large changes in mass require large changes in DC offset.
As shown in for NaCl particles, the relative mass change of the dissolving sucrose particle can be quantified through analysis of the DC offset required to maintain the particle at the center of the trap (). Much like the dissolving NaCl crystalline particles, the rate of change in the DC offset was found to correlate to the relative humidity of the gas flow. Again, like crystalline NaCl particles, water uptake by the crystalline sucrose particle is observed below the deliquescence point (∼84%). The variation in the curves at a given relative humidity are indicative of both the variations in initial particle mass and overall sensitivity of the trap to measure mass. The dynamics of the dissolution process near the deliquescence point appears to be highly dependent on the proximity of the relative humidity of the gas flow to the deliquescence point. This relationship is interesting and worthy of further exploration.
To explore the capability of the SPEL to trap and probe highly insoluble species, pentadecanol (a highly insoluble surfactant) was studied. The water condensation onto pentadecanol in relative humidities near and above saturation (100% RH) is measured (). Much like NaCl and sucrose particles below deliquescence, both water uptake coupled with no sign of dissolution (through laser light scatter) are observed over the 50 s time period. When the RH is raised to 100%, dissolution is still not observed over the time period, although significant water uptake is observed.
Discussion
The ability to trap individual solid particles in a gas flow of very high RH and directly probe their dissolution has been demonstrated. This is the first technique of its kind wherein the rapid dissolution kinetics of solid particles can be monitored directly in the gas phase. Moreover, details of changes in the structure of the particle whilst it is dissolving can be observed. The ability to readily create a supersaturated environment where the RH can be maintained above 100% is unique to this technique. Having access to these conditions affords the opportunity to explore aerosol dynamics within conditions such as these could be very useful in the study of cloud condensation (Yu et al. Citation2020). Given the unique set of capabilities of this technique (ultra-high RH, rapid change in conditions, study any particle type, etc.), it can be used in a broad range of studies beyond the dissolution of pharmaceutical aerosols.
The rate of dissolution appears to be dependent on the difference between the RH the droplet experiences and the deliquescence point of the solute (). Many of the APIs and their carriers having a very high deliquescence point when compared to sucrose and NaCl; thus, at a glance, it would appear that there is a low the likelihood of any DPI dissolving during inhalation. However, it is important to understand that all of the systems characterized in this study were crystalline, meaning that in order for dissolution to occur the crystal structure would need to be fragmented. Most DPIs are not crystalline, but rather are engineered (Chow et al. Citation2007; Gradon and Sosnowski Citation2014) via techniques such as spray drying (Nandiyanto and Okuyama Citation2011) resulting in a dry amorphous glassy powder instead (Lechanteur and Evrard Citation2020). The consequence of this is that engineered DPI aerosol would be expected to have different dissolution dynamics than the crystals studied here (Kaialy and Nokhodchi Citation2015). Moreover, the impact of different spray drying techniques on the subsequent particle dissolution can be explored. In addition, water uptake prior to dissolution is detectable.
The dissolution measurements made using the SPEL, when compared to standard dissolution techniques such as the standard “paddle over disc” (PoD) (Nokhodchi, Chavan, and Ghafourian Citation2023), offer some unique insights. For example, the SPEL directly measures the dissolution in the aerosol phase whereas the PoD measures dissolution in solution. Note that this is not to say that one technique is better than the other, rather that the two are simply measuring different stages of moisture interaction with inhaled particles (i.e., during gas phase transport and then following deposition). The same can be said when comparing the SPEL and PoD to other dissolution quantification techniques such as RespiCell (dissolution on a membrane (Sonvico et al. Citation2021)) and DissolvIT (dissolution into a mucus simulant (Gerde et al. Citation2017)). Combining the results of the SPEL with these other techniques could offer insights into the microphysical transformation of inhaled pharmaceuticals from generation through inhalation and eventually to deposition. A key difference in their approaches is that the PoD measures the collective dissolution across a population of particles whereas the SPEL probes particle stability at high RH and dissolution one particle at a time. Consider the following analogy: the average color of a bowl full of rainbow jellybeans is brown, where none of the individual jellybeans are actually brown. Both, the average color of the population does not accurately describe the individual, nor does the color of the individual describe the whole. Analogously, the SPEL and the PoD may also be measuring different dissolution rates. Through measuring the moisture sensitivity and dissolution of individual particles, the SPEL may be able to identify a proportion of the whole population that demonstrate a different dissolution profile. These insights may be useful in optimizing DPI formulations and resilience to moisture.
Conclusions
A novel instrument to measure the complex dissolution dynamics of an individual particle suspended in an airflow (whose relative humidity can exceed 100%) has been demonstrated. The instrument is able to measure particle dissolution on the timescales relevant to an inhalation event. When coupled with other bulk phase dissolution techniques, a more complete picture of particle dissolution during inhalation can be made.
Disclosure statement
No potential conflict of interest was reported by the author(s).
Additional information
Funding
References
- Aardahl, C. L., R. Vehring, E. J. Davis, G. Schweiger, and B. D. Swanson. 1997. Trapping two-particle arrays in a double-ring electrodynamic balance. J. Aerosol Sci. 28 (8):1491–505. doi: 10.1016/S0021-8502(97)00012-8.
- Akhuemokhan, P., N. A. Green, A. Haddrell, D. Lewis, J. P. Reid, and B. Forbes. 2023. How to engineer aerosol particle properties and biopharmaceutical performance of propellant inhalers. Int. J. Pharm. 634:122676. doi: 10.1016/j.ijpharm.2023.122676.
- Cheng, Y. S. 2014. Mechanisms of pharmaceutical aerosol deposition in the respiratory tract. AAPS PharmSciTech 15 (3):630–40. doi: 10.1208/s12249-014-0092-0.
- Chow, A. H., H. H. Tong, P. Chattopadhyay, and B. Y. Shekunov. 2007. Particle engineering for pulmonary drug delivery. Pharm. Res. 24 (3):411–37. doi: 10.1007/s11095-006-9174-3.
- Davies, J. F., A. E. Haddrell, and J. P. Reid. 2012. Time-resolved measurements of the evaporation of volatile components from single aerosol droplets. Aerosol Sci Tech 46 (6):666–77. doi: 10.1080/02786826.2011.652750.
- de Boer, A. H., P. Hagedoorn, M. Hoppentocht, F. Buttini, F. Grasmeijer, and H. W. Frijlink. 2017. Dry powder inhalation: Past, present and future. Expert Opin. Drug Deliv. 14 (4):499–512. doi: 10.1080/17425247.2016.1224846.
- Eedara, B. B., R. Bastola, and S. C. Das. 2022. Dissolution and absorption of inhaled drug particles in the lungs. Pharmaceutics 14 (12):2667. doi: 10.3390/pharmaceutics14122667.
- Fernandez, M. O., R. J. Thomas, H. Oswin, A. E. Haddrell, and J. P. Reid. 2020. Transformative approach to investigate the microphysical factors influencing airborne transmission of pathogens. Appl Environ Microb 86:e01543-20. doi: 10.1128/AEM.01543-20.
- Gerde, P., M. Malmlöf, L. Havsborn, C. O. Sjöberg, P. Ewing, S. Eirefelt, and K. Ekelund. 2017. Dissolvit: An in vitro method for simulating the dissolution and absorption of inhaled dry powder drugs in the lungs. Assay Drug Dev. Technol. 15 (2):77–88. doi: 10.1089/adt.2017.779.
- Gradon, L., and T. R. Sosnowski. 2014. Formation of particles for dry powder inhalers. Adv. Powder Technol. 25 (1):43–55. doi: 10.1016/j.apt.2013.09.012.
- Haddrell, A., G. Rovelli, D. Lewis, T. Church, and J. Reid. 2019. Identifying time-dependent changes in the morphology of an individual aerosol particle from its light scattering pattern. Aerosol Sci Tech 53 (11):1334–51. doi: 10.1080/02786826.2019.1661351.
- Haddrell, A. E., J. F. Davies, A. Yabushita, and J. P. Reid. 2012. Accounting for changes in particle charge, dry mass and composition occurring during studies of single levitated particles. J. Phys. Chem. A 116 (40):9941–53. doi: 10.1021/jp304920x.
- Haddrell, A. E., D. Lewis, T. Church, R. Vehring, D. Murnane, and J. P. Reid. 2017. Pulmonary aerosol delivery and the importance of growth dynamics. Ther. Deliv. 8 (12):1051–61. doi: 10.4155/tde-2017-0093.
- Janson, C., R. Henderson, M. Löfdahl, M. Hedberg, R. Sharma, and A. J. K. Wilkinson. 2020. Carbon footprint impact of the choice of inhalers for asthma and COPD. Thorax 75 (1):82–4. doi: 10.1136/thoraxjnl-2019-213744.
- Kaialy, W., and A. Nokhodchi. 2015. Particle engineering for improved pulmonary drug delivery through dry powder inhalers. In Pulmonary drug delivery, 171–98. West Sussex: John Wiley & Sons, Ltd.
- Kulmala, M., T. Vesala, and P. E. Wagner. 1993. An analytical expression for the rate of binary condensational particle growth. Proceedings of the Royal Society of London. Series A: Mathematical and Physical Sciences 441:589–605. doi: 10.1098/rspa.1993.0081.
- Lechanteur, A., and B. Evrard. 2020. Influence of composition and spray-drying process parameters on carrier-free dpi properties and behaviors in the lung: A review. Pharmaceutics 12 (1):55. doi: 10.3390/pharmaceutics12010055.
- Longest, P. W., and M. Hindle. 2012. Condensational growth of combination drug-excipient submicrometer particles for targeted high efficiency pulmonary delivery: Comparison of cfd predictions with experimental results. Pharm. Res. 29 (3):707–21. doi: 10.1007/s11095-011-0596-1.
- May, S., B. Jensen, M. Wolkenhauer, M. Schneider, and C. M. Lehr. 2012. Dissolution techniques for in vitro testing of dry powders for inhalation. Pharm. Res. 29 (8):2157–66. doi: 10.1007/s11095-012-0744-2.
- Nandiyanto, A. B. D., and K. Okuyama. 2011. Progress in developing spray-drying methods for the production of controlled morphology particles: From the nanometer to submicrometer size ranges. Adv. Powder Technol. 22 (1):1–19. doi: 10.1016/j.apt.2010.09.011.
- Nokhodchi, A., S. Chavan, and T. Ghafourian. 2023. In vitro dissolution and permeability testing of inhalation products: Challenges and advances. Pharmaceutics 15 (3):983. doi: 10.3390/pharmaceutics15030983.
- Shetty, N., H. Park, D. Zemlyanov, S. Mangal, S. Bhujbal, and Q. T. Zhou. 2018. Influence of excipients on physical and aerosolization stability of spray dried high-dose powder formulations for inhalation. Int. J. Pharm. 544 (1):222–34. doi: 10.1016/j.ijpharm.2018.04.034.
- Sonvico, F., V. Chierici, G. Varacca, E. Quarta, D. D'Angelo, B. Forbes, and F. Buttini. 2021. Respicell(tm): An innovative dissolution apparatus for inhaled products. Pharmaceutics 13 (10):1541. doi: 10.3390/pharmaceutics13101541.
- Stein, S. W., and C. G. Thiel. 2017. The history of therapeutic aerosols: A chronological review. J. Aerosol Med. Pulm. Drug Deliv. 30 (1):20–41. doi: 10.1089/jamp.2016.1297.
- Svedsater, H., P. Dale, K. Garrill, R. Walker, and M. W. Woepse. 2013. Qualitative assessment of attributes and ease of use of the ellipta™ dry powder inhaler for delivery of maintenance therapy for asthma and copd. BMC Pulm. Med. 13 (1):72. doi: 10.1186/1471-2466-13-72.
- Tarara, T. E., D. P. Miller, A. E. Weers, A. Muliadi, J. Tso, A. Eliahu, and J. G. Weers. 2022. Formulation of dry powders for inhalation comprising high doses of a poorly soluble hydrophobic drug. Front. Drug Deliv. 2:862336. doi: 10.3389/fddev.2022.862336.
- Tian, G., P. W. Longest, G. Su, and M. Hindle. 2011. Characterization of respiratory drug delivery with enhanced condensational growth using an individual path model of the entire tracheobronchial airways. Ann. Biomed. Eng. 39 (3):1136–53. doi: 10.1007/s10439-010-0223-z.
- Valenzuela, A., F. Chu, A. E. Haddrell, M. I. Cotterell, J. S. Walker, A. J. Orr-Ewing, and J. P. Reid. 2021. Optical interrogation of single levitated droplets in a linear quadrupole trap by cavity ring-down spectroscopy. J. Phys. Chem. A 125 (1):394–405. doi: 10.1021/acs.jpca.0c09213.
- Walker, J. S., J. Archer, F. K. A. Gregson, S. E. S. Michel, B. R. Bzdek, and J. P. Reid. 2021. Accurate representations of the microphysical processes occurring during the transport of exhaled aerosols and droplets (vol 7, pg 200, 2021). ACS Cent. Sci. 7 (3):507– doi: 10.1021/acscentsci.1c00220.
- Wexler, A. S., and S. L. Clegg. 2002. Atmospheric aerosol models for systems including the ions H+, NH4+, NA+, SO42−, NO3−, CL−, BR−, and H2O. J. Geophys. Res. 107 (D14):ACH 14-11–14-14. doi: 10.1029/2001JD000451.
- Wise, M. E., S. T. Martin, L. M. Russell, and P. R. Buseck. 2008. Water uptake by nacl particles prior to deliquescence and the phase rule. Aerosol Sci. Tech. 42 (4):281–94. doi: 10.1080/02786820802047115.
- Worth Longest, P., and J. Xi. 2008. Condensational growth may contribute to the enhanced deposition of cigarette smoke particles in the upper respiratory tract. Aerosol Sci. Tech. 42 (8):579–602. doi: 10.1080/02786820802232964.
- Yao, W., X. Yu, J. W. Lee, X. Yuan, and S. J. Schmidt. 2011. Measuring the deliquescence point of crystalline sucrose as a function of temperature using a new automatic isotherm generator. Int. J. Food Prop. 14 (4):882–93. doi: 10.1080/10942910903474393.
- Yu, C., D. Pasternak, J. Lee, M. Yang, T. Bell, K. Bower, H. Wu, D. Liu, C. Reed, S. Bauguitte, et al. 2020. Characterizing the particle composition and cloud condensation nuclei from shipping emission in western europe. Environ. Sci. Technol. 54 (24):15604–12. doi: 10.1021/acs.est.0c04039.