
 ?Mathematical formulae have been encoded as MathML and are displayed in this HTML version using MathJax in order to improve their display. Uncheck the box to turn MathJax off. This feature requires Javascript. Click on a formula to zoom.
Abstract
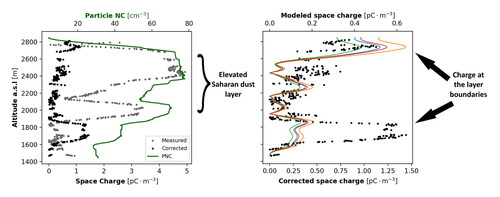
Mineral dust from the Sahara desert can travel long distances at high altitudes, perturbing the energy budget of the atmosphere. Charging of dust has been observed to occur near the surface through triboelectric charging during dust lofting, potentially affecting particle coagulation, fall speeds, and the lofting process itself. Apart from near-surface studies, measurements at elevated dust layers, where charge may play a role in particle long-range transport, are rare. This study presents new observations from an uncrewed aircraft system (UAS) of type MASC-3, through an elevated Saharan dust layer over Cyprus on 6 April 2022. The dust layer ranged from 1500 to 2500 meters above sea level (a.s.l), with maximum particle number concentrations (PNC) of 80–100 primarily consisting of particles up to 2.5 µm in size. Measurements showed elevated charge within the dust layer, with magnitude proportional to PNC. It was concluded that there was a small influence of aircraft charge on the measurements, which was handled by developing a PNC-based correction factor. Corrected charge within the dust layer ranged from 0.2 to 3
with most of the charge at the upper and lower dust layer boundaries. The magnitude and location of the charge was consistent with predictions of ion-particle attachment. This suggests that most of the measured charge did not originate from the lofting process, but dust particles were charged on site through ion-particle attachment processes.
Graphical Abstract
EDITOR:
1. Introduction
A major source of mineral dust is North Africa, and specifically the Sahara desert (Stuut, Smalley, and O’Hara-Dhand Citation2009). Its predominant channel of transport across all seasons of the year is the Mediterranean sea (Israelevich et al. Citation2012), but it occasionally follows a curved path around the east side of the Atlantic. The amount of dust transported north from the Sahara is in the order of magnitude of hundreds of thousands of tons (Varga, Újvári, and Kovács Citation2014), with a wide array of environmental effects (Goudie and Middleton Citation2001). For instance, its interaction with incoming radiation through absorption and scattering can disturb the atmospheric energy budget and influence the total heating or cooling of the atmosphere (Carlson and Benjamin Citation1980). This radiative effect of dust loading has been extensively studied as it frequently affects the whole of the Mediterranean basin, and especially central and eastern parts (Soupiona et al. Citation2020).
Electrification of dust particles is known to result from the process of triboelectrification (Kamra Citation1972), whereby particles collide with each other, exchanging charge. Triboelectrification of dust occurs readily during dust lofting, including dust storms (Rudge Citation1913) and dust devils ((Franzese et al. Citation2018). The separation of positive and negative charge gives rise to large electric fields (E-fields) in the order of (Williams et al. Citation2009; Katz et al. Citation2018). This can affect processes such as lofting of particles from the ground (Esposito et al. Citation2016), as well as the propagation of electromagnetic waves during dust storms (Zhou, Shu He, and Jing Zheng Citation2005). Dust electrification studies have typically been conducted from the surface using electric field mills in dense dust storm events (Yair et al. Citation2016; Zhang, Bo, and Zheng Citation2017; Katz et al. Citation2018). Such ground based instrumentation has also been used to characterize charging in advected elevated layers of Saharan dust transported over long distances (Silva et al. Citation2016; Harrison et al. Citation2018; Daskalopoulou et al. Citation2021).
In comparison to surface observations, measurements of the electrical properties of dust above the surface are few. Gringel and Muhleisen (Citation1978) measured a conductivity decrease by a factor of two, associated within a Saharan dust layer from a balloon platform, whilst Nicoll, Harrison, and Ulanowski (Citation2010) used a balloon borne space charge sensor and aerosol number concentration counter to detect weakly charged Saharan dust over the Cape Verde Isles. A similar space charge sensor has more recently been flown by Mallios et al. (Citation2023) through dust events, alongside a miniature electric field mill, also from a balloon platform. Another study with a miniaturized optical sensor on a balloon platform during a Saharan dust event in Minorca island (Spain) during the summer of 2013, also obliquely indicated dust particle charge due to the sensitivity of the employed instrument to electromagnetic field alterations (Renard et al. Citation2018).
Although there have been abundant measurements of dust particle concentrations and sizes from crewed aircraft and uncrewed aircraft systems (UASs) (Haywood et al. Citation2001; Tanré et al. Citation2003; Johnson and Osborne Citation2011; Granados-Muñoz et al. Citation2016; Schrod et al. Citation2017; Mamali et al. Citation2018; Ryder et al. Citation2019), dust particle charge measurements from aircraft are exceptionally rare in literature. This is likely due to the triboelectric charging effect of the dust on the body of aircraft, which generates large E-fields and overwhelms the measurement of dust particle charge (Lekas Citation2019). Previous laboratory research has been performed on the charge acquired by aircraft due to dust (Perala Citation2009), finding values of 5–10 µ of charging rate per effective area, at speeds of 180
(640 km per hour, typical cruising speed for a large jet aircraft). A dependence of charge on the speed of the aircraft, area of the aircraft body impacted by dust, and the dust particle concentration was found.
For the study presented here, we employed a UAS with a wing span of 4 m, i.e., an order of magnitude smaller than a typical crewed aircraft (e.g., a BAE-146), flying at a cruising speed approximately 6–10 times slower than crewed aircraft and with significantly less weight. Therefore, although some charging of the aircraft body is expected whilst flying through dust, it is likely to be many orders of magnitude less than on a crewed aircraft. The effect of aircraft charge on the measurements is discussed and accounted for in Section 3.3.
Although dust electrification has been known about since the measurements of Rudge (Citation1913) there has been a drive in recent decades to understand the mechanisms of dust electrification and to better quantify the variability of the charge carried by dust particles, e.g., in Zhang and Zhou (Citation2020). This is partly in response to potential impacts of dust electrification on a number of atmospheric processes important for climate. These include vertical alignment (polarization) of dust particles in high altitude dust layers in the atmospheric E-field (Ulanowski et al. Citation2007), known as the “Venetian blind effect,” which may alter the cross-sectional area covered by particles and decreases optical depth, something that is not currently accounted for in remote-sensing retrievals of aerosols or sun photometers (Ulanowski et al. Citation2008). It has also been hypothesized that in elevated dust layers, the atmospheric E-field may also act as a counterbalance to the gravitational force for aerosol particles in the coarser modes, thus allowing large aerosol particles to stay aloft and be transported over longer distances. Dust transport models often underestimate the transport range of coarse particles (Ginoux et al. Citation2001; Maring et al. Citation2003; Van Der Does et al. Citation2018), and the existence of coarse/giant mode particles transported over distances longer than what predicted by conventional theory, has been reported in studies using measurements from balloons (Renard et al. Citation2018) as well as crewed aircraft (Ryder et al. Citation2013; Marenco et al. Citation2018; Adebiyi and Kok Citation2020; O'Sullivan et al. Citation2020). The lack of particle charge and E-field observations in elevated dust layers has so far been a barrier to progress in this area, and it is therefore important to acquire more direct measurements through Saharan dust layers. Capturing vertically extended space charge and aerosol concentrations, could contribute to better understanding the aforementioned effects and how to incorporate them in currently used models.
This work aims to address these objectives by presenting new, simultaneous aerosol concentration and charge measurements from a fixed wing UAS, specifically the Multipurpose Airborne Sensor Carrier (MASC-3) (Mauz et al. Citation2019; Rautenberg et al. Citation2019), during a Saharan dust event that occurred over Cyprus in April, 2022. This has been the first attempt of using a UAS equipped with a scientific payload for both space charge and aerosol particles, as well as meteorological (wind vector, temperature, humidity) and turbulent quantities like the turbulent kinetic energy (TKE), to perform vertical profiles within a Saharan dust layer and investigate their relationship. Details of the aircraft and instrumentation are discussed in Section 2. Section 3.1 discusses the transport of the dust, based on a 48-h back trajectory simulation prior to the day of measurements, spectral images from satellites and remote-sensing instrumentation at the vicinity of the aircraft flights. Measurements of meteorological, aerosol and charge vertical profiles through the dust layer are shown in Section 3.2 and a method to account for charge acquired on the aircraft body discussed in Section 3.3, along with vertical profiles of corrected charge. A description of the theoretical model to estimate the expected dust charge at the given conditions, is explained in Section 3.4. The discussion and conclusions then follow in Sections 4 and 5.
2. Materials and methods
2.1. UAS instrumentation
A fixed-wing, uncrewed aircraft of type MASC-3 (Mauz et al. Citation2019; Rautenberg et al. Citation2019), was employed for the flights described in our study. The UAS has a maximum take-off weight of 8 kg, endurance of 1.5 h, and a wingspan of 4 m. During flight missions, a speed of about 18.5 is kept constant by the autopilot system (PixHawk 2.1 Cube Orange). A 1.5 kg sensor system at the nose of the aircraft provides high resolution data of meteorological and turbulent variables (air temperature, humidity, 3-D wind vector, TKE), which are stored onboard the platform at a frequency of 100 Hz. The autopilot also allows for accurate, pre-planned, automatic flight missions. The aircraft’s location, attitude parameters and meteorological measurements are transmitted with 1 Hz frequency in real time to portable computers on ground stations during each flight. Full specifications of the MASC-3 with its standard payload are described in detail in Rautenberg et al. (Citation2019). Furthermore, computation of TKE using the MASC-3, is explained in Platis et al. (Citation2016); Zum Berge et al. (Citation2021); Schön et al. (Citation2022).
For aerosol particle measurements, the UAS has an aerodynamically shaped pod installed on one wing (referred to as OPC-Pod), which is based on the commercially available optical particle counter (OPC) of type N3 (Alphasense, United Kingdom). The N3 is a lightweight instrument ( 105 g) that covers an aerosol size range from 0.35 to 40 µm in diameter, distributed among 24 discrete channels based on scattering from a 658 nm laser beam, with scattering angles of 32 − 88
and operating at a sampling frequency of 1 Hz. For the OPC-N3, particle spherical shape with a complex refractive index of
and density of 1.65
are internally assumed. The sensor has been modified to accommodate measurements at the cruising speed of the aircraft, specifically by removing its parent fan and designing the OPC-Pod so that it maintains passive aspiration, caused by pressure differences at its inlet and an exhaust point at its top (Mashni et al. Citation2023). A validation study including detailed description of the OPC-Pod’s operation and components, showed the sensor’s reliability for operation on the MASC-3 after comparison with a reference station on the ground, airflow experiments in a wind tunnel and experimental flights during and after the Saharan dust layer in Cyprus (Schön et al. Citation2024). Data from the MASC-3 were further compared with additional flights of the UCASS system (Smith et al. Citation2019; Kezoudi et al. Citation2021b), on a UAS of type Skywalker operated by the Cyprus Institute. The two airborne platforms measured similar PNC absolute values (35 − 40
at a size range up to 31 µm) and at the same altitude ranges.
Space charge is measured using small charge sensors in a similarly shaped pod (referred to as the Charge-Pod), attached on the other wing of the aircraft. These sensors consist of a spherical metal electrode connected to an electrometer, which is sensitive to displacement currents produced by changes in the electric field (Nicoll and Harrison Citation2009). The electric current between the sensor and the surrounding air is calculated from the voltage output of the sensor. Space charge is then calculated by a conversion formula that uses the calculated current, the sensor effective area, and the ascent rate of the aircraft. A comprehensive description of this procedure and the components of the charge sensor itself can be found in Nicoll and Harrison (Citation2009). The operation of the Charge-Pod on the MASC-3, with validation flights including data correction for the aircraft movement, and vertical profiles in the atmospheric boundary layer (ABL), is presented in Schön et al. (Citation2022).
2.2. Location and flight pattern
During a Saharan dust event passing over the Eastern Mediterranean, MASC-3 flights were performed near Orounda, Cyprus on the 6 April 2022. The base of operations was the private airfield at the Unmanned Systems Research Laboratory (USRL – coordinates: 35.095 N, 33.081 E) of the Cyprus Institute. The site has a wide runway, which is ideal for take-off and landing procedures with a fixed-wing aircraft like the MASC-3, and the surrounding area consists of low-level grassland with no obstacles, further ensuring the safety of all flight procedures (Kezoudi et al. Citation2021a). The area was affected by Saharan dust from late afternoon of 5 April, and persisted on 6 April. Aerosol levels notably decreased two days later, as the dust shifted eastwards.
Vertical profiling with the MASC-3 consisted of a 2 km zigzag pattern during both ascent and descent of the aircraft, with an ascent/descent rate of 1.5 To avoid the effect of aircraft turns (which adversely influences the charge measurements), data from only the first half of each flight section are retained for analysis, as in Schön et al. (Citation2022), essentially omitting measurements during the turning procedures of the aircraft. A total of eight flights were carried out during the Cyprus campaign, of which two are presented here as representative of the dust event, each up to an altitude of 2800 m above sea level (a.s.l). Flight 1 took place on 6 April, at 08:29–09:32 UTC, and flight 2 at 11:54–12:53 UTC (add three hours for local EEST).
2.3. Additional dust observations
Apart from the in-situ measurements collected with the MASC-3, a number of other tools are used for the characterization and evolution of the dust event two days before and during the time of the flight operations. Back trajectories were retrieved from the Hybrid Single Particle Lagrangian Integrated Trajectory (HYSPLIT) model, by the National Oceanic Atmospheric Administration (NOAA) (Stein et al. Citation2015), to identify the origin of the airmasses observed above Cyprus during the times of measurements. Additionally, optical data were retrieved from the Spinning Enhanced Visible and Infrared Imager (SEVIRI), a radiometer on the Meteosat Second Generation (MSG) satellite Meteostat-8 (Indian Ocean Data Coverage – IODC) (Aminou Citation2002), which is operated by the European Organization for the Exploitation of Meteorological Satellites (EUMETSAT).
Further identification of the elevated dust was achieved by using the SEVIRI Dust RGB (red-green-blue) thermal infrared satellite imagery product (Lensky and Rosenfeld Citation2008; Martínez, Ruiz, and Cuevas Citation2009). With the SEVIRI Dust RGB, dust events are identifiable by their bright pink color, e.g., as in Brindley et al. (Citation2012). Due to the high time resolution of SEVIRI imagery (15 min) this enables dust plumes to be manually traced backwards in time to identify their sources. The starting point and progression of the dust plume was inspected, covering a time period from the early morning of 4 April, until the late evening of 5 April, when it first arrived in Cyprus. For 6 April, dust presence was evaluated based on aerosol optical depth (AOD) data from two ground-based sun photometers, one located in Nicosia (approximately 30 km away from the USRL airfield) and the other in Agia Marina Xyliatou (5.5 km south of the USRL airfield), that operate within the framework of the AErosol RObotic NETwork (AERONET) (Holben et al. Citation1998), which has also been used for Saharan dust analysis before (Smirnov et al. Citation1998).
Vertical extent during the dust transport from the Sahara was investigated by using 532 nm wavelength total attenuated backscatter vertical profiles and from the Cloud-Aerosol Lidar with Orthogonal Polarization (CALIOP) LiDAR instrument related to the Cloud-Aerosol Lidar and Infrared Pathfinder Satellite Observations (CALIPSO) (Winker et al. Citation2010). The CALIOP also provided aerosol classification version 3.41 of the aerosol subtyping algorithm product by the National Aeronautics and Space Administration (NASA) (Kim et al. Citation2018). A CE376 (CIMEL, France) LiDAR instrument (Papetta et al. Citation2023), measuring at two wavelengths (404 and 832 nm) at the premises of the Cyprus Institute and collocated with one of the sun photometers (coordinates: 35.141 N, 33.381 E, 181 m a.s.l), provided depolarization ratio, extinction and backscatter coefficient profiles up to 3200 m a.s.l, derived through a backward Klett-Fernald inversion algorithm (Klett Citation1981; Fernald Citation1984). These profiles of the dust from the CE376 were then correlated to the flight measurements with the MASC-3 at similar altitudes.
3. Results
3.1. Dust outbreak evolution
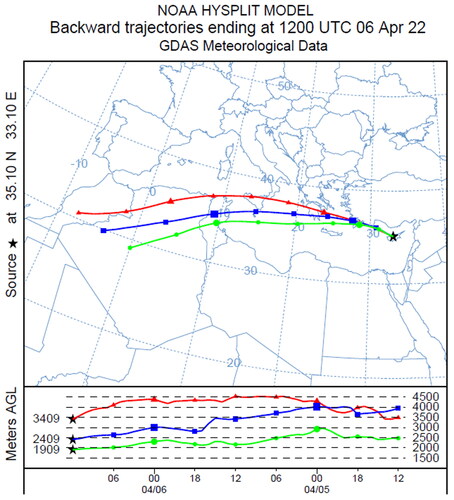
shows a 48-h back trajectory of the air mass that was present at the location of the measurements in Cyprus, at noon on 6 April 2022. As Saharan dust often resides in the free troposphere and above the ABL, three different starting points were selected: 2500, 3500, and 4000 m. The air masses traveled across the Mediterranean at approximately these altitudes, before slightly sinking on the morning of the 6 April 2022. Originating from central and northwest Algeria, as well as central central Morocco, this air mass was sampled thoroughly by the MASC-3. By profiling up to an altitude of almost 3000 m a.s.l, it effectively probed the air masses presented by the light green and blue lines in .
Figure 1. Single 48-h back trajectory of the sampled air mass during the day of measurements, from the HYSPLIT GDAS model (ending date time at 12:00 UTC on 6 April 2022). Three initial altitudes in m a.s.l (2500 – green, 3500 – red, and 4000 – blue line) and destination at the USRL in Orounda, Cyprus. Each colored line represents the path of the air mass with a starting altitude shown on the right and final altitude on the left, with the latter attached to a star that corresponds to the measurement location on the map. The back trajectories were similar for either flight, thus only one is shown here.
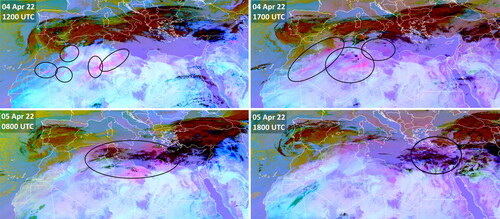
A similar picture is acquired when looking at images from the SEVIRI Dust RGB (). The dust source area includes north west Algeria and Libya, and first indications of dust uplift appear already during noon of 4 April 2022, marked by black circles. In the evening of the same day (4 April, 17:00 UTC), uplift continued and the transport was initiated toward the north east direction and through the Mediterranean. Transport of dust continued throughout the night, when dust moved further north toward upper level clouds. As the plumes merged and spread spatially, they moved further east alongside cloud formations, which are also visible in the darker colored areas of . During the morning of 5 April 2022 at 08:00 UTC, dust was widespread and co-located with the cloud. At 18:00 UTC, the homogeneously distributed thick dust layer first arrives in Cyprus and the surroundings. The satellite data for 6 April show dust that was widespread over the whole of the eastern Mediterranean, indicating a homogeneous distribution.
Figure 2. Images from the SEVIRI Dust RGB product on the Meteostat-8 satellite, covering two days prior to the measurement flights with the MASC-3 in Cyprus, on 6 April 2022. The images are color coded, specifically: magenta indicates dust clouds, black indicates cirrus clouds, dark red indicates ice clouds (more details on the image description can be found at EUMETSAT’s website: https://www.eumetsat.int/). The black circled areas in each image depict the first appearance and uplift of dust (upper left) on 4 April, its transport with clouds to the east through the Mediterranean (upper right and bottom left), and its arrival in Cyprus on the evening of 5 April (bottom right).
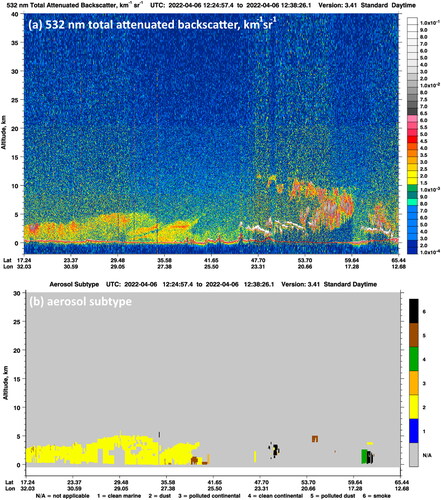
As seen in during the day of measurements (6 April), the total attenuated backscatter at 532 nm from CALIPSO shows higher values up to an altitude of approximately 3000 m a.s.l, which is around 2 (yellow areas in ) while also reaching a maximum of 3.5 − 4
(orange/red areas in ) above and around Cyprus. According to , increased aerosol concentrations were widespread over the eastern Mediterranean. These aerosols consisted almost purely of dust, as noted from , which has yellow (i.e., identified dust cloud) areas predominantly present in the measurement area, indicated with the vertical white line in . Elevated aerosol optical depth (AOD) levels were also recorded by the AERONET photometer in Nicosia, reaching 0.45 to 0.55 (from 08:00 to 15:00 UTC) for wavelengths between 340 and 870 nm, as well as the photometer in Agia Marina Xyliatou, which recorded values of 0.38 − 0.42 for the same wavelengths in the early morning (values retrieved from AERONET, but not shown). This rise of AOD, which was significantly higher compared to what would be expected on a dust-free day, correlates with the evident existence of dust in the area for 6 April.
Figure 3. (a) Total attenuated backscatter at 532 nm and (b) aerosol subtype characterization, from the CALIPSO satellite, taken on 6 April at 12:24 UTC. Each plot has coordinates on the horizontal axis that cover a geographical strip that extends from North East Africa to Norway, Scandinavia (in this coordinate range, the measurement location is at: 35.095 N, 33.081 E). The satellite’s overpass was still 5–7 west of Cyprus. In (a), the backscatter is color coded with the index on the side, and in (b), aerosol subtypes are also color coded and each type is denoted with a number and stated under the horizontal axis. Specifically, NA: not applicable, 1: clean marine, 2: dust, 3: polluted continental, 4: clean continental, 5: polluted dust, 6: smoke.
3.2. Vertical profiling
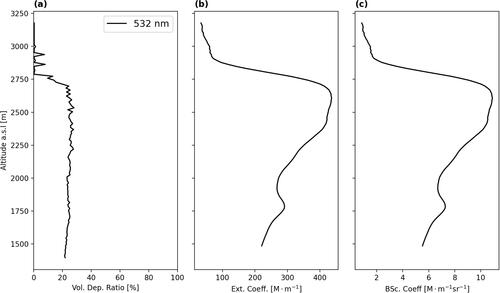
shows vertical profiles retrieved by the CE376 LiDAR instrument observations in Nicosia, on 6 April 2022, at 10:00 UTC, during the time when MASC-3 was performing its first flight. As the overlap region of this LiDAR is 1200 m, the vertical extent of the profiles covers a range from that altitude up to 3000 m a.s.l. These profiles display the volume depolarization ratio at 532 nm (VDR) () and the calculated backscatter () and extinction profiles (). Two local maxima can be identified in the extinction and backscatter coefficients’ vertical structure, a minor one at 1750 m a.s.l. (extinction coefficient at 260 backscatter coefficient at 7.5
), and a more pronounced one between 2300 and 2500 m a.s.l. (extinction coefficient at 430
backscatter coefficient at 12
). VDR remained around 20% up to 2700 m a.s.l, a level of depolarization that is indicative of mineral dust particles and has been examined in previous studies, e.g., by Tesche et al. (Citation2011). All three indicators decreased above that altitude, being close to zero at 3000 m a.s.l. This illustrates the presence of the Saharan dust layer with two peaks between 1750 and 2500 m a.s.l, from the CE376 measurements.
Figure 4. Volume depolarization ratio, extinction and backscatter coefficients at 532 nm wavelength, measured from the CE376 LiDAR operating in Nicosia. The profiles were captured on 6 April at 1000 UTC, at the time of the first flight of the MASC-3.
Results from the vertical profiling performed by the MASC-3 on 6 April, are shown in and . During the two flights, the UAS collected data for potential temperature and water vapor mixing ratio, horizontal wind and TKE, aerosol particle number concentrations (PNC) between 0.4 and 40 µm from the OPC-Pod and voltage output from the Charge-Pod.
Figure 5. Vertical profiles from the two MASC-3 flights on 6 April (flight 1 at noon, flight 2 in the afternoon), showing meteorological parameters, aerosol particle number concentrations and charge sensor readings in voltages. Each row indicates a different flight. Specifically: (a) potential temperature and mixing ratio, (b) wind speed and TKE, (c) PNC (raw data and 20 s moving averaged) from 0.4 to 40 µm, and (d) charge sensor voltage as a black line, and a 10 s moving average as a red line. On the bottom row, the plots show the same parameters for the second flight, from (e) to (h). Only the ascent through the extent of the Saharan dust layer is shown in the figure.
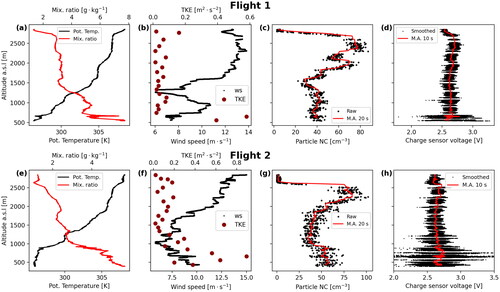
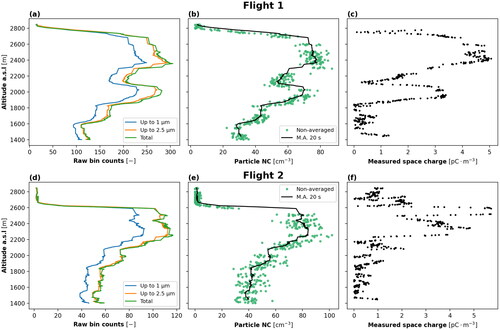
Figure 6. Aerosol particles and calculated space charge for the two flights. (a) Raw bin counts from the OPC-Pod (adding up aerosol numbers up to 1, 2.5 µm as well as the total size range of the sensor, i.e., 0.4–40 µm), (b) non-averaged PNC data in green, with a 20 s moving average as a black line, and (c) measured space charge from the Charge-Pod. On the bottom row, the plots show the same parameters for the second flight, from (d) to (f). Only the ascent is shown in the plots.
In , a shallow ABL can be observed for both flights in the potential temperature (up to 700 m in flight 1, and 900 m in flight 2) and mixing ratio profiles. Considering the elevation of 327 m at the measurement location (Kezoudi et al. Citation2021a), the ABL height was at a lower altitude than normal for the middle of a spring convective day (usually above 1000 m). These two profiles suggest a stable troposphere with a shallow ABL, as shown in . Mixing ratio varied between 2 and 8 (or, a maximum of 40% relative humidity throughout the whole vertical extent). Overall, the ABL was quite dry (5–8
) but the overlying layer was even drier (2–3
) for flight 1 and up to 4
for flight 2. The wind speed at ground level varied between 6 and 8
during the morning and 9–10
during the afternoon flight, reaching 12.5–14
at higher altitudes. Higher amounts of TKE, calculated as explained in the Appendix of Schön et al. (Citation2022), inside the ABL reached 0.4 − 0.85
while above it, the turbulence was, as expected, quite lower (below 0.2
). Additionally, small jumps of TKE could be identified at the boundaries of the different particle population layers (for instance in flight 1, at 2000 m a.s.l and at the upper dust layer edge between 2500 and 2600 m a.s.l) where TKE doubled, reaching 0.18
The Saharan dust layer can be identified from the MASC-3 data by the increased particle concentrations above 1500 m a.s.l in the PNC profiles (). A similar structure was observed by the CE376 LiDAR in Nicosia, which also captured two distinct peaks in backscatter and extinction coefficient in the same altitude range ( and 5c compared). During both flights of the MASC-3, the air layer containing Saharan dust extends roughly from an altitude of 1500 m a.s.l, which is also supported by vertical changes in mixing ratio and potential temperature (), TKE () and from the CE376’ profile of VDR (). PNC levels showed maxima of 80 − 100 within the Saharan dust layer and lower values of 40–50
within the ABL. There is a sharp drop in PNC above the dust layer, indicating a well defined top to the dust layer at 2500 m a.s.l, which is consistent between the two flights and the LiDAR profiles. Previous measurements of a different Saharan dust event with a balloon-borne OPC over Cyprus captured a layer from 3000 to 5000 m a.s.l, with peaks in PNC concentration at 50
in a size range from 0.6 to 13.9 µm (Kezoudi et al. Citation2021b). With the MASC-3, the dust plume was located at lower altitudes and higher PNC levels were measured, but also over a wider size spectrum.
The raw voltage from the charge sensor is shown in black in , demonstrating a large amount of charge in the ABL (i.e., below the temperature inversion), due to the interplay between higher turbulence levels and aerosol particles, that causes space charge dispersion across its extent. This is also consistent with previous measurements from the same sensor (Nicoll et al. Citation2018; Schön et al. Citation2022). Above the shallow ABL, the charge sensor voltage output is roughly constant () with height until it enters the dust layer, where a small increase (
) in voltage is evident.
More detailed analysis of the MASC-3 aerosol and charge data is presented in . show a breakdown of PNC vertical profiles for flights 1 and 2 for particles according to their measured diameters (<1 µm <2.5 µm and all diameters up to 40 µm). The measured dust mainly consisted of particles in the sub-micron and micron range (with the majority being <2.5 µm in diameter), while concentrations decreased for larger sizes. The vertical distributions also indicate some of the larger particles inside the dust layer rather than below it, as seen from difference between the peaks in the 2.5 µm and total bin counts of . It is noteworthy to mention that the refractive index of Saharan dust is different than the one configured by the manufacturer of the OPC-N3, and this would affect the size bin boundaries (but not the absolute PNC values shown in ) of the sensor, as detailed in similar studies including optical measurement instruments, e.g., by Ryder et al. (Citation2013); Renard et al. (Citation2016). To account for this, and assuming a refractive index for Saharan dust being (Johnson and Osborne Citation2011), the theoretical scattering cross section was calculated for two refractive indices (one assumed by the OPC-N3 and one of Saharan dust) considering the wavelength of the laser beam inside the instrument and integrated over its scattering angles, based on the formula explained in Jaenicke and Hanusch (Citation1993); Hagan and Kroll (Citation2020). Then, correction factors for each bin boundary of the OPC-N3 were calculated based on the procedure explained in the Appendix of Nurowska et al. (Citation2022), and these factors varied between 0.93 and 1.13 for sizes up to 10 µm and increased for larger sizes to about 1.5 − 1.6 at the OPC’s upper size boundary limits. In essence, these kind of correction factors indicate that the refractive index difference between the internally assumed specifications of the OPC-N3 and Saharan dust would mostly affect particles in the larger/giant mode, where the OPC-N3 most likely understates the size, but the diameters before and after the correction are comparable in the smaller scales.
To convert the raw voltage measured by the charge sensor (and shown in ) to space charge, the procedure described in Schön et al. (Citation2022) was followed. This involves applying a correction for the roll velocity of the MASC-3 aircraft to the raw voltages, converting this to a current, and calculating the space charge using the the sensor effective area and the ascent rate of the aircraft (Nicoll and Harrison Citation2016; Schön et al. Citation2022). As per Schön et al. (Citation2022), only the absolute values of space charge are discussed here. The calculated space charge values from the Charge-Pod are shown in . Generally, in conditions of a cloud or a dust layer, charge is expected to accumulate at the points of sharp change in conductivity, essentialy at the horizontal boundaries of the given layer, something that has been observed experimentally (Harrison et al. Citation2020), and also elaborated in Section 3.4 of this study. Our measurements demonstrate a clear, but small, increase in the space charge (up to 5 ) within the dust layer in both flights, with the maximum in the space charge being located at the height of the largest particle concentration. Closer examination reveals a very close correlation between the space charge and PNC. As would be expected from existing literature on crewed aircraft flights through dust or ice cloud layers, some charging of the aircraft body is expected within the dust layer (Lekas et al. Citation2014), which would be expected to be proportional to the PNC (Perala Citation2009). Although we cannot be certain that the origin of this high correlation is due to aircraft charging, and not charge on the dust particles themselves, we investigate the effect of potential aircraft charging on the space charge measurement in the next section.
3.3. Accounting for aircraft charge
Within the Saharan dust layer (from 1500 to 2500 m a.sl), shows a strong correlation between PNC and measured charge. This indicates evidence of charging of the aircraft from interaction with the dust particles within the dust layer. The magnitude of the space charge within the dust layer (<5 ) also illustrates this is a small effect, and many orders of magnitude smaller than what would be expected for crewed aircraft (Lekas Citation2019).
This is partly due to the design of the MASC-3 Charge-Pod, where the charge sensors are mounted in front of the pods, with the electrodes approximately 20 cm ahead of the leading edge of the wing ( in Schön et al. Citation2022). The front of the Charge-Pod is also wrapped with conductive copper foil to reduce buildup of charge on the aircraft surface. Laboratory (Perala Citation2009) and modeling studies (Lekas et al. Citation2014) of the expected charge accumulation on crewed aircraft through dust layers suggests a dependence of the charge on the area of the aircraft impacted by the dust, which is minimized for MASC-3 due to the small surface area of the UAS, and the placement and design of the Charge-Pods.
Laboratory tests (Perala Citation2009) also demonstrate a dependence of charging on aircraft speed (typically 600 − 700 cruising speed for crewed aircraft). For the MASC-3 flights the true air speed was an order of magnitude less than for crewed aircraft, and approximately constant (20 − 20.4
i.e., 72 − 74
) during the vertical profiles in flight 1 and 2. Therefore, the influence of changes in aircraft speed on charge accumulation are considered negligible in the flights described here. The main factor in controlling charge on the surface of the MASC-3 is expected to be the dust particle density, which has been found to scale linearly with aircraft charge (Perala Citation2009).
investigates the relationship between the dust particle number concentration (PNC) and the measured space charge within the dust layer, demonstrating a linear relationship between the two parameters (correlation coefficient r2 = 0.91 in flight 1, and 0.75 for flight 2). This linearity is stronger in flight 1 than flight 2, possibly due to increased turbulence from the more convective conditions during the afternoon than during morning (as also shown from the small, but still relatively higher TKE values in the dust layer of , compared to ). Since the focus of the measurements is to investigate the ambient dust particle charge, not the charge induced by the aircraft, a correction factor is developed based on the linearity between dust particle concentration and measured charge, for the dust layer only (and shown in ).
Figure 7. Scatterplot between measured particle concentrations and corresponding measured charge magnitude, covering the dust layer vertically during the MASC-3 flights. A linear fitted equation is also depicted as a red line, with the slope and intercept coefficients in the form of a line equation.
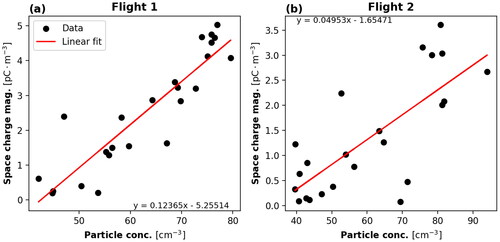
Considering PNC as the independent variable, the fitted line that results from a linear regression through the least squares method is described by the well known equation:
(1)
(1)
For our measurements, is the measured charge and PNC is the measured dust concentration. For each flight, the slope and intercept are calculated from the linear regression and stated in . Once the linear model is fitted to the data through EquationEquation (1)
(1)
(1) , it is used to correct the measured charge values based on the difference between the measured charge from the UAS, and predicted values from the linear regression. This difference is obtained by subtracting the predicted charge values from the measured charge (i.e., the residual), which is what we consider as the remaining dust charge variability after the aircraft charging has been removed:
(2)
(2)
show the measured charge (gray), plotted alongside the corrected charge (black). Application of the correction factor removes the similarity between the charge and PNC (shown in green), but the corrected charge values are now smaller in magnitude (reaching a maximum of 1 in flight 1 and 3
in flight 2). In both flights, the largest charge is observed at the horizontal edges of the dust layer, the source of which is investigated in the following section.
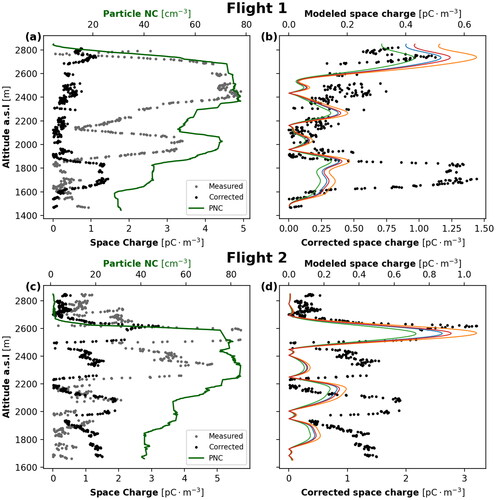
Figure 8. PNC, measured and modeled space charge, with the addition of corrected charge data, for the two flights. (a) 20 s Moving averaged PNC (green line), measured (gray points) and corrected charge (black points) on double horizontal axes, (b) modeled charge (solid lines) for different cases of background aerosol values (specifically: blue line for PNC = 1500 of 0.05 µm radius, orange line for PNC = 1500
of 0.2 µm radius, green line for PNC = 500
of 0.05 µm radius and red line for PNC = 500
of 0.2 µm radius), and corrected charge (black points) on double horizontal axes. On the bottom row, the plots show the same parameters for flight 2, from (c) to (d). Only the ascent is shown in the plots.
3.4. Modeling dust layer charge
The two main mechanisms thought to be responsible for dust particle charging are triboelectrification and attachment of ions to particles (Mallios et al. Citation2021). To accurately predict the charge expected in a dust layer, a detailed model including both of these processes is required, as has been done in Mallios, Daskalopoulou, and Amiridis (Citation2022). However, the development of such a model is outside the scope of the present work. Instead, here the expected charge in the dust layer is estimated only by employing ion-attachment considerations in one dimension (i.e., vertically), and then used as a basis for comparison with the corrected space charge. Ion generation occurs in the lower atmosphere due to ionization from Galactic Cosmic Rays (GCRs) and surface radioactivity (Bazilevskaya et al. Citation2008), with ions driven vertically due to the global electric circuit (GEC). This produces a vertical electric current flow Jc, which provides a constant supply of ions into the dust layer. Attachment of the small ions to the much larger dust particles causes the particles to charge, but also reduces the electrical conductivity of the air σ (where “clean” particle free air has a high conductivity, and particle laden air has a low conductivity”). Conductivity is calculated according to:
(3)
(3)
where e is the elementary charge (
),
and µ
are the positive and negative ion number concentrations and ion mobilities, respectively. In the case where dust particles are present, ion concentrations are calculated from the ion-balance equation, modified to include the aerosol effect on ion reduction (Hoppel Citation1986; Harrison and Carslaw Citation2003):
(4)
(4)
where q is the ion production rate, α is the ion-ion recombination coefficient, β is the ion-particle attachment coefficient, and Z is the dust concentration. For EquationEquation (4)
(4)
(4) , the following values were assumed:
, µ
It should be noted that in these basic calculations, these quantities are assumed to be constant with height, as the vertical variation is minimal over the depth of the dust layer (1.4 km). The ion production rate value of
is estimated from the model of Usoskin and Kovaltsov (Citation2006) at the altitude of the middle of the dust layer (2.2 km). The ion-particle attachment coefficients β were calculated for neutral particles with the measured mean particle diameters from the UAS flights. A more accurate approach would calculate β for bipolar charged particles, as well as consider how β changes as particles gain and lose charge, but this is outside the scope of the present work. To calculate the space charge ρ, we employ Gauss’ law in 1-D:
(5)
(5)
where z is the height ordinate and ε0 is the permittivity of free space. In this form, EquationEquation (5)
(5)
(5) has been shown to be a valid approximation for estimating charge in stratified layer clouds (Nicoll and Harrison Citation2011), and for charged layers in thunderstorms (Stolzenburg and Marshall Citation1994). The approach has been further implemented in more recent studies as well for the same purpose (Nicoll and Harrison Citation2016; Harrison, Nicoll, and Aplin Citation2017). Thus, since ρ depends on the vertical gradient in conductivity
we expect that space charge will exist at the upper and lower horizontal boundaries of the dust layer, where there is a substantial gradient in the dust particle concentration, and therefore conductivity, e.g., as in Zhou and Tinsley (Citation2007); Nicoll and Harrison (Citation2016). To estimate the space charge in flights 1 and 2, the conductivity is first calculated from EquationEquations (3)
(3)
(3) and Equation(4)
(4)
(4) , using the measured PNC and sizes from the OPC-Pod. Space charge is then calculated from the derived vertical gradient in conductivity with EquationEquation (5)
(5)
(5) (using interpolation spines to emphasize the dominant regions of charge). The resulting vertical profiles from the two flights are shown in . A range of background values for the clean air aerosol concentration and radius (i.e., away from the plume, and smaller than the detection limit of the OPC) has been used to give an idea of the potential variability due to this factor (but this only affects the magnitude of the charge, not the location).
shows an expected layer of charge at the upper edge of the dust layer in both flights (due to the substantial vertical gradient in PNC and therefore σ), with several smaller charge layers in the lower regions of the dust layer. The vertical gradient in PNC is much less pronounced at the dust layer base than at the top, leading to a much less defined charge layer at the base. The black points in show the corrected space charge from the MASC-3 (i.e., with the effect of aircraft charge removed). Comparison between this and the modeled charge demonstrates close agreement between the location of the predicted and corrected space charge at the upper dust layer edge for both flights (albeit with a difference in the magnitude of the charge, with the corrected charge twice as large in flight 1, and three times as large in flight 2). For flight 1, the location of the lower charge layers is similar between the modeled and corrected profiles, but the magnitude of the lowest charge layer is larger than predicted, and also larger than the uppermost charge layer. For flight 2 there is more of a discrepancy between the location of the modeled and corrected space charge for the lower charge layers. This could be due to the lower correlation between particle number concentration and measured charge (as shown in ), which may lead to an incomplete correction factor being applied to account for the aircraft charge.
4. Discussion
4.1. Vertical charge profiles
The airborne measurements from MASC-3 reported here demonstrated a weakly charged (0.2–3 ) layer of aerosols at an altitude of 1500 − 2500 m a.s.l. The back trajectories discussed in Section 3.1 demonstrate that the aerosols were identified as dust particles originating from Algeria, with an initial transit time of 48 h. Although small, the observed magnitude of charge within the layer is consistent with other observations of charged dust particles in elevated layers above the surface. For example, using a similar sensor to the one reported in this paper but flown on balloons, Harrison et al. (Citation2018) observed space charge up to +10
in a Saharan dust layer between 2 and 3 km altitude over the UK. Nicoll, Harrison, and Ulanowski (Citation2010) reported space charge from 5 to 25
during balloon flights through high altitude Saharan dust layers over the Cape Verde Isles, and Silva et al. reported charges in the base of elevated Saharan dust layers (derived from near surface E-field measurements) up to 10 and 34
at two locations during the same event in Portugal (Silva et al. Citation2016).
The magnitude of charge in elevated dust layers which have been transported far from their source region is generally orders of magnitude smaller than that observed in dust events close to the lofting region, e.g., in Yair et al. (Citation2016), which is likely due to differences in the charge generation mechanisms. The similarity (both in location and order of magnitude) between the modeled and observed charge reported here supports the concept that one of the mechanisms by which particles in elevated dust layers can become charged is through ion-particle attachment, in a similar manner to stratiform water clouds (Zhou and Tinsley Citation2007). This supports the theoretical findings of Mallios, Daskalopoulou, and Amiridis (Citation2022), whose calculations found that ion-particle attachment charging dominated over triboelectric charging in a modeled elevated dust layer. The observations of Nicoll, Harrison, and Ulanowski (Citation2010) also showed a well defined charge layer at the upper horizontal boundary of the dust layer, as was found for the MASC-3 measurements reported here and discussed in Section 3.4. It should be noted that Gauss’ law in the form of EquationEquation (5)(5)
(5) may still not fully apply in asymmetrical layers, or layers of small horizontal extent, where the E-field may not be solely in the vertical direction (Baumgaertner et al. Citation2014), and could lead to estimation uncertainties. However, the motivations explained in Section 3.4, combined with the results from our measurements and previous literature, illustrate how the approach is still reasonable to employ. The location of the lower charge layers away from the upper dust layer edge correlates with some of the locations where there are vertical gradients in PNC (and therefore conductivity), but it is also possible that charge generated on the edges of the dust layer can be mixed turbulently into the bulk of the layer. There is some support for this in that the both MASC-3 flights show slightly larger TKE at the top of the dust layer, which may act to transport charge down from the upper edge toward the middle of the layer, but this is not conclusive. Since only a basic approximation of ion-particle attachment charging is included here, this is likely also to be a source of the discrepancy between the modeled and measured charge within the dust layer and a more detailed modeling approach, such as that in Mallios, Daskalopoulou, and Amiridis (Citation2022), may produce a better agreement between the two.
The long time (48 h) between the dust lofting stage and charge measurement period suggests that any initial charge on the particles, such as that generated through triboelectrification, would have decayed (e.g., based on the ion-balance equation and measured aerosol concentration and size, the relaxation time is on the order of several minutes). It is possible that further particle-particle collisional charging may have occurred during the dust transit phase, but at the time of the MASC-3 flight it is unlikely that substantial charge was generated due to the relatively small PNC and low likelihood of collisions. We therefore conclude that the majority of the charge observed in the dust layer was due to charge generation from ion-particle attachment, as per Mallios, Daskalopoulou, and Amiridis (Citation2022). There is unlikely to be any effect of such small levels of charge on the motion of the dust particles, or particle alignment (Ulanowski et al. Citation2007) in this particular layer, but it is likely that layers with larger particle number concentrations, and sharper particle/clear air edges will become more highly charged through the ion-particle attachment layer charging mechanism supported by the observations reported here. Our observations are also in agreement with the modeling study by Mallios, Daskalopoulou, and Amiridis (Citation2022), who surmised that these small charges suggest that the electrical forces on the particles would be an order of magnitude smaller than the gravitational force and therefore, large particles at least, would be unlikely to be held aloft by electrical influences in this particular dust layer.
4.2. Aircraft charge correction limitations
As discussed in detail in Section 3.3, the high correlation between the PNC and measured charge led to the conclusion that at least some of the voltage change measured by the charge sensor was due to accumulation of charge on the body of the aircraft. Previous studies, e.g., by Perala (Citation2009) have suggested that this is due to triboelectrification of the aircraft body from interaction with the dust particles, and is independent of particle charge. Our assessment of the limited literature around dust electrification of aircraft, e.g., Perala (Citation2009); Lekas (Citation2019), is that quantifying dust particle charge from aircraft measurements has not fully been possible in the past with crewed aircraft, due to the large charge of the aircraft itself dominating the E-field measurements.
By using a UAS like the MASC-3, which has a smaller surface area and flies at much slower speeds, the density of dust particles intercepted by the aircraft is much lower than for a crewed aircraft. In addition, the careful placement of the sensor pods (mounted in front of the wings) on the MASC-3, coated in conductive foil, minimizes the effect of charge on the aircraft body on the charge measurement. Therefore, we suspect that the measurements reported here are the first successful measurements of dust charge during an aircraft flight. Limitations in the aircraft charge correction factor derived in Section 3.3 do, however, exist, such as the assumption that the aircraft charge is linearly dependent on PNC, and any error in the correction factor will couple through to the final value for the corrected space charge. However, the similarity, both in the location and order of magnitude, between the modeled and corrected space charge (shown in ) suggests that these errors are minor and the aircraft correction factor is sensible.
5. Conclusions
This study reports rare, simultaneous in-situ observations of vertical aerosol and charge profiles made through an elevated layer of Saharan dust passing over Cyprus, using a UAS of type MASC-3 on 6 April 2022. Back trajectory simulations and satellite imagery showed the dust layer’s origins over Algeria approximately 48 h before the UAS flights. Vertical profiles (during the morning and afternoon) showed the dust layer at altitudes between 1500 and 2500 m, with particle number concentration peaks between 80 and 100 (97% of particles less than 2.5 µm in size). Elevated values of charge were observed within the dust layer, and found to be highly linearly correlated with the particle number concentration, suggesting a small influence of aircraft surface charge on the charge measurements. A correction factor (based on linear regression between the measured charge and particle number concentration) was developed and applied to the charge data, resulting in corrected charge values of 1.5–3
inside the dust layer. The largest magnitude of charge (from both flights) was found to be associated with the horizontal edges of the dust layer, in the region where a sharp boundary between particle laden and clear air was identified. A comparison was made between the charge predicted from particle-ion attachment through the dust layer and the observed corrected charge, and close agreement found for the location and magnitude of the charge from both flights. This suggests that by the time of the UAS measurements (48 h from the source region), any residual charge on the dust particles which was generated from triboelectrification during the lofting phase had decayed, with the observed charge likely being generated from attachment with ions in the dust layer. These measurements demonstrate for the first time that with careful design and placement of sensors, fixed wing UAS can be used for dust particle charge measurements, and this has not been possible previously on crewed aircrafts, which are subject to much higher levels of aircraft surface charging. Although the estimated corrected charge here is small, and unlikely to affect the behavior of large aerosols in this particular dust layer, these rare measurements provide valuable insight into the magnitude of charge and charging mechanisms expected in elevated layers of dust far from their source regions.
Acknowledgements
The authors would like to thank the colleagues of the Environmental Physics work group at the university of Tübingen (Matteo Bramati, Kjell zum Berge, Ines Schäfer, Hasan Mashni), for providing logistical and technical support for the measurement flights in Cyprus. We’d also like to thank Henrik Rieth, who was the pilot of the UAS during the experimental campaign. Sincere thanks to Christos Keleshis and his colleagues, who supported us during our stay in Cyprus, and to Philippe Goloub, for curating the AOD data in AERONET. Lastly, thanks to R.G. Harrison for the discussions on the charge sensor data.
Disclosure statement
No potential conflict of interest was reported by the author(s).
Data availability statement
Output of the HYSPLIT model was taken from NOAA’s website, which is available online: https://www.ready.noaa.gov. CALIPSO data were obtained from the NASA Langley Research Center Atmospheric Science Data Center: https://asdc.larc.nasa.gov/. SEVIRI data were available from Center for Environmental Data Analysis: https://data.ceda.ac.uk/badc/msg/data, and provided by EUMETSAT. AOD data were retrieved from the website of the AERONET network: https://aeronet.gsfc.nasa.gov/. Data from the UAS flights can be provided by the corresponding author, upon reasonable request.
Additional information
Funding
References
- Adebiyi, A. A., and J. F. Kok. 2020. Climate models miss most of the coarse dust in the atmosphere. Sci. Adv. 6 (15):eaaz9507. doi:10.1126/sciadv.aaz9507.
- Aminou, D. 2002. MSG’S Seviri instrument. ESA Bull. 111 15–17.
- Baumgaertner, A., G. Lucas, J. Thayer, and S. Mallios. 2014. On the role of clouds in the fair weather part of the global electric circuit. Atmos. Chem. Phys. 14 (16):8599–610. doi:10.5194/acp-14-8599-2014.
- Bazilevskaya, G., I. Usoskin, E. Flückiger, R. Harrison, L. Desorgher, R. Bütikofer, M. Krainev, V. Makhmutov, Y. I. Stozhkov, A. Svirzhevskaya, et al. 2008. Cosmic ray induced ion production in the atmosphere. Space Sci. Rev. 137 (1–4):149–73. doi:10.1007/s11214-008-9339-y.
- Brindley, H., P. Knippertz, C. Ryder, and I. Ashpole. 2012. A critical evaluation of the ability of the spinning enhanced visible and infrared imager (Seviri) thermal infrared red-green-blue rendering to identify dust events: Theoretical analysis. J. Geophys. Res. 117 (D7). doi:10.1029/2011JD017326.
- Carlson, T. N., and S. G. Benjamin. 1980. Radiative heating rates for Saharan dust. J. Atmos. Sci. 37 (1):193–213. doi:10.1175/1520-0469(1980)037<0193:RHRFSD>2.0.CO;2.
- Daskalopoulou, V., S. A. Mallios, Z. Ulanowski, G. Hloupis, A. Gialitaki, I. Tsikoudi, K. Tassis, and V. Amiridis. 2021. The electrical activity of Saharan dust as perceived from surface electric field observations. Atmos. Chem. Phys. 21 (2):927–49. doi:10.5194/acp-21-927-2021.
- Esposito, F., R. Molinaro, C. Popa, C. Molfese, F. Cozzolino, L. Marty, K. Taj-Eddine, G. Di Achille, G. Franzese, S. Silvestro, et al. 2016. The role of the atmospheric electric field in the dust-lifting process. Geophys. Res. Lett. 43 (10):5501–8. doi:10.1002/2016GL068463.
- Fernald, F. G. 1984. Analysis of atmospheric Lidar observations: Some comments. Appl. Opt. 23 (5):652–3. doi:10.1364/ao.23.000652.
- Franzese, G., F. Esposito, R. Lorenz, S. Silvestro, C. I. Popa, R. Molinaro, F. Cozzolino, C. Molfese, L. Marty, and N. Deniskina. 2018. Electric properties of dust devils. Earth Planet. Sci. Lett. 493:71–81. doi:10.1016/j.epsl.2018.04.023.
- Ginoux, P., M. Chin, I. Tegen, J. M. Prospero, B. Holben, O. Dubovik, and S.-J. Lin. 2001. Sources and distributions of dust aerosols simulated with the GOCART model. J. Geophys. Res. 106 (D17):20255–73. doi:10.1029/2000JD000053.
- Goudie, A. S., and N. J. Middleton. 2001. Saharan dust storms: Nature and consequences. Earth. Sci. Rev. 56 (1–4):179–204. doi:10.1016/S0012-8252(01)00067-8.
- Granados-Muñoz, M. J., J. A. Bravo-Aranda, D. Baumgardner, J. L. Guerrero-Rascado, D. Pérez-Ramírez, F. Navas-Guzmán, I. Veselovskii, H. Lyamani, A. Valenzuela, F. J. Olmo, et al. 2016. A comparative study of aerosol microphysical properties retrieved from ground-based remote sensing and aircraft in situ measurements during a Saharan dust event. Atmos. Meas. Tech. 9 (3):1113–33. doi:10.5194/amt-9-1113-2016.
- Gringel, W., and R. Muhleisen. 1978. Sahara dust concentration in the troposphere over the North Atlantic derived from measurements of air conductivity. Beitr. Phys. Atmosph. 2 (51): 121–8.
- Hagan, D. H., and J. H. Kroll. 2020. Assessing the accuracy of low-cost optical particle sensors using a physics-based approach. Atmos. Meas. Tech. 13 (11):6343–55. doi:10.5194/amt-13-6343-2020.
- Harrison, R., and K. Carslaw. 2003. Ion-aerosol-cloud processes in the lower atmosphere. Rev. Geophys. 41 (3). doi:10.1029/2002RG000114.
- Harrison, R. G., K. A. Nicoll, and K. L. Aplin. 2017. Evaluating stratiform cloud base charge remotely. Geophys. Res. Lett. 44 (12):6407–12. doi:10.1002/2017GL073128.
- Harrison, R. G., K. A. Nicoll, E. Mareev, N. Slyunyaev, and M. J. Rycroft. 2020. Extensive layer clouds in the global electric circuit: Their effects on vertical charge distribution and storage. Proc. Math. Phys. Eng. Sci. 476 (2238):20190758. doi:10.1098/rspa.2019.0758.
- Harrison, R. G., K. A. Nicoll, G. J. Marlton, C. L. Ryder, and A. J. Bennett. 2018. Saharan dust plume charging observed over the UK. Environ. Res. Lett. 13 (5):054018. doi:10.1088/1748-9326/aabcd9.
- Haywood, J. M., P. N. Francis, M. D. Glew, and J. P. Taylor. 2001. Optical properties and direct radiative effect of Saharan dust: A case study of two Saharan dust outbreaks using aircraft data. J. Geophys. Res. 106 (D16):18417–30. doi:10.1029/2000JD900319.
- Holben, B. N., T. F. Eck, I. a Slutsker, D. Tanré, J. Buis, A. Setzer, E. Vermote, J. A. Reagan, Y. Kaufman, T. Nakajima, et al. 1998. Aeronet-a federated instrument network and data archive for aerosol characterization. Remote Sens. Environ. 66 (1):1–16. doi:10.1016/S0034-4257(98)00031-5.
- Hoppel, W. A. 1986. Atmospheric electricity in the planetary boundary layer. In Earth's Electrical Environment, ed. National Research Council, 149–165. Washington, DC: National Academies Press.
- Israelevich, P., E. Ganor, P. Alpert, P. Kishcha, and A. Stupp. 2012. Predominant transport paths of saharan dust over the Mediterranean Sea to Europe. J. Geophys. Res. 117 (D2). doi:10.1029/2011JD016482.
- Jaenicke, R., and T. Hanusch. 1993. Simulation of the optical particle counter forward scattering spectrometer probe 100 (FSSP-100). Aerosol Sci. Technol. 18 (4):309–22. doi:10.1080/02786829308959607.
- Johnson, B., and S. Osborne. 2011. Physical and optical properties of mineral dust aerosol measured by aircraft during the GERBILS campaign. Quart. J. Royal Meteoro. Soc. 137 (658):1117–30. doi:10.1002/qj.777.
- Kamra, A. 1972. Measurements of the electrical properties of dust storms. J. Geophys. Res. 77 (30):5856–69. doi:10.1029/JC077i030p05856.
- Katz, S., Y. Yair, C. Price, R. Yaniv, I. Silber, B. Lynn, and B. Ziv. 2018. Electrical properties of the 8–12th September, 2015 massive dust outbreak over the Levant. Atmos. Res. 201:218–25. doi:10.1016/j.atmosres.2017.11.004.
- Kezoudi, M., C. Keleshis, P. Antoniou, G. Biskos, M. Bronz, C. Constantinides, M. Desservettaz, R.-S. Gao, J. Girdwood, J. Harnetiaux, et al. 2021a. The unmanned systems research laboratory (USRL): A new facility for UAV-based atmospheric observations. Atmosphere 12 (8):1042. doi:10.3390/atmos12081042.
- Kezoudi, M., M. Tesche, H. Smith, A. Tsekeri, H. Baars, M. Dollner, V. Estellés, J. Bühl, B. Weinzierl, Z. Ulanowski, et al. 2021b. Measurement report: Balloon-borne in situ profiling of Saharan dust over Cyprus with the UCASS optical particle counter. Atmos. Chem. Phys. 21 (9):6781–97. doi:10.5194/acp-21-6781-2021.
- Kim, M.-H., A. H. Omar, J. L. Tackett, M. A. Vaughan, D. M. Winker, C. R. Trepte, Y. Hu, Z. Liu, L. R. Poole, M. C. Pitts, et al. 2018. The CALIPSO version 4 automated aerosol classification and Lidar ratio selection algorithm. Atmos. Meas. Tech. 11 (11):6107–35. doi:10.5194/amt-11-6107-2018.
- Klett, J. D. 1981. Stable analytical inversion solution for processing LIDAR returns. Appl. Opt. 20 (2):211–20. doi:10.1364/AO.20.000211.
- Lekas, T. I. 2019. Electrostatic charging of an aircraft due to airborne dust particles impacts. CEAS Aeronaut. J. 10 (3):903–8. doi:10.1007/s13272-018-00355-0.
- Lekas, T. I., J. Kushta, S. Solomos, and G. Kallos. 2014. Some considerations related to flight in dusty conditions. AOP. 3 (1):45–56. doi:10.3233/AOP-140043.
- Lensky, I. M., and D. Rosenfeld. 2008. Clouds-aerosols-precipitation satellite analysis tool (CAPSAT). Atmos. Chem. Phys. 8 (22):6739–53. doi:10.5194/acp-8-6739-2008.
- Mallios, S., V. Daskalopoulou, V. Spanakis-Misirlis, G. Hloupis, and V. Amiridis. 2023. Novel measurements of desert dust electrical properties: A multi-instrument approach during the ASKOS 2022 campaign. Environ. Sci. Proceed. 26 (1):22.
- Mallios, S. A., V. Daskalopoulou, and V. Amiridis. 2022. Modeling of the electrical interaction between desert dust particles and the Earth’s atmosphere. J. Aerosol Sci. 165:106044. doi:10.1016/j.jaerosci.2022.106044.
- Mallios, S. A., G. Papangelis, G. Hloupis, A. Papaioannou, V. Daskalopoulou, and V. Amiridis. 2021. Modeling of spherical dust particle charging due to ion attachment. Front. Earth Sci. 9:709890. doi:10.3389/feart.2021.709890.
- Mamali, D., E. Marinou, J. Sciare, M. Pikridas, P. Kokkalis, M. Kottas, I. Binietoglou, A. Tsekeri, C. Keleshis, R. Engelmann, et al. 2018. Vertical profiles of aerosol mass concentration derived by unmanned airborne in situ and remote sensing instruments during dust events. Atmos. Meas. Tech. 11 (5):2897–910. doi:10.5194/amt-11-2897-2018.
- Marenco, F., C. Ryder, V. Estellés, D. O'Sullivan, J. Brooke, L. Orgill, G. Lloyd, and M. Gallagher. 2018. Unexpected vertical structure of the Saharan Air Layer and giant dust particles during AER-D. Atmos. Chem. Phys. 18 (23):17655–68. doi:10.5194/acp-18-17655-2018.
- Maring, H., D. Savoie, M. Izaguirre, L. Custals, and J. Reid. 2003. Mineral dust aerosol size distribution change during atmospheric transport. J. Geophys. Res. 108 (D19). doi:10.1029/2002JD002536.
- Martínez, M. A., J. Ruiz, and E. Cuevas. 2009. Use of seviri images and derived products in a wmo sand and dust storm warning system. IOP Conf. Ser: Earth Environ. Sci. 7:012004. doi:10.1088/1755-1307/7/1/012004.
- Mashni, H., H. Knaus, A. Platis, and J. Bange. 2023. Development of an airfoil-based passive volumetric air sampling and flow control system for fixed-wing UAS. Bull. Atmos. Sci. Technol. 4 (1):6. doi:10.1007/s42865-023-00057-4.
- Mauz, M., A. Rautenberg, A. Platis, M. Cormier, and J. Bange. 2019. First identification and quantification of detached-tip vortices behind a wind energy converter using fixed-wing unmanned aircraft system. Wind Energ. Sci. 4 (3):451–63. doi:10.5194/wes-4-451-2019.
- Nicoll, K., and R. Harrison. 2009. A lightweight balloon-carried cloud charge sensor. Rev. Sci. Instrum. 80 (1):014501. doi:10.1063/1.3065090.
- Nicoll, K., and R. Harrison. 2011. Charge measurements in stratiform cloud from a balloon based sensor. J. Phys: Conf. Ser. 301:012003. doi:10.1088/1742-6596/301/1/012003.
- Nicoll, K., R. Harrison, and Z. Ulanowski. 2010. Observations of Saharan dust layer electrification. Environ. Res. Lett. 6 (1):014001. doi:10.1088/1748-9326/6/1/014001.
- Nicoll, K., and R. G. Harrison. 2016. Stratiform cloud electrification: Comparison of theory with multiple in-cloud measurements. Quart. J. Royal Meteoro. Soc. 142 (700):2679–91. doi:10.1002/qj.2858.
- Nicoll, K. A., R. G. Harrison, H. G. Silva, R. Salgado, M. Melgâo, and D. Bortoli. 2018. Electrical sensing of the dynamical structure of the planetary boundary layer. Atmos. Res. 202:81–95. doi:10.1016/j.atmosres.2017.11.009.
- Nurowska, K., M. Mohammadi, S. Malinowski, and K. Markowicz. 2022. Applicability of the low-cost optical particle counter OPC-N3 for microphysical measurements of fog. Atmos. Meas. Tech. Discuss. 2022:1–25.
- O'Sullivan, D., F. Marenco, C. L. Ryder, Y. Pradhan, Z. Kipling, B. Johnson, A. Benedetti, M. Brooks, M. McGill, J. Yorks, et al. 2020. Models transport Saharan dust too low in the atmosphere: A comparison of the MetUM and CAMS forecasts with observations. Atmos. Chem. Phys. 20 (21):12955–82. doi:10.5194/acp-20-12955-2020.
- Papetta, A., F. Marenco, R.-E. Mamouri, A. Nisantzi, I. E. Popovici, P. Goloub, M. Kezoudi, S. Victori, and J. Sciare. 2023. Lidar depolarization characterization using a reference system. EGUsphere 2023:1–25.
- Perala, R. 2009. A critical review of precipitation static research since the 1930’s and comparison to aircraft charging by dust. Electro Magnetic Applications Inc 7655, Denver, CO.
- Platis, A., B. Altstädter, B. Wehner, N. Wildmann, A. Lampert, M. Hermann, W. Birmili, and J. Bange. 2016. An observational case study on the influence of atmospheric boundary-layer dynamics on new particle formation. Boundary-Layer Meteorol. 158 (1):67–92. doi:10.1007/s10546-015-0084-y.
- Rautenberg, A., M. Schön, K. Zum Berge, M. Mauz, P. Manz, A. Platis, B. van Kesteren, I. Suomi, S. T. Kral, and J. Bange. 2019. The multi-purpose airborne sensor carrier MASC-3 for wind and turbulence measurements in the atmospheric boundary layer. Sensors 19 (10):2292. doi:10.3390/s19102292.
- Renard, J.-B., F. Dulac, G. Berthet, T. Lurton, D. Vignelles, F. Jégou, T. Tonnelier, M. Jeannot, B. Couté, R. Akiki, et al. 2016. LOAC: a small aerosol optical counter/sizer for ground-based and balloon measurements of the size distribution and nature of atmospheric particles–part 1: Principle of measurements and instrument evaluation. Atmos. Meas. Tech. 9 (4):1721–42. doi:10.5194/amt-9-1721-2016.
- Renard, J.-B., F. Dulac, P. Durand, Q. Bourgeois, C. Denjean, D. Vignelles, B. Couté, M. Jeannot, N. Verdier, and M. Mallet. 2018. In situ measurements of desert dust particles above the western Mediterranean sea with the balloon-borne light optical aerosol counter/sizer (loac) during the Charmex campaign of summer 2013. Atmos. Chem. Phys. 18 (5):3677–99. doi:10.5194/acp-18-3677-2018.
- Rudge, W. D. 1913. Atmospheric electrification during South African dust storms. Nature 91 (2263):31–2. doi:10.1038/091031a0.
- Ryder, C. L., E. J. Highwood, P. D. Rosenberg, J. Trembath, J. K. Brooke, M. Bart, A. Dean, J. Crosier, J. Dorsey, H. Brindley, et al. 2013. Optical properties of Saharan dust aerosol and contribution from the coarse mode as measured during the Fennec 2011 aircraft campaign. Atmos. Chem. Phys. 13 (1):303–25. doi:10.5194/acp-13-303-2013.
- Ryder, C. L., E. J. Highwood, A. Walser, P. Seibert, A. Philipp, and B. Weinzierl. 2019. Coarse and giant particles are ubiquitous in Saharan dust export regions and are radiatively significant over the Sahara. Atmos. Chem. Phys. 19 (24):15353–76. doi:10.5194/acp-19-15353-2019.
- Schön, M., K. A. Nicoll, Y. G. Büchau, S. Chindea, A. Platis, and J. Bange. 2022. Fair-weather atmospheric charge measurements with a small UAS. Journal of Atmospheric and Oceanic Technology 39 (11):1799–813. doi:10.1175/JTECH-D-22-0025.1.
- Schön, M., V. Savvakis, M. Kezoudi, A. Platis, and J. Bange. 2024. OPC-Pod: A new sensor payload to measure aerosol particles for small uncrewed aircraft systems. Journal of Atmospheric and Oceanic Technology 41 (5):499–513. doi:10.1175/JTECH-D-23-0078.1.
- Schrod, J., D. Weber, J. Drücke, C. Keleshis, M. Pikridas, M. Ebert, B. Cvetković, S. Nickovic, E. Marinou, H. Baars, et al. 2017. Ice nucleating particles over the Eastern Mediterranean measured by unmanned aircraft systems. Atmos. Chem. Phys. 17 (7):4817–35. doi:10.5194/acp-17-4817-2017.
- Silva, H., F. Lopes, S. Pereira, K. Nicoll, S. Barbosa, R. Conceição, S. Neves, R. G. Harrison, and M. C. Pereira. 2016. Saharan dust electrification perceived by a triangle of atmospheric electricity stations in Southern Portugal. J. Electrostat. 84:106–20. doi:10.1016/j.elstat.2016.10.002.
- Smirnov, A., B. Holben, I. Slutsker, E. Welton, and P. Formenti. 1998. Optical properties of Saharan dust during ACE 2. J. Geophys. Res. 103 (D21):28079–92. doi:10.1029/98JD01930.
- Smith, H. R., Z. Ulanowski, P. H. Kaye, E. Hirst, W. Stanley, R. Kaye, A. Wieser, C. Stopford, M. Kezoudi, J. Girdwood, et al. 2019. The universal cloud and aerosol sounding system (UCASS): a low-cost miniature optical particle counter for use in dropsonde or balloon-borne sounding systems. Atmos. Meas. Tech. 12 (12):6579–99. doi:10.5194/amt-12-6579-2019.
- Soupiona, O., A. Papayannis, P. Kokkalis, R. Foskinis, G. Sánchez Hernández, P. Ortiz-Amezcua, M. Mylonaki, C.-A. Papanikolaou, N. Papagiannopoulos, S. Samaras, et al. 2020. EARLINET observations of Saharan dust intrusions over the northern Mediterranean region (2014–2017): Properties and impact on radiative forcing. Atmos. Chem. Phys. 20 (23):15147–66. doi:10.5194/acp-20-15147-2020.
- Stein, A., R. R. Draxler, G. D. Rolph, B. J. Stunder, M. D. Cohen, and F. Ngan. 2015. NOAA’s HYSPLIT atmospheric transport and dispersion modeling system. Bull. Am. Meteorol. Soc. 96 (12):2059–77. doi:10.1175/BAMS-D-14-00110.1.
- Stolzenburg, M., and T. C. Marshall. 1994. Testing models of thunderstorm charge distributions with Coulomb’s law. J. Geophys. Res. Atmos. 99 (D12):25921–32.
- Stuut, J.-B., I. Smalley, and K. O’Hara-Dhand. 2009. Aeolian dust in Europe: African sources and European deposits. Quat. Int. 198 (1–2):234–45. doi:10.1016/j.quaint.2008.10.007.
- Tanré, D., J. Haywood, J. Pelon, J. Léon, B. Chatenet, P. Formenti, P. Francis, P. Goloub, E. Highwood, and G. Myhre. 2003. Measurement and modeling of the Saharan dust radiative impact: Overview of the Saharan dust experiment (SHADE). J. Geophys. Res. 108 (D18). doi:10.1029/2002JD003273.
- Tesche, M., S. Gross, A. Ansmann, D. Müller, D. Althausen, V. Freudenthaler, and M. Esselborn. 2011. Profiling of saharan dust and biomass-burning smoke with multiwavelength polarization Raman lidar at Cape Verde. Tellus B: Chem. Phys. Meteorol. 63 (4):649–76. doi:10.1111/j.1600-0889.2011.00548.x.
- Ulanowski, Z., J. Bailey, P. Lucas, J. Hough, and E. Hirst. 2007. Alignment of atmospheric mineral dust due to electric field. Atmos. Chem. Phys. 7 (24):6161–73. doi:10.5194/acp-7-6161-2007.
- Ulanowski, Z., O. V. Kalashnikova, P. W. Lucas, and B. Berçot. 2008. Influence of alignment on the scattering properties atmospheric mineral dust. Proceedings of 11th Electromagnetic and Light Scattering Conference 2008, University of Hertfordshire.
- Usoskin, I. G., and G. A. Kovaltsov. 2006. Cosmic ray induced ionization in the atmosphere: Full modeling and practical applications. J. Geophys. Res. 111 (D21). doi:10.1029/2006JD007150.
- Van Der Does, M., P. Knippertz, P. Zschenderlein, R. Giles Harrison, and J.-B. W. Stuut. 2018. The mysterious long-range transport of giant mineral dust particles. Sci. Adv. 4 (12):eaau2768. doi:10.1126/sciadv.aau2768.
- Varga, G., G. Újvári, and J. Kovács. 2014. Spatiotemporal patterns of Saharan dust outbreaks in the Mediterranean basin. Aeolian Res. 15:151–60. doi:10.1016/j.aeolia.2014.06.005.
- Williams, E., N. Nathou, E. Hicks, C. Pontikis, B. Russell, M. Miller, and M. Bartholomew. 2009. The electrification of dust-lofting gust fronts (“haboobs”) in the Sahel. Atmos. Res. 91 (2–4):292–8. doi:10.1016/j.atmosres.2008.05.017.
- Winker, D., J. Pelon, J. Coakley, Jr, S. Ackerman, R. Charlson, P. Colarco, P. Flamant, Q. Fu, R. Hoff, C. Kittaka, et al. 2010. The CALIPSO mission: A global 3D view of aerosols and clouds. Bulletin of the American Meteorological Society 91 (9):1211–30. doi:10.1175/2010BAMS3009.1.
- Yair, Y., S. Katz, R. Yaniv, B. Ziv, and C. Price. 2016. An electrified dust storm over the Negev Desert, Israel. Atmos. Res. 181:63–71. doi:10.1016/j.atmosres.2016.06.011.
- Zhang, H., T.-L. Bo, and X. Zheng. 2017. Evaluation of the electrical properties of dust storms by multi-parameter observations and theoretical calculations. Earth Planet. Sci. Lett. 461:141–50. doi:10.1016/j.epsl.2017.01.001.
- Zhang, H., and Y.-H. Zhou. 2020. Reconstructing the electrical structure of dust storms from locally observed electric field data. Nat. Commun. 11 (1):5072. doi:10.1038/s41467-020-18759-0.
- Zhou, L., and B. A. Tinsley. 2007. Production of space charge at the boundaries of layer clouds. J. Geophys. Res. 112 (D11). doi:10.1029/2006JD007998.
- Zhou, Y.-H., Q. Shu He, and X. Jing Zheng. 2005. Attenuation of electromagnetic wave propagation in sandstorms incorporating charged sand particles. Eur. Phys. J. E Soft Matter. 17 (2):181–7. doi:10.1140/epje/i2004-10138-5.
- Zum Berge, K., M. Schoen, M. Mauz, A. Platis, B. van Kesteren, D. Leukauf, A. El Bahlouli, P. Letzgus, H. Knaus, and J. Bange. 2021. A two-day case study: Comparison of turbulence data from an unmanned aircraft system with a model chain for complex terrain. Boundary-Layer Meteorol. 180 (1):53–78. doi:10.1007/s10546-021-00608-2.