
 ?Mathematical formulae have been encoded as MathML and are displayed in this HTML version using MathJax in order to improve their display. Uncheck the box to turn MathJax off. This feature requires Javascript. Click on a formula to zoom.
ABSTRACT
Genetic parameters, performance of provenances, and genotype by environment interaction (G × E) for diameter at breast height (DBH), survival, and modulus of elasticity of time-of-flight (MOEtof) (an indirect measure of stiffness), were investigated in six lodgepole pine progeny trials, aged 33–36 years, within three breeding zones in northern Sweden. Provenances of Yukon origin had the highest growth but lowest stiffness at higher latitude, while those of British Columbia (BC) origin grew faster at lower latitudes and had highest stiffness within zone 5. Combined-site heritability estimates ranged from 0.09 to 0.19 for DBH, from 0.19 to 0.27 for MOEtof, and from 0.13 to 0.26 for survival. Type-B genetic correlations () were generally high for all studied traits, except for DBH and survival in zone 4 (
= 0.74 and 0.40, respectively) and for MOEtof in zone 2 (
= 0.46). On the basis of the results obtained in this study, G × E for stiffness in northern Sweden and unfavourable growth-stiffness genetic correlation should be considered in selective breeding programmes of lodgepole pine. To achieve the highest stiffness for lodgepole pine, provenances of Yukon origin should be planted at lower latitudes and those of BC origin should be planted at lower elevations within the tested breeding zones.
Introduction
Lodgepole pine (Pinus contorta Dougl.) is native to North America, where it covers more than 26 million hectares of forest land in western Canada and the United States (Critchfield Citation1980). Its natural distribution area falls between latitude 31° N in Baja California and 64° N in the Yukon in Canada. It grows from sea level to 3900 m of elevation (Koch Citation1996). Lodgepole pine is the major commercial species in its natural habitat, and its wood and fibre properties are suited for the production of high-quality lumber and pulp-wood products. Due to its rapid growth and wide range of environmental tolerance, it has been introduced as an exotic species for multiple purposes in both northern and southern hemisphere (Elfving et al. Citation2001).
Large-scale establishment of the inland variety of lodgepole pine (P. contorta var. latifolia) plantations in Sweden was initiated during the 1960s and 1970s by transferring seed and breeding materials from provenances of lodgepole pine in Canada mirroring similar climate regions in northern Sweden (Hagner Citation1971, Citation1993). Early observations revealed that provenances that were obtained from interior British Columbia (BC) and Yukon performed best (Lindgren et al. Citation1993). It was also discovered that in contrast to the native Scots pine (Pinus sylvestris L.), lodgepole pine performs better with a 2–5° northward transfer compared to its latitudinal range in Canada (Hagner and Fahlroth Citation1974; Elfving et al. Citation2001). The significant breeding programme for lodgepole pine in Sweden was started in the late1970s. The intention was to make Sweden self-supporting with genetically good lodgepole pine base material and seed sources. The programme included plus-tree selection in western Canada, genetic testing of open-pollinated families in field tests in Sweden, and establishment of six seedling seed orchards, one for each orchard zone (Ericsson Citation1994).
According to results of Swedish experimental plantations, lodgepole pine is superior over Scots pine in terms of growth, productivity, damage resistance, and survival (Elfving and Norgren Citation1993; Elfving et al. Citation2001; Fries et al. Citation2017). Despite such advantages, stem breakage and natural mortality due to wind and snow is a major problem in lodgepole pine plantations (Hansson and Karlman Citation1997; Elfving et al. Citation2001). This may be attributed to a greater biomass of foliage (Norgren Citation1996), poor silvicultural practices which has caused root deformation and later instability (Rosvall Citation1994), or lower stiffness and lower bending strength of the stem (Andersson Citation1987). However, such drawbacks can be avoided through proper silvicultural practices and incorporation of wood quality traits, particularly wood stiffness, as an important trait in advanced breeding programmes.
Wood stiffness, measured as its modulus of elasticity (MOE), is the most important trait for construction timber. However, direct measurement of the bending MOE, known as static MOE, is destructive, time consuming, and expensive (Gapare et al. Citation2010). Recent works have shown that measuring stiffness of standing trees based on acoustic waves is highly efficient, and there is a growing interest to use acoustic tools in tree improvement programmes for wood quality traits (Wang et al. Citation2007; Lenz et al. Citation2013; Chen et al. Citation2015). Additionally, recent study by Hayatgheibi et al. (Citation2017) reported very high genetic correlation between MOE measured acoustically and those obtained based on SilviScan technology using two trials of lodgepole pine (Hayatgheibi et al. Citation2017).
The Swedish breeding strategy for lodgepole pine is generally similar to that of Norway spruce (Picea abies L. Karst.) and Scots pine, except that lodgepole pine appears to be less sensitive to transfers as well as the genetic conservation of lodgepole pine within the breeding programme is of lower priority than Norway spruce and Scots pine. In addition to production, quality, and general resistance to biotic and abiotic stresses, another important breeding objective for lodgepole pine, is adaptation and preparedness for any future climatic change (Danell et al. Citation1993).
The importance of using seed sources adapted to their plantation environments for reforestation has long been recognized (Wu and Ying Citation2004, Wang et al. Citation2006). Climate is considered as a force of natural selection leading to local adaptation and differentiation of tree populations along climatic gradients. In the face of rapid climate change, it is becoming more important to construct and allocate deployment populations to environments where they will be well adapted (Rehfeldt et al. Citation2006; Wang et al. Citation2010). Further, a detailed knowledge of genetic control of breeding objective and selection criteria traits (Wu et al. Citation2008), levels of genotype by environmental interactions (hereafter referred to as G × E), and genetic correlations between traits is required to implement an effective breeding strategy (Wu et al. Citation2007; Silva et al. Citation2014).
In forestry, when G × E occurs, the phenotypic response of genotypes vary when grown under different climatic and edaphic conditions (Bridgwater and Stonecypher Citation1978). The lack of consistency in the response of genotypes across environments may be due to either change in the ranking of genotypes and/or alterations in the scale (Lynch and Walsh Citation1998).
The rank-change interactions complicates the design of breeding and deployment strategies as tree breeders must decide whether to select for stability of performance, whereby the rate of population improvement is slow, or to select genotypes for specific environments to maximize genetic gain in that site, but with greater programme costs (Namkoong et al. Citation2012).
In trees, G × E has been extensively studied, followed by the recent review (Li et al. Citation2017), and significant G × E has been reported, primarily for growth traits, in nearly all commercially important species such as radiata pine (Pinus radiata D. Don) (Wu and Matheson Citation2005; Baltunis et al. Citation2010), loblolly pine (Pinus taeda L.) (Li and McKeand Citation1989), and Norway spruce (Chen et al. Citation2017).
To date, several studies have investigated genetic control of growth, survival, form traits (Fries Citation1986; Ericsson et al. Citation1994), and wood quality traits (Hayatgheibi et al. Citation2017) in Swedish lodgepole pine plantations. However, G × E for growth and wood quality has not been yet quantified in lodgepole pine.
This study was the first to make use of all available growth and wood stiffness data from six lodgepole pine progeny trials in Sweden to explore G × E for these traits. The specific objectives were to (1) estimate heritability for tree diameter, survival, and wood stiffness; (2) estimate genetic and phenotypic correlations between tree diameter and wood stiffness; (3) evaluate possible genetic gain and correlated genetic response for diameter and stiffness; (4) investigate G × E for tree diameter, survival, and wood stiffness using six progeny trials within three breeding zones in northern Sweden; (5) compare performance of provenances for growth and stiffness within and among breeding zones.
Materials and methods
Study materials and measurements
The Swedish base breeding population of lodgepole pine originated from natural stands distributed in the interior of Yukon, BC, and Alberta in western Canada, locations well-matched with the harsh climatic conditions which occur in much of northern Sweden. Trials within breeding zone two (Mader and Jovan) originated from four provenances in Yukon (Carmacks, Frances Lake, Watson Lake, and Whitehorse), trials within breeding zone four (Övra and Hemmingen) originated from three provenances in BC (Fort St. John, Prince George, Fort Nelson) and one provenance in Yukon (Watson Lake), and trials within breeding zone five (Lagfors and Hemmesmark) originated from two provenances in BC (Fort St. John and Prince George), were selected for this study ((A,B)). Trials within each breeding zone included ∼200 common half-sib families, while there were no common families among breeding zones. Detailed characteristics of the trials were described in .
Figure 1. Locations of six lodgepole pine progeny trials (within three breeding zones) in northern Sweden (A) and their seed origins (provenances) distributed in Yukon and British Columbia (BC) in Western Canada (B).
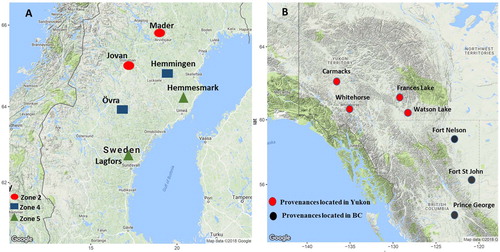
Table 1. Site descriptions for six lodgepole pine progeny trials assessed for DBH, MOEtof and survival.
The experimental design for each trial was a randomized complete block (RCB) layout with five replicates. Each family was planted in 10-tree and 12-row plots in each block. Tree spacing was 2 m between rows and 1.5 m within rows.
The response variables measured for each tree included three traits assessed at the ages 33-36 years: diameter at breast height (DBH), survival (1 = alive trees, 0 = dead trees), and acoustic velocity (AV) on standing trees. The Hitman ST300 tool (Fiber-gen, Christchurch; New Zealand) was used to measure the acoustic velocity of standing trees by inserting two sensor probes (transmitter and receiver) into the outer wood of the tree. The distance was measured with a laser beam and an acoustic wave was passed through the stem by striking the transmitter probe with a steel hammer. More detailed description of AV measurements has been given in (Hayatgheibi et al. Citation2017).
The dynamic modulus of elasticity (MOEtof) of standing trees can be obtained using the AV according to the Young’s equation (Wang et al. Citation2001):(1)
(1) where
is the green density (kg/m3) (Bucur Citation2006),
is the velocity of the wave (m/s) and the constant green density of 1000 kg/m3 is usually used for calculating dynamic MOE in standing trees (Lenz et al. Citation2013). In this study, the constant green density of 1000 kg/m3 was used.
Climate data
Climate information for the six trials is shown in . Monthly mean temperature and precipitation for each trial from the year of planting to the year of DBH measurement were extracted from a high-resolution (4 × 4 kilometre grid size) climate data base in Sweden (http://luftweb.smhi.se/). Mean annual temperature (MAT), mean annual precipitation (MAP), mean annual precipitation as snow (MASF) (mean precipitation of temperature <0°), mean temperature and precipitation during growing season (April to October) (MTGS, MPGS, respectively), mean temperature and precipitation during summer (May to August) (MTSUM, MPSUM, respectively), and mean temperature in the coldest months (January to March) (MTCM) were calculated.
Table 2. Climate information (from 1979 to 2015) for six lodgepole pine progeny trials within three breeding zones located in northern Sweden.
Statistical analyses
Genetic analysis was done in two stages: individual- and combined-site analysis using ASReml statistical software package (Gilmour et al. Citation2009). The mean DBH and mean MOEtof among provenances at six progeny trials were compared using one-way ANOVA and Tukey HSD test (Sokal and Rohlf Citation1995).
Single-site analysis
Firstly, a single-site univariate analysis was performed to estimate the genetic variance components and individual-tree narrow-sense heritability estimates for DBH, MOEtof, and survival. The family linear mixed-effects model (model 1) fitted to these data was as follows:(2)
(2) where y is the vector of observation on the m-th tree from the l-th family within the k-th provenance in the j-th block, µ is the overall mean,
and
are the fixed effects of the k-th provenance and the j-th block, respectively. The variable
is the random effect of the l-th family within the k-th provenance and
is the random interactive effect of the j-th block and the l-th family within the k-th provenance and
is the random residual effect. DBH and MOEtof were analysed as continuously distributed variable traits, while survival is a threshold trait with two categories (alive or dead). Therefore, the probability of survival was modelled with a generalized linear mixed model using a logit link function (Nakagawa and Schielzeth Citation2010; Xiong et al. Citation2010).
The individual-tree narrow-sense heritability () for each trait at each trial was calculated using the variance components from the univariate single-site analysis, assuming these open-pollinated families are half-sib families (Falconer and Mackay Citation1989).
(3)
(3) where
is the additive genetic variance,
is the phenotypic variance,
is among-family variance,
is the family by block variance, and
is the residual variance.
Bivariate, single-site analysis was then carried out to estimate the additive genetic and phenotypic correlations (type-A) between traits and
(
) within a site as follows:
(4)
(4) where
is the estimated phenotypic or additive genetic covariance between traits
and
,
is the estimated additive genetic variance for trait
, and
is the estimated additive genetic variance for trait
.
Variances are not independent of the scale and mean of the respective traits (Sokal and Rohlf Citation1995). Therefore, to relatively compare genetic variances of the different traits across sites, the genetic coefficient of variation was calculated as:(5)
(5) where,
is the coefficient of additive genetic variation,
is the standard deviation of the additive genetic variation, and
is the mean of the trait.
Combined-site analysis
In order to determine the extent of G × E for DBH and MOEtof, combined-site (two sites within each zone), univariate analysis were conducted and type-B genetic correlations (Burdon Citation1977) for these traits were estimated using a linear mixed-model (model 2) as follows:(6)
(6) The definitions for the model effects are as for model 1 in Equation (2), except
is the fixed effect of the
-th site;
is the random interaction effect of the
-th site with the
-th family;
is the random interaction effect of the
-th site with the j-th block and the l-th family. The overall mean (
,
,
, and
were considered as fixed effects and other terms as random.
For the analysis and estimation of type-B genetic correlation, both heterogeneous additive genetic variance and error variances
were included in the model
where,
and
are the additive genetic variances and covariances, respectively;
is the error variance for each site;
is the identity matrix equal to the number of observations at each site and 0 indicates no site–site error co-variance.
Type B genetic correlation of additive effects across sites ( was calculated as:
(7)
(7) where
is the covariance between the additive effects of the same trait at different sites;
and
are estimated additive variances for the same traits at different sites. Standard errors for heritability, type-A and type-B genetic correlations were estimated using ASReml (Gilmour et al. Citation2009) and the significance of these parameters was inferred from the estimated standard error.
Heritability estimates from single-site analysis are biased upward because the estimates of additive genetic variance contain variance components of G × E if G × E component is significant (White et al. Citation1993). Unbiased estimates of heritability and type-A genetic correlations were estimated using univariate and bivariate combined-site analysis, respectively.
The genetic gain expressed as percentage in direct selection of trait i was estimated as:(8)
(8) where
is the selection intensity of 1% (
= 2.67),
is the narrow-sense heritability of the trait and
is the coefficient of variation of the phenotypic effect (calculated as the phenotypic standard deviation divided by the mean of the specific trait). The correlated response of the target trait
based on indirect selection of correlated trait i, was calculated as:
(9)
(9) where
is the selection intensity of 1% (
= 2.667),
are the square root of narrow-sense heritability for the selected trait and the target trait, respectively.
is the additive genetic correltion between the traits and
is the phenotypic coefficient of variation for the target trait
.
Results
Summary statistics for the traits
Summary statistics for DBH, MOEtof and the survival rate of trees at each trial are presented in . The greatest mean DBH was at Mader (132 mm) and the lowest was at Hemmesmark (105.2 mm). Similarly, mean DBH values at Övra and Lagfors were greater than those at Hemmingen and Jovan (). Average MOEtof was lowest at Mader (11.2 GPa) and were greatest at Lagfors and Hemmesmark (15.9 GPa and 15.1 GPa, respectively). Highest survival was recorded at Hemmingen and Jovan (83% and 82%, respectively), while Mader and Hemmesmark had the lowest survival (51% and 66%, respectively). Genetic coefficient of variation ( for DBH ranged from 7.4% to 13.7% and 7.2% to 11.8% for MOEtof with the lowest coefficients at Lagfors and Övra and the greatest at Hemmesmark and Mader for both traits ().
Table 3. Descriptive statistics for DBH, MOEtof and the survival rate at six progeny trials of lodgepole pine.
Provenance performances
The mean DBH and mean MOEtof of lodgepole pine provenances assessed at six progeny trials within three zones are presented in and , respectively. Additionally, the boxplots of DBH and MOEtof for each provenance assessed at the six lodgepole pine progeny trials are presented in supplementary materials, Figure 1 and Figure 2, respectively. Provenances Frances Lake and Whitehorse had greatest mean DBH at both Mader and Jovan, while Carmacks and Watson Lake had the lowest mean DBH. The mean DBH of Whitehorse was significantly greater than that of Watson Lake at Mader (p-value < .05) whereas such difference was not significant at Jovan (p-value = .08).
Figure 2. Diameter at breast height (DBH) (mm) means for provenances of lodgepole at the six progeny trials (within three breeding zones) in northern Sweden. The vertical lines in the middle of the boxes are error bars.
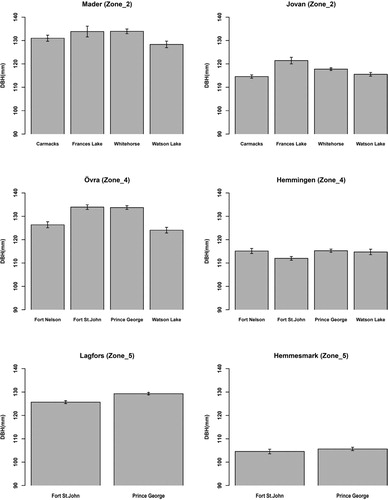
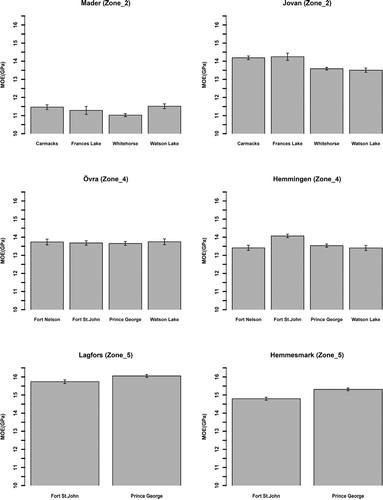
Figure 3. Modulus of elasticity (MOE) (GPa) means for provenances of lodgepole at the six progeny trials (within three breeding zones) in northern Sweden. The vertical lines in the middle of the boxes are error bars.
At Övra, mean DBH of the provenances Fort St. John and Prince George were significantly greater than those of Fort Nelson and Watson Lake (p-value < .05), while there was no significant difference among mean DBH of provenances at Hemmingen, except for the significant difference between Prince George and Fort St. John (p-value = .01).
At Lagfors the provenance Prince George had slightly and significantly greater mean DBH than Fort St. John, whereas such difference was non-significant at Hemmesmark.
At Mader, the mean MOEtof of Whitehorse was significantly lower than those of Carmacks and Watson Lake (p-value < .05) whereas mean MOEtof was not significantly different among other provenances. At Jovan, mean MOEtof of Carmacks and Frances Lake were significantly greater than those of Watson Lake and Whitehorse (p-value < .05) while other differences were not significant.
Mean MOEtof was similar among all provenances at Övra and Hemmingen, except that at Hemmingen, mean MOEtof of Fort St. John was significantly greater than MOEtof of other provenances (p-value < .001).
As was observed for mean DBH, mean MOEtof of Prince George was slightly greater than that of Fort St. John at Lagfors (P-value = 0.02), whereas such difference was non-significant at Hemmesmark.
Individual-tree narrow-sense heritability estimates (
Heritability estimates obtained for DBH, MOEtof and survival at each site are presented in . Heritability for DBH ranged from 0.10 to 0.32 with the lowest estimates obtained at Övra and Lagfors (0.10 and 0.12, respectively), while greatest estimates obtained at Mader and Hemmesmark (0.32 and 0.23, respectively). Heritabilities obtained for DBH at Jovan and Hemmingen were similar (0.17). For MOEtof, lowest were observed at Övra and Lagfors (0.18 and 0.29, respectively), while they were moderate to high at other trials (0.58
0.44). Survival at Mader, Lagfors and Hemmingen had the greatest
(0.74, 0.58, 0.43, respectively), whereas it was less heritable or non-significant at Jovan, Övra, and Hemmesmark (0.24, 0.13, 0.06, respectively).
Table 4. Phenotypic () and additive genetic () correlations between DBH and MOEtof, narrow-sense heritability estimates () for DBH, MOEtof, and survival at the six progeny trials of lodgepole pine.
Combined-site analysis showed heritability estimates that ranged from 0.09 to 0.19 for DBH, 0.19 to 0.27 for MOEtof, and 0.13 to 0.26 for survival (). When comparing among traits, lowest were obtained for DBH using both single-site and combined-site analysis. In general, heritabilities observed for combined-site analysis were lower than heritabilities obtained using individual-site analysis, particularly for
obtained for MOEtof at combined trials Mader and Jovan.
Table 5. Phenotypic () and additive genetic () correlations between DBH and MOEtof, type-B genetic correlations (, genetic gain ) and correlated genetic response () narrow-sense heritability estimates () for DBH, MOEtof, and survival based on combined-site analysis.
Correlations between DBH and MOEtof
Additive genetic () and phenotypic
) correlations obtained between DBH and MOEtof for individual-site analysis are presented in . As expected, correlation estimates obtained between these two traits were mostly negative (–0.12
–0.59) except for the positive and non-significant genetic correlation obtained at Hemmesmark (0.21
0.15). In general, absolute values of the genetic correlation estimates were larger than the corresponding phenotypic estimates ().
Greatest negative and
were observed for Mader (–0.59 and –0.34, respectively) and for Hemmingen (–0.45 and –0.29, correspondingly), while
was less negative and associated with high standard errors at other three sites (Övra = –0.35
0.20, Jovan = –0.12
0.17, and Lagfors = –0.20
0.14).
Genetic and phenotypic correlations between DBH and MOEtof were also calculated using combined-site analysis (). As similarly observed for single-site analysis, DBH was negatively correlated with MOEtof at Övra-Hemmingen (and Jovan-Mader (r
a = −0.26 ± 0.17), while such correlation was positive and non-significant at Lagfors-Hemmesmark (
. Similarly, phenotypic correlations were moderate and negative at Övra-Hemmingen (
and Mader-Jovan (
, while it was nearly zero at Lagfors-Hemmesmark
.
Genetic gains and response to selection
The genetic gains observed for direct traits were generally moderate (), with the greatest gain for DBH obtained at breeding zone 2 (e.g. = 10.9%) and the greatest gain for MOEtof obtained at breeding zone 4 (e.g.
= 11.3%). As expected, due to the negative genetic correlation between growth and stiffness, selection based on DBH generated slight negative genetic gains for MOEtof in breeding zone 2 and 4 (
= –2%, –2.2%, respectively).
G × E and type-B genetic correlations ()
The extent of G × E was investigated for all three traits (). A value of close to one indicates little genotype by environment interaction, while a low
indicates extensive genotype by environment interaction, implying parental rankings may change across sites. In general, type-B additive genetic correlations for all three traits were very high across paired-sites (). For example,
for DBH and MOEtof were mostly greater than 0.9 except for
of DBH at Övra-Hemmingen (
= 0.74) and MOEtof at Mader-Jovan (
= 0.46). For survival,
was mostly close to one except at Övra-Hemmingen (
= 0.40).
Discussion
Trial means and provenance performances
This study used measures of DBH, MOEtof, and survival from three sets of lodgepole pine open-pollinated trials within three breeding zones in northern Sweden originating from provenances distributed in Yukon and BC in western Canada.
Several studies have found that natural population variation of lodgepole pine is well related to latitude and longitude (Wu and Ying Citation2004) or temperature (Wang et al. Citation2006, Citation2010) and frost-free period (Rehfeldt Citation1988). Similarly, a steep elevational genetic differences has been demonstrated for the inland variety in its natural range, especially below latitude 56° (Ying et al. Citation1985; Ying Citation1991).
For lodgepole pine in Sweden, it has been evidenced that survival is largely dependent on the latitude of origin, whereby seed sources of northern origin had higher survival along with the higher rate of seed production (Lindgren et al. Citation1994). Additionally, it has been reported that height growth is associated with altitude of origin, whereby fastest growth was achieved for provenances about 800 m, and there was a decline in growth above this threshold (Lindgren Citation1983; Fries and Lindgren Citation1986).
In general, interactions of species and provenances with environments are usually not pronounced within a region, unless there are large differences in climates or soils (White et al. Citation2007). In our study, soil and climatic conditions were mostly similar within a breeding zone. However, within breeding zone 2, Mader had lower temperatures and higher snow fall. Similarly, within breeding zone 4, Övra had higher precipitation, particularly during growing season, and within breeding zone 5, Hemmesmark had higher snow fall (). In addition, within zones 4 and 5, trials at lower latitudes had higher elevations.
Our results generally indicate that the mean performance of provenances, particularly for mean DBH, differed significantly within a breeding zone, despite their slight differences within a test site. As such, seed sources originating from Yukon, the northernmost provenances, had better growth performance in Mader than in Jovan, particularly provenances Frances Lake and Whitehorse.
In contrast, seed sources originating from BC, had better growth performance when planted at trials with lower latitudes within a breeding zone. Further, maximum growth performance of provenances originating from BC, Fort St. John and Prince George in particular, was achieved at Övra, the trial associated with the highest precipitation during vegetative growth and the highest elevation.
Further, it has been stated that differences in wood properties related to provenances are not very large. However, occasionally seed source plays an important role in determining wood properties. As such, specific gravity has been reported to decrease with increasing latitude and elevation of the parental source (Zobel and Jett Citation1995).
In our study, in contrast to what was observed for DBH, provenances originating from Yukon, particularly Whitehorse, had the lowest mean stiffness at Mader (higher latitude), and highest mean stiffness of seed sources originating from BC was obtained for Fort St. John and Prince George when planted at Lagfors and Hemmesmark, trials with the warmest temperatures and the lowest elevations.
Overall, the trial mean differences of DBH and performance of provenances in this study are consistent with results of the study by Ericsson (Citation1993), whereby these provenances and progeny trials at age about 10 years were assessed for height and survival. However, we observed that trees in Mader had greater mean DBH than those in Jovan, whereas mean height was greater at Jovan in Ericsson (Citation1993). Similarly, in his study, trees at Mader and Hemmesmark had the lowest survival, and lowest DBH was obtained at Hemmesmark.
According to Ericsson et al. 1993, trial Mader had been exposed to harsh climatic conditions followed by heavy fungal attacks, principally Gremmeniella abietina, which occurred in the middle of 1980s in northern Sweden (Ericsson Citation1993; Elfving et al. Citation2001).
Likely, Hemmesmark is the site of lower fertility compared to other trials and has been more exposed to windstorm, whereby about 100 trees fell during winter storms in 2013 and 2014.
In general, to achieve the highest stiffness for lodgepole pine, provenances of Yukon origin should be planted at lower latitudes and those of BC origin should be planted at lower elevations within the tested breeding zones.
Individual-site analysis
Genetic variations obtained for DBH were the highest at Mader and Hemmesmark ( = 11.8%, 13.7%, respectively) and therefore
were greatest at these two trials. The lowest
of DBH at Övra and Lagfors might be related to their lowest genetic variations (
= 7.6%, 7.4%, respectively) as well as the very high phenotypic variance obtained at Övra.
Genetics of wood quality traits have been extensively studied in various conifer species and results indicate that wood quality traits generally have higher heritability than growth traits and genetic correlations between growth and wood quality traits are mostly unfavourable (Hallingbäck et al. Citation2008; Wu et al. Citation2008; Chen et al. Citation2014; Hong et al. Citation2014; Hayatgheibi et al. Citation2017).
Similarly, MOEtof in this study had higher heritability than DBH, and the average heritability estimates of MOEtof ( = 0.40 ± 0.1) was slightly greater than those reported in Norway spruce (
= 0.31 ± 0.06) (Chen et al. Citation2015), white spruce (
= 0.38 ± 0.07) (Picea glauca MoenchVoss) (Lenz et al. Citation2013), and radiata pine (
= 0.23 ± 0.11) (Gapare et al. Citation2010), but similar to those of slash pine (Pinus elliottii Englm.) (
= 0.42 ± 0.07) (Li et al. Citation2007), and Scots pine (
= 0.44 ± 0.1) (Hong et al. Citation2014).
Genetic and phenotypic correlations between DBH and MOEtof were significantly negative at Mader, Hemmingen, and Övra, while they were non-significant at Lagfors, Hemmesmark, and Jovan.
In general, the lowest stiffness obtained at Mader as well as its high negative genetic correlation with DBH implies that wood quality traits, stiffness in particular, should be considered as an important breeding objective trait for selection of the next generation of lodgepole pine in northern Sweden.
Combined-site analysis and G × E interactions
There are several analytical methods to measure the extent of G × E for traits in tree breeding (Li et al. Citation2017). The type-B genetic correlation (Burdon Citation1977) approach is considered as one of the preferred methods due to its ability in characterizing patterns of ranking changes of genotypes across environments (Li et al. Citation2017) as well as being easily handled in linear mixed-models with imbalanced data (Baltunis et al. Citation2010).
Results of G × E studies revealed that G × E is not very important for stem and wood quality traits while it is more evident for growth traits (Wu and Matheson Citation2005; Baltunis et al. Citation2010; Gapare et al. Citation2010).
However, there was little evidence of G × E for DBH in this study, indicating the relative performance of genotypes is stable across environments within the same breeding zone. Similarly, there was no evidence of G × E for MOEtof at trials within the breeding zones 4 and 5. In contrast, type-B genetic correlation was low ( = 0.46) at breeding zone 2 for MOEtof, which signifies existence of G × E and there might be changes in the ranking of genotypes for stiffness in these two most northern sites. Literature indicates that G × E for wood quality traits is generally low compared to growth traits. This significant G × E for MOEtof at breeding zone 2 is an aberration compared to other studies and the two other breeding zones in this study.
Conclusion
Provenances of Yukon origin had the highest growth but lowest stiffness at higher latitude, while those of BC origin grew faster at lower latitudes and had the highest stiffness within low altitude zone.
Heritability ranged from 0.10 to 0.32 for DBH, 0.18 to 0.58 for MOEtof, and 0.06 to 0.74 for survival among the six sites. Heritability for combined-site estimates in each breeding zone ranged from 0.09 to 0.19 for DBH, from 0.19 to 0.27 for MOEtof, and from 0.13 to 0.26 for survival.
Type-B genetic correlations were high for all three studied traits, except for DBH and survival in zone 4 (
Unfavourable growth-stiffness genetic correlations and correlated responses indicate that breeding for a 1% increase in diameter would confer about 2% decreases in lodgepole pine stiffness within zone 2 and 4.
On the basis of the results obtained in this study, G × E for stiffness in northern Sweden and unfavourable growth-stiffness genetic correlation should be considered in selective breeding programmes of lodgepole pine
Acknowledgements
The authors also acknowledge Liming Bian, Zhiqiang Chen, David Hall, and Zhou Hong for their assistance in field sampling.
Disclosure statement
No potential conflict of interest was reported by the authors.
Additional information
Funding
References
- Andersson E. 1987. Pinus contorta – Hållfasthet [Pinus contorta – strength]. Uppsala: Department of Forest Production, Swedish University of Agricultural Science. Report No. 185; 44 p. Swedish with English summary.
- Baltunis BS, Gapare WJ, Wu HX. 2010. Genetic parameters and genotype by environment interaction in radiata pine for growth and wood quality traits in Australia. Silvae Genet. 59(2–3):113–124. doi: 10.1515/sg-2010-0014
- Bridgwater FE, Stonecypher RW. 1978. Genotype × environment interaction: implications in tree breeding programs. In: Hollis CA, Squillace AE, editors. 1978. Proceedings of Fifth North American Forest Biology Workshop; 13–15 Mar. Gainesville: University of Florida; p. 46–61.
- Bucur V. 2006. Acoustics of wood, 2nd ed. Berlin: Springer. 393 p.
- Burdon RD. 1977. Genetic correlation as a concept for studying genotype-environment interaction in forest tree breeding. Silvae Genet. 26(5–6):168–175.
- Chen Z-Q, Gil MRG, Karlsson B, Lundqvist S-O, Olsson L, Wu HX. 2014. Inheritance of growth and solid wood quality traits in a large Norway spruce population tested at two locations in southern Sweden. Tree Genet Genomes. 10(5):1291–1303. doi: 10.1007/s11295-014-0761-x
- Chen Z-Q, Karlsson B, Lundqvist S-O, Gil MRG, Olsson L, Wu HX. 2015. Estimating solid wood properties using Pilodyn and acoustic velocity on standing trees of Norway spruce. Ann For Sci. 72(4):499–508. doi: 10.1007/s13595-015-0458-9
- Chen Z-Q, Karlsson B, Wu HX. 2017. Patterns of additive genotype-by-environment interaction in tree height of Norway spruce in southern and central Sweden. Tree Genet Genomes. 13(1):25. doi: 10.1007/s11295-017-1103-6
- Critchfield WB. 1980. The genetics of lodgepole pine. Washington (DC): USDA Forest Service. Res. Pap. WO-37; 57 p.
- Danell Ö, Eriksson T, Rosvall O. 1993. Currently suggested plans for long-term breeding of lodgepole pine and other conifers in Sweden. In: Lindgren D, editor. Pinus contorta – from untamed forest to domesticated crop. Proceedings of a meeting with IUFRO WP 2.02.06 and Frans Kempe Symposium. 1992 Aug 24–28; Department of Forest Genetics and Plant Physiology, Swedish University of Agricultural Sciences. Report 11; p. 271–278.
- Elfving B, Ericsson T, Rosvall O. 2001. The introduction of lodgepole pine for wood production in Sweden – a review. For Ecol Manage. 141(1–2):15–29. doi: 10.1016/S0378-1127(00)00485-0
- Elfving B, Norgren O. 1993. Volume yield superiority of lodgepole pine compared to Scots pine in Sweden. In: Lindgren D, editor. Pinus contorta – from untamed forest to domesticated crop. Proceedings of a meeting with IUFRO WP 2.02.06 and Frans Kempe Symposium; 1992 Aug 24–28; Department of Forest Genetics and Plant Physiology, Swedish University of Agricultural Sciences. Report 11; p. 69–80.
- Ericsson T. 1993. Provenance qualities of the Pinus contorta breeding base in Sweden. Uppsala: SkogForsk ─ Forestry Research Institute of Sweden. Report 4; 33 p.
- Ericsson T. 1994. Lodgepole pine (Pinus contorta var. latifolia) breeding in Sweden – results and prospects based on early evaluations [dissertation]. Umeå: Department of Forest Genetics and Plant Physiology, Swedish University of Agricultural Science; 32 p.
- Ericsson T, Danell Ö, Andersson B. 1994. Genetic variation of Pinus contorta var. latifolia breeding material in Sweden. Can J For Res. 24(4):723–729. doi: 10.1139/x94-096
- Falconer D, Mackay T. 1989. Introduction to quantitative genetics, 4th ed. New York (NY): Longman.
- Fries A. 1986. Volume growth and wood density of plus tree progenies of Pinus contorta in two Swedish field trials. Scand J For Res. 1(1–4):403–419. doi: 10.1080/02827588609382433
- Fries A, Elfving B, Ukrainetz NK. 2017. Growth and survival of lodgepole pine and Scots pine after 25 years in a reciprocal transplant experiment in Canada and Sweden. Scand J For Res. 32(4):287–296. doi: 10.1080/02827581.2016.1221990
- Fries A, Lindgren D. 1986. Performance of plus tree progenies of Pinus contorta originating north of latitude 55° N in a Swedish trial at 64° N. Can J For Res. 16(3):427–437. doi: 10.1139/x86-079
- Gapare WJ, Ivković M, Baltunis BS, Matheson CA, Wu HX. 2010. Genetic stability of wood density and diameter in Pinus radiata D. Don plantation estate across Australia. Tree Genet Genomes. 6(1):113–125. doi: 10.1007/s11295-009-0233-x
- Gilmour AR, Gogel BJ, Cullis BR, Thompson R. 2009. ASReml user guide release 3.0. Hemel Hempstead: VSN International.
- Hagner S. 1971. Cultivation of Pinus contorta in northern Sweden. Swedish For Assoc J. 3:219–246.
- Hagner S. 1993. SCA's provenance experiments with lodgepole pine in north Sweden. In: Lindgren D, editor. Pinus contorta – from untamed forest to domesticated crop. Proceedings of a meeting with IUFRO WP 2.02.06 and Frans Kempe Symposium; 1992 Aug 24–28; Department of Forest Genetics and Plant Physiology, Swedish University of Agricultural Sciences. Report 11; p. 146–161.
- Hagner S, Fahlroth S. 1974. On the prospects of cultivating Pinus contorta in north Sweden. Sveriges Skogsvårdsförbunds Tidskrift. 4:477–528. Swedish with English summary.
- Hallingbäck HR, Jansson G, Hannrup B. 2008. Genetic parameters for grain angle in 28-year-old Norway spruce progeny trials and their parent seed orchard. Ann For Sci. 65(3):1. doi:10.1051/forest:2008005.
- Hansson P, Karlman M. 1997. Survival, height and health status of 20-year-old Pinus sylvestris and Pinus contorta after different scarification treatments in a harsh boreal climate. Scand J For Res. 12(4):340–350. doi: 10.1080/02827589709355421
- Hayatgheibi H, Fries A, Kroon J, Wu H. 2017. Genetic analysis of lodgepole pine (Pinus contorta) solid wood quality traits. Can J For Res. 47(10):1303–1313. doi: 10.1139/cjfr-2017-0152
- Hong Z, Fries A, Wu HX. 2014. High negative genetic correlations between growth traits and wood properties suggest incorporating multiple traits selection including economic weights for the future Scots pine breeding programs. Ann For Sci. 71(4):463–472. doi: 10.1007/s13595-014-0359-3
- Koch P. 1996. Lodgepole pine in North America. Madison (WI): Forest Products Society.
- Lenz P, Auty D, Achim A, Beaulieu J, Mackay J. 2013. Genetic improvement of white spruce mechanical wood traits – early screening by means of acoustic velocity. Forests. 4(3):575–594. doi: 10.3390/f4030575
- Li X, Huber DA, Powell GL, White TL, Peter GF. 2007. Breeding for improved growth and juvenile corewood stiffness in slash pine. Can J For Res. 37(10):1886–1893. doi: 10.1139/X07-043
- Li B, McKeand S. 1989. Stability of loblolly pine families in the southeastern US. Silvae Genet. 38(3/4):96–101.
- Li Y, Suontama M, Burdon RD, Dungey HS. 2017. Genotype by environment interactions in forest tree breeding: review of methodology and perspectives on research and application. Tree Genet Genomes. 13:60. doi:10.1007/s11295-017-1144-x.
- Lindgren K. 1983. Provenances of Pinus contorta in northern Sweden [dissertation]. Umeå; Swedish University of Agricultural Sciences, Department of Forest Genetics and Plant Physiology, 91 p.
- Lindgren D, Lindgren K, Krutzsch P. 1993. Use of lodgepole pine and its provenances in Sweden. In: Lindgren D, editor. 1993. Pinus contorta – from untamed forest to domesticated crop. Proceedings of a meeting with IUFRO WP 2.02.06 and Frans Kempe Symposium; 1992 Aug 24–28; Department of Forest Genetics and Plant Physiology, Swedish University of Agricultural Sciences. Report 11; p. 238–263.
- Lindgren D, Ying CC, Elfving B, Lindgren K. 1994. Site index variation with latitude and altitude in IUFRO Pinus contorta provenance experiments in western Canada and northern Sweden. Scand J For Res. 9(1–4):270–274. doi: 10.1080/02827589409382840
- Lynch M, Walsh B. 1998. Genetics and analysis of quantitative traits. Sunderland (MA): Sinauer Associates.
- Nakagawa S, Schielzeth H. 2010. Repeatability for Gaussian and non-Gaussian data: a practical guide for biologists. Biol Rev. 85(4):935–956.
- Namkoong G, Kang HC, Brouard JS. 2012. Tree breeding: principles and strategies: principles and strategies. New York (NY): Springer-Verlag.
- Norgren O. 1996. Growth analysis of Scots pine and lodgepole pine seedlings. For Ecol Manag. 86(1–3):15–26. doi: 10.1016/S0378-1127(96)03800-5
- Rehfeldt GE. 1988. Ecological genetics of Pinus contorta from the Rocky Mountains (USA): a synthesis. Silvae Genet. 37(3–4):131–135.
- Rehfeldt GE, Crookston NL, Warwell MV, Evans JS. 2006. Empirical analyses of plant–climate relationships for the western United States. Int J Plant Sci. 167(6):1123–1150. doi: 10.1086/507711
- Rosvall O. 1994. Stability in lodgepole pine and resistance to wind and snow loads. Redogörelse nr 2 1994, SkogForsk – Forestry Research Institute of Sweden, Uppsala; 47 p. Summary in English.
- Silva GAP, Gezan SA, de Carvalho MP, Gouvêa LRL, Verardi CK, de Oliveira ALB, de Souza Gonçalves P. 2014. Genetic parameters in a rubber tree population: heritabilities, genotype-by-environment interactions and multi-trait correlations. Tree Genet Genomes. 10(6):1511–1518. doi: 10.1007/s11295-014-0766-5
- Sokal R, Rohlf F. 1995. Biometry, 3rd ed. New York (NY): Freeman and company; 887 p.
- Wang T, Hamann A, Yanchuk A, O'Neill G, Aitken S. 2006. Use of response functions in selecting lodgepole pine populations for future climates. Glob Change Biol. 12:2404–2416. doi: 10.1111/j.1365-2486.2006.01271.x
- Wang T, O'Neill GA, Aitken SN. 2010. Integrating environmental and genetic effects to predict responses of tree populations to climate. Ecol Appl. 20(1):153–163. doi: 10.1890/08-2257.1
- Wang X, Ross RJ, Carter P. 2007. Acoustic evaluation of wood quality in standing trees. Part I. Acoustic wave behavior. Wood Fiber Sci. 39(1):28–38.
- Wang XP, Ross RJ, McClellan M, Barbour RJ, Erickson JR, Forsman JW, McGinnis GD. 2001. Nondestructive evaluation of standing trees with a stress wave method. Wood Fiber Sci. 33(4):522–533.
- White TL, Adams WT, Neale DB. 2007. Forest genetics. Wallingford (CT): CABI publishing, CAB International.
- White T, Hodge G, Powell G. 1993. An advanced-generation tree improvement plan for slash pine in the southeastern United States. Silvae Genetic. 42(6):359–370.
- Wu HX, Eldridge KG, Matheson AC, Powell MP, McRae TA, Butcher TB, Johnson IG. 2007. Achievement in forest tree improvement in Australia and New Zealand: 8. Successful introduction and breeding of radiata pine to Australia. Aust For. 70(4):215–225. doi: 10.1080/00049158.2007.10675023
- Wu HX, Ivkovic M, Gapare WJ, Matheson A, Baltunis B, Powell M, McRae T. 2008. Breeding for wood quality and profit in Pinus radiata: a review of genetic parameter estimates and implications for breeding and deployment. New Zeal J For Sci. 38(1):56–87.
- Wu HX, Matheson AC. 2005. Genotype by environment interactions in an Australia-wide radiata pine diallel mating experiment: implications for regionalized breeding. For Sci. 51(1):29–40.
- Wu HX, Ying CC. 2004. Geographic patterns of local optimality in natural populations of lodgepole pine. For Ecol Manage. 194(1–3):177–198. doi: 10.1016/j.foreco.2004.02.017
- Xiong JS, Isik F, McKeand SE, Whetten RW. 2010. Genetic variation of stem forking in loblolly pine. For Sci. 56(5):429–436.
- Ying CC. 1991. Performance of lodgepole pine provenances at sites in southwestern British Columbia. Silvae Genet. 40(5–6):215–223.
- Ying CC, Illingworth K, Carlson M. 1985. Geographic variation in lodgepole pine and its implications for tree improvement in British Columbia. In: Baumgartner DM, editor. Proceedings of the Lodgepole Pine – the Species and its Management Symposium; 8–16 May 1984, Spokane (WA)/Vancouver: Washington State University/Pullman; p. 43–53.
- Zobel BJ, Jett JB. 1995. Genetics of wood production. Heidelberg: Springer-Verlag.