
Abstract
Purpose: To investigate the dosimetric effect of variable gas volume in esophageal cancer radiation therapy (RT) and whether a density override (DO) in treatment planning can effectively mitigate this dosimetric effect.
Material and methods: Nine patients with gastrointestinal gas pockets in the planning computed tomography (pCT) were retrospectively included. Per patient, the intensity-modulated RT (IMRT) and volumetric-modulated arc therapy (VMAT) plans associated with no DO, DO = 0.5, and DO = 1 in the gas pockets were made. Initial and follow-up gas volumes were assessed from the pCTs and cone-beam CTs (CBCTs), respectively. Fractional CTs were created based on the pCT and CBCTs to calculate the fractional doses using all six plans. We then investigated for all six plans the correlation between the gas volume difference (relative to initial gas volume) and the dose difference (relative to planned dose). We also calculated and compared the accumulated dose by summing the fractional doses using two strategies: single-plan strategy (i.e. using each of the six plans separately) and plan-selection strategy (i.e. selecting one of the three plans depending on the fractional gas volume for IMRT and VMAT planning separately).
Results: The dose difference was approximately linearly correlated to the gas volume difference. Underdoses of >3.5% and overdoses of >7% were found for gas volume decreases >160 mL/330 mL and increases >260 mL/370 mL for IMRT/VMAT planning, respectively. Moreover, for most patients, the single-plan strategy with the use of DO = 0.5 resulted in neither undesired underdose nor much overdose. The plan-selection strategy, however, can always ensure sufficient target coverage and minimize high dose regions to the most extent.
Conclusions: The variation in gas volume during the treatment course can result in clinically undesired underdose or overdose. The DO-based plan-selection strategy can effectively mitigate the gas-induced underdose and minimize the overdose for esophageal cancer RT.
Introduction
Radiation therapy (RT) has become one of the primary treatment modalities for esophageal cancer [Citation1]. For the modern high-precision conformal dose delivery techniques such as intensity-modulated RT (IMRT) and volumetric-modulated arc therapy (VMAT), a robust treatment planning is required to avoid underdose or overdose due to anatomical uncertainties during the treatment. Using daily cone-beam computed tomography (CBCT) prior to dose delivery allows one to monitor anatomical changes and to perform setup verification [Citation2–6]. Because marker-based and soft-tissue-based registration for esophageal tumors was found to be challenging and clinically not reliable, bony anatomy – mostly the vertebrae – is usually used as the surrogate for setup verification in esophageal cancer RT [Citation6]. Therefore, residual positional and anatomical variations with respect to bony anatomy should be integrated into the planning target volume (PTV) margin.
In about 80% of the cases, the primary esophageal tumor is located in the distal esophagus or at the gastroesophageal junction [Citation1]. Further, the clinical target volume (CTV) consists of a 30–50 mm extension of the gross tumor volume (GTV) in the cranial-caudal (CC) direction [Citation7]. Consequently, the proximal abdomen is inevitably irradiated. If a large gastrointestinal gas pocket appears during the treatment course, it can influence the distribution of the delivered dose to a certain extent because of the difference in electron density between gas and tissue. Our previous investigations showed that the interfractional variability of the volume of gastrointestinal gas pockets can be substantial [Citation8]. According to the literature, none of the gas-induced dosimetric changes, however, could be mitigated by using adaptive procedures, including proper margin prescription, daily soft-tissue-based setup verification, or re-planning at the median fraction [Citation9].
There were only a few studies on the dosimetric effect induced by gas changes and its mitigation approach in RT of upper and middle gastrointestinal cancers [Citation10–13]. For esophageal cancer, the focus was on dosimetric impact of gastric filling [Citation14,Citation15]. The presence of gas pockets was mostly investigated for pelvic tumors [Citation16–18]. A water-equivalent density override (DO) in the rectal cavity in the planning CT was found to be able to mitigate the gas-induced dosimetric effect [Citation16]. This was a simple and sound approach that can be realized in most treatment planning systems. Therefore, when gastrointestinal gas pockets were observed in the esophageal cancer patients in our clinic, we applied a similar water equivalent DO in the treatment planning. However, it was not clear whether this is a robust approach in esophageal cancer RT, especially when the volume of the gas pockets varies substantially. Accordingly, the present study was performed to investigate for esophageal cancer RT the dosimetric effect induced by the gastrointestinal gas pockets and whether a DO in the treatment planning can effectively mitigate this effect. Moreover, in terms of the accumulated dose parameters, we compared a plan-selection strategy and a single-plan strategy, where both were based on the DO using different relative mass density (RMD) values.
Material and methods
Patient cohort and imaging
We retrospectively included nine patients (age: 55–77) who were diagnosed with tumor at least in the distal esophagus and underwent RT in our clinic. Noticeable gastrointestinal gas pockets in the planning CT (pCT) were observed in these patients and a water equivalent DO of the gas pocket was used. These nine patients were selected out of 125 contemporaneous patients because the observed gastrointestinal gas volume fluctuated over the first several treatment fractions and it was discussed whether a re-planning was needed in our clinical practice. No instructions about food and fluid intake were given to any patients prior to pCT acquisition or dose delivery.
For each patient, a 3D pCT was acquired using a 16-slice CT scanner (LightSpeed RT 16, General Electric, Waukesha, WI). During the pCT acquisition and the whole treatment course, all patients were in head-first supine position using an arm and knee support (CIVCO Medical Solution, Coralville, IA) and freely breathing without any coaching or training. No extra immobilization devices were used. The longitudinal field of view of the pCT was between the bottom edge of the mandible and the lower border of the kidneys.
For patient setup verification and anatomical change inspection during the whole treatment course, 8–28 CBCT scans per patient (in total 139 CBCTs for all nine patients) were acquired using the X-ray Volume Imaging (XVI) system (version 4.5, Elekta AB, Stockholm, Sweden) according to the applied setup correction protocol: extended no action level [Citation19] or online protocol. The PTV was always inside the imaging field of view. lists the patient information with more details.
Table 1. Patient overview and relevant information.
Target volume and organs at risk delineation
The GTV was delineated on the pCT scan by the radiation oncologists according to all the available diagnostic information including physical examination, diagnostic CT scans, endoscopy, and/or endoscopic ultrasound. The CTV was generated by extending the GTV in the CC direction with a 35 mm margin above the cardia or 20 mm margin in the cardia and peripherally with covering the associated lymph nodes, i.e., para-esophageal fatty tissue. Subsequently, a 10 mm isotropic margin was added to create the PTV. The organs at risk (OARs), including the lungs, heart, spinal cord, liver and kidneys, were delineated by the radiation therapists. Further, the gastrointestinal gas pockets located in the transverse planes of the pCT where the PTV was present were semi-automatically delineated at window-level 40 Hounsfield Units (HU) and window-width 350HU (Velocity 3.2.0, Varian Medical Systems, Palo Alto, CA). This initial gas volume is hereafter denoted as Vinitial. After registering the pCT with CBCTs on bony anatomy, the gastrointestinal gas pockets located in the transverse planes of each CBCT where the PTV was present were also delineated by thresholding at a gray value of −525 (Velocity). The delineations of all gas pockets were visually inspected to ensure no overlap with the CTV and OARs.
Treatment planning and plan library
The dose prescription was set to 1.8Gy per fraction: six patients received neoadjuvant treatment with 41.4Gy in 23 fractions and three had definitive treatment with 50.4Gy in 28 fractions (). Retrospectively, for each patient, two dose delivery techniques were used in the treatment plans: (1) 6-MV 7-beam IMRT (beam angle: 0°, 40°, 80°, 160°, 200°, 280° and 320°); and (2) 6-MV single-arc VMAT (arc length: 356°) using Oncentra External Beam (version 4.5, Elekta AB, Stockholm, Sweden). For each dose delivery technique, three plans were made to construct a plan library: using no DO, setting the RMD in the gas pockets to 0.5 (relative to water), and setting the RMD to 1 (hereafter denoted as no DO, DO = 0.5, and DO = 1, respectively). The use of a DO can simulate a different Vinitial and DO = 1 was designed to simulate an extreme scenario, i.e., Vinitial = 0 mL. All of the six treatment plans for each patient were individually optimized by an experienced radiation therapist. Per patient, six planned doses corresponding to the six plans were calculated using the collapsed cone algorithm (Supplementary Figure A1). The same planning objectives and dose-volume histogram (DVH) criteria were used for all six plans (Supplementary Table A1), resulting in similar planned doses.
Plan-selection and single-plan strategies
A plan-selection strategy was designed for adaptive RT. This was done for IMRT and VMAT planning separately. For each treatment fraction, one treatment plan was selected from the plan library (i.e., three IMRT/VMAT plans) depending on the initial gas volume, Vinitial, and the gas volume in this treatment fraction, Vfraction. In this study, we selected the plan with
no DO when Vfraction ≥ 0.75Vinitial;
DO = 0.5 when 0.25Vinitial < Vfraction < 0.75Vinitial;
DO = 1 when Vfraction ≤ 0.25Vinitial.
For comparison, a single-plan strategy, i.e., using only each of the six plans (three IMRT plans, three VMAT plans) for the whole treatment course, was also evaluated.
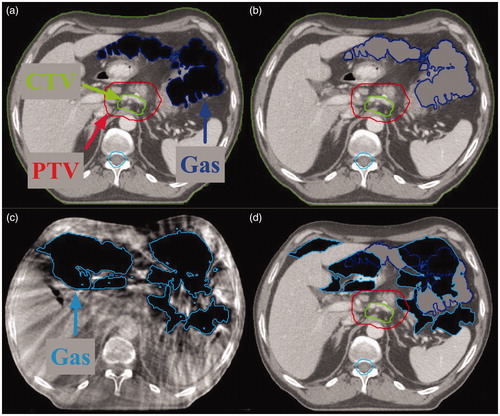
Since this study focused solely on the dosimetric effect of variable gas volumes and does not include potential variations in dose caused by other anatomical variations, we created fractional CTs (fCTs) instead of solely using CBCTs to calculate the fractional doses. The fCTs were identical to the pCTs except that the initial gas pockets were replaced by the gas pockets in the CBCTs (). We ensured that these gas pockets from CBCTs had no overlap with the CTV in the fCT. The fractional doses were calculated for all six plans by applying each of them to the fCTs (Supplementary Figure A1). In total, 834 fractional doses were calculated.
Figure 1. Example of the procedure how a fractional computed tomography (fCT) was made. (a) The original planning CT (pCT) with gas pocket delineations. (b) The gas pockets in the pCT were filled with soft-tissue density. (c) One cone-beam CT (CBCT) with gas pocket delineations. (d) Gas pockets in the CBCT were overlaid on the pCT with filled gas pockets in (b), yielding the fCT. CTV: clinical target volume; PTV: planning target volume.
The accumulated dose was calculated by rigid summation of the fractional doses in the 3D space. For the treatment fractions with no CBCT acquisition, resulting in no fCT, the fractional dose associated with the most recently created fCT in a previous fraction was used. Per patient, the accumulated dose was calculated using both plan-selection strategy and single-plan strategy, resulting in two plan-selection-based accumulated doses and six single-plan-based accumulated doses (Supplementary Figure A1).
Evaluation
Per patient, the mean gas volume and the standard deviation (SD) of gas volumes over the treatment course were calculated. Additionally, the linear mixed-effects model was used for evaluating the overall time trend of the gas volume [Citation20]. All statistical analyses in this study were done using R software (Version 3.3.2; Vienna, Austria) [Citation21].
Because in the pCTs and fCTs most PTVs contained parts of the gas pockets, which are not the actual target and have low RMDs, evaluating the DVH parameters in the PTV can underestimate the dose to the target. Instead, we chose to evaluate the DVH parameters in the CTV for target dose representation.
For the CTV, the minimum (the 5th percentile) and maximum (the 95th percentile) dose differences between the fractional dose and the planned dose per fraction were evaluated because the cold and hot spots are important. To investigate the gas-induced dosimetric effect, the minimum and maximum dose differences for IMRT and VMAT planning with no DO were assessed as a function of the difference between the fractional gas volume and the initial gas volume using the linear mixed-effects model. We chose −3.5% and 7% as the criteria for evaluating the minimum and maximum dose differences, respectively. The reason is that the range of applied dose in the preoperative setting is generally 40–45Gy. An increased risk of regional recurrence was shown with a total dose below 40Gy and increased toxicity was shown above 55Gy [Citation22,Citation23]. According to our preoperative setting (dose of 41.4Gy) it is clinically more critical to prevent an underdose than an overdose and the acceptable underdose is therefore aimed to be <3.5% (≍1.4Gy). An overdose is generally preferred to be <7% [Citation24], which is clinically more relevant in the definitive setting where a higher dose (50–64Gy) is applied.
Further, we investigated the relationship in the dose differences between no DO, on the one hand, and DO = 0.5 and DO = 1, on the other hand. This was only done for the minimum dose differences with the decreased-gas-volume scenario, because the DO with the RMD value > 0 is only used to compensate for a potential underdose in the case of a decreased gas volume.
For the CTV and OARs, the DVH parameters of single-plan-based accumulated doses were calculated and compared between the three DO settings for the same plan type (IMRT or VMAT) and between the IMRT and VMAT plans for the same DO setting. The DVH parameters of plan-selection-based accumulated doses were also calculated and compared with the single-plan-based accumulated doses using the same plan type. The constraints for evaluating these DVH parameters are listed in Supplementary Table A1. In addition, the isodose lines for both strategies were visually checked. Statistically, these parameters were compared using the Wilcoxon signed-rank test with significance level at 0.05.
Results
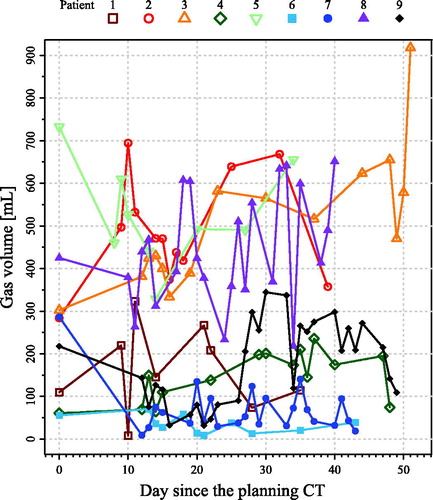
By visually overlaying all the gas pocket delineations, the position of the gas pockets was observed to be stable over time. depicts the gas volume over the treatment course for all nine patients. The mean and SD of the gas volumes over the treatment course per patient are listed in . For all nine patients, the mean ± SD of the slope of the gas volume against time was 2.96 ± 2.24 mL/day (p = .03), suggesting that the gas volume was slightly increasing in these investigated patients.
Figure 2. Gas volume for all nine patients over the whole treatment course. Day 0 denotes the day that the planning computed tomography (CT) scan was acquired.
When the gas volume decreased relative to Vinitial (n = 71 fractions), the minimum dose difference in the CTV decreased approximately linearly for both IMRT and VMAT planning with no DO (, marginal and conditional R2 ≥ 0.33). For a minimum dose difference of > −3.5% (i.e., acceptable underdose), the decrease of gas volume was approximately <160 mL (IMRT) and <330 mL (VMAT) on average; <70 mL (IMRT) and 230 mL (VMAT) with a 95% confidence ().
Figure 3. The minimum and maximum dose differences in the clinical target volume (CTV) between the fractional doses and the planned doses per fraction against the gas volume difference relative to the initial gas volume for both intensity-modulated radiation therapy (IMRT) and volumetric-modulated arc therapy (VMAT) plans with no density override (DO). The fitting line and its 95% confidence interval are denoted as black solid line and dotted lines around it, respectively. The marginal and conditional R2, the slopes, and the intercepts derived from the linear mixed-effects model are also given.
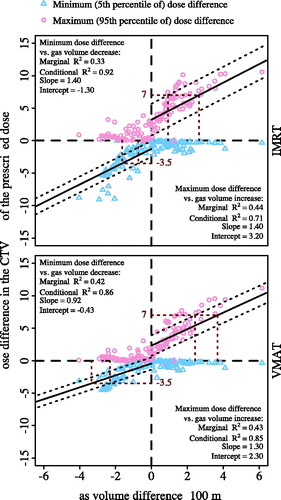
When the gas volume increased (n = 68 fractions), the maximum dose difference in the CTV increased approximately linearly (, marginal and conditional R2 ≥ 0.43). For a maximum dose difference of <7% (i.e., acceptable overdose), the gas volume increase was approximately <260 mL (IMRT) and <370 mL (VMAT) on average; <90 mL (IMRT) and <240 mL (VMAT) with a 95% confidence (). The minimum dose differences for the increased-gas-volume case and the maximum dose differences for the decreased-gas-volume case were both close to 0%.
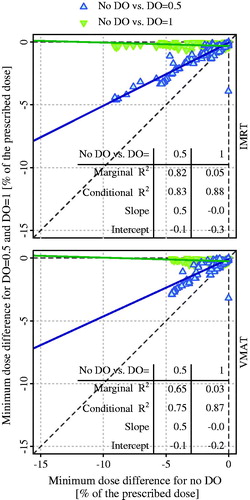
Two examples of the dose difference between the fractional dose and planned dose are shown in Supplementary Figure A2. For patient 3 with an increased gas volume at fraction 28, an overdose of >10% in the CTV/PTV was observed using all six plans and the smallest region of overdose was obtained when no DO was used. For patient 5 with a decreased gas volume at fraction 5, an underdose of >5% in the CTV/PTV was observed when no DO was used but an overdose of >5% in the CTV/PTV was observed when DO = 1 was used. The minimum dose differences (n = 71 fractions) associated with using DO = 1 were close to 0% and independent to those associated with using no DO (, marginal R2≤0.05). However, the minimum dose differences using the plan with DO = 0.5 were approximately half of those using the plan with no DO; there was a strong correlation between them (marginal and conditional R2 ≥ 0.65).
Figure 4. Relationship of the minimum dose differences between no density override (DO) and DO = 0.5 and between no DO and DO = 1, for intensity modulated radiation therapy (IMRT) and volumetric-modulated arc therapy (VMAT) planning, in the fractions with decreased gas volume relative to initial gas volume. The solid line denotes the fitting line. The marginal and conditional R2, the slopes, and the intercepts derived from the linear mixed-effects model are also given.
Supplementary Figure A3 shows the accumulated dose distributions for both single-plan and plan-selection strategies. For the single-plan-based accumulated dose, V95% of the CTV was only <98% for patient 5 using IMRT planning with no DO (V95% = 94.2%, ). For patient 7 using IMRT planning with no DO, although the V95% of the CTV was 99.1%, the 95% isodose line cannot sufficiently cover the sub-volume of the PTV not containing gas pockets (Supplementary Figure A3). Significantly higher values for D2% of the CTV were found for IMRT and VMAT plans with DO = 1 than for those with no DO and DO = 0.5 (p < .05, ). Moreover, D2% of the CTV was significantly smaller for VMAT than for IMRT planning with DO = 0.5 and DO = 1 (p < .05).
Table 2. V95% and D2% of planned dose and accumulated dose in the clinical target volume.
For the plan-selection strategy, the total number of times each plan was selected during the treatment course is summarized in . For the plan-selection-based accumulated dose, V95% of the CTV was always >99% for both IMRT and VMAT planning. Further, D2% of the CTV was similar to those obtained for the single-plan-based accumulated dose calculated using IMRT and VMAT planning with no DO, which were significantly smaller than those using IMRT and VMAT planning with DO = 0.5 and DO = 1 (p < .05, ). The mean difference in D2% between the plan-selection-based and DO = 0.5-based accumulated doses was 1.0Gy and 0.6Gy for IMRT and VMAT planning, respectively; this mean difference between the plan-selection-based and DO = 1-based accumulated doses was 3.4Gy and 2.5Gy for IMRT and VMAT planning, respectively.
For the OARs, there was no significant difference in DVH parameters between the planned dose, single-plan-based accumulated dose, and plan-selection-based accumulated dose. They were also all clinically acceptable according to the criteria in Supplementary . Therefore, the gastrointestinal gas volume had no clinically relevant dosimetric effect on the OARs.
Discussion
To our knowledge, this study is the first to quantify the gastrointestinal gas-induced dosimetric effect and to apply DO in treatment planning for mitigating this dosimetric effect for esophageal cancer RT. A plan-selection strategy and a single-plan strategy were presented and compared in terms of accumulated dose. The dose difference between the fractional and planned dose was highly correlated with the gas volume difference for all nine investigated patients. Further, the use of DO in treatment planning showed the capacity of mitigating the gas-induced underdose in the target, of which the mitigation performance was highly dependent on the RMD value in the DO. Moreover, for all nine patients, the use of a single plan with DO = 0.5 showed its robustness against a gas-induced underdose in the accumulated dose. However, with some additional workload, the plan-selection strategy can ensure sufficient CTV coverage and minimize high dose regions to the most extent, by avoiding undesired underdose and overdose in each treatment fraction, respectively.
For pancreatic cancer, the variable gas volume can highly affect the target coverage in proton or carbon-ion therapy and the beam angle should be optimized [Citation10,Citation11,Citation13]. For (photon) RT, the use of intratumoral markers as the surrogate of the pancreatic tumor in setup verification was found robust against the anatomical changes and gastrointestinal gas [Citation12]. Although bony anatomy-based setup verification was used in the present study, no interfractional tumor position variation was simulated. In this case, an underdose or overdose induced by gastrointestinal gas pockets was still observed in both fractional and accumulated doses in esophageal cancer RT. Based on our results, this can be explained by the much smaller gas volumes in those pancreatic patients than the gas volumes found in the esophageal cancer patients.
Only a couple of studies investigated the dosimetric impact of gastric volume variation in the RT of esophageal cancer [Citation14,Citation15]. Nevertheless, they both only focused on the gastric filling instead of gas volume and found no dosimetric benefits associated with the gastric filling irrespective of the instructions on food and fluid intake. One study further showed the presence of gas pockets in the stomach even when a gastric filling instruction was applied [Citation15]. Therefore, a food and fluid intake instruction might not be an effective solution for removing the gas pockets.
In spite of the statistically significant increase of the trend in the gas volume over the nine patients, this was only 2.96 mL/day on average. Considering the large SD in the gas volume over time (20–162 mL), this slight time trend in the gas volume variation was neglectable. According to , the gas volume differed enormously among patients and it can fluctuate considerably over time. It was not clear why some of those nine patients had excessive gas volume over the treatment course. Therefore, it is difficult to predict the gas volume over the treatment course. Furthermore, a previous study applied an adaptive procedure to mitigate the anatomical changes, where the interfractional tumor displacement and shape changes were all considered using deformable image registration (DIR) between the pCT and CBCT [Citation9]. However, it showed that the gas-induced dosimetric effect cannot be mitigated by using safety margins and re-planning at the median fraction. For prostate cancer photon and proton therapy, the rectal gas cavities present in the pCT also resulted in degradation of the dose distribution in the treatment fractions; however, using a DO in the gas cavities in treatment planning was found to be able to overcome this problem [Citation16]. This provides indication of our using DO in the gas pocket for esophageal cancer.
Based on , it can be generalized that for using DO = d, where d is the RMD value and d ∈ [0, 1], the minimum dose difference is approximately 1−d times the minimum dose difference when no DO is used. According to and , the use of DO = d is equivalent to reducing the initial gas volume, Vinitial, by d × Vinitial, i.e., for planning with DO = d the reduced initial gas volume is (1−d) × Vinitial. Therefore, if we evaluate the relationship between the gas volume difference and dose difference for planning with DO, the relationship will be the same as is shown in with more occurrences of the increased gas volume scenario but less occurrences of the decreased gas volume scenario, i.e., more points on the right-hand side and less points on the left-hand side in .
If Vinitial < 160 mL for IMRT or Vinitial < 330 mL for VMAT, using a DO in the treatment planning to avoid an underdose is probably not necessary. This is because a decreased gas volume is unlikely to induce an underdose >3.5%, of which the chance is even smaller than 5% if Vinitial < 70 mL for IMRT or Vinitial < 230 mL for VMAT. For example, for patients 4 and 6, one plan with no DO could be sufficient because no clinically relevant dose difference was found between the single-plan and plan-selection strategy (Supplementary Figure A3 and ). Our findings indicate that if Vinitial ≥ 160 mL for IMRT or Vinitial ≥ 330 mL for VMAT, one or more plans with DO could be needed to avoid an unacceptable underdose and overdose. Although we used both DO = 0.5 and DO = 1 in the present study, one is free to choose other RMD values, e.g., DO = 0.3, to make the plan library, depending on the Vinitial. Since the DO = 1 was designed to simulate the extreme scenario, it is not necessary to be clinically applied. In addition, an increase of >260 mL for IMRT and >370 mL for VMAT in the gas volume during the treatment course should be alerted for avoiding an overdose of >7%. It is recommended to make a new treatment plan to be added to the plan library especially when, for instance, the gas volume has a continuous increase of >370 mL for more than three consecutive treatment fractions.
For most of the investigated patients, a plan-selection strategy performs only slightly better than a single-plan strategy in terms of V95% and D2% of the accumulated dose in CTV (i.e., CTV coverage and near-maximum dose to the CTV). This might result from the averaging effect in the single-plan strategy, which was caused by the fluctuation of the gas volume over the treatment course. However, the plan-selection strategy is superior in less risk of an underdose or overdose due to a possibly increased or decreased overall gas volume, despite of the fluctuation in gas volume with no time trend for most of the investigated patients. The single-plan strategy associated with DO = 0.5 or DO = 1, despite of no underdose, always resulted in an overdose. This was evident particularly for patients with considerably increased overall gas volume over the whole treatment course compared to that at treatment planning, such as patients 2 and 3. When no DO was used, acceptable CTV coverage and near-maximum dose were observed, except for patient 5, in whom the gas volume was evidently decreased (from 732 mL to 501 mL) during the treatment course compared to that at the treatment planning. Since the gas volume is not predictable, the use of a plan-selection strategy can both ensure the CTV coverage and minimize the overdose to the most extent.
One concern of implementing the plan-selection strategy is that it can add extra workload in the treatment room. Automatic delineation of the gas pockets to accurately calculate the gas volume is, to our knowledge, not yet available in the CBCT matching software in the treatment room (e.g., XVI system). Transferring the acquired CBCT to the treatment planning system or other imaging informatic systems (e.g., Velocity) for gas volume calculation will likely increase the time between the CBCT acquisition and the start of the treatment fraction. Therefore, every clinic should decide if the extra workload will be worth the expected clinical gain. If the overdose in the CTV for a few fractions is not a concern and the additional workload is not preferred, a single-plan strategy is robust in mitigating the gas-induced underdose. Based on the investigated patient data, the VMAT planning was less sensitive to the gas volume changes than the IMRT planning. For patients with Vinitial < 230 mL, a VMAT plan with no DO could be sufficient to ensure no underdose > 3.5% with 95% confidence; for patients with Vinitial ≥ 230 mL, a VMAT plan with DO = 0.5 seems to be sufficient. Alternatively, a different beam setup for IMRT planning or a different arc setting for VMAT planning, i.e., avoiding the stomach and bowel in the beam path, may be a solution. However, this will inevitably increase the dose to more critical OARs such as the liver and kidneys.
The primary limitation of this study lies in the small patient cohort. However, the occurrence rate of patients having considerable variation in gastrointestinal gas volume was quite low. Over the 125 contemporary patients treated within one and a half years, only nine patients were selected because of the clinical concerns of the gas pockets. Despite of the small cohort, we believe that these nine patients can be representative for most patients, since they had increased, decreased, or relatively stable gas volumes. Moreover, 139 fractions representing different gas volume changes in patients were used to derive the relationship between the gas volume changes and dose difference. These data seem sufficient in yielding our clinical implications on the deployment of DO in treatment planning.
Another limitation is that no other anatomical changes over the treatment course such as target displacement than changes of gastrointestinal gas pockets were considered in this study. Because of the limited soft-tissue contrast in the CBCT and no fiducial markers implanted in the target, it was difficult to delineate the CTV on the CBCT. However, the similar mass densities in most soft tissues imply that the internal anatomical changes such as target displacement and shape variation may not degrade the dose distribution in the body. As a result, the use of safety margins can compensate for these anatomical changes as demonstrated in the previous study [Citation9]. Since the use of safety margins did not show its effectiveness in mitigating the gas-induced dosimetric uncertainty [Citation9], inclusion of other anatomical changes such as target displacement in the present study seems redundant. Hence, it was plausible to focus this study on the changes of gastrointestinal gas pockets.
Six of the nine patients had no daily CBCT scans, leading to the use of the most recently created fCT for the days without CBCTs. An alternative approach is to use the average dose of all the fractional doses calculated based on all the available fCTs as the fractional dose for these days. However, carrying out this approach resulted in subtle and negligible differences in the DVH curves of the accumulated dose compared to the approach used in this study. Therefore, this alternative approach would not have resulted in different conclusions.
Conclusions
For esophageal cancer with distally located tumors, the gastrointestinal gas volume variation during the treatment course can result in a clinically undesired underdose or overdose. The use of DO with appropriate RMD in the gas pockets at treatment planning can effectively mitigate the gas-induced underdose in the target. The plan-selection strategy based on a plan library consisting of multiple DO settings would be ideal for mitigating the gas-induced underdose and minimizing the overdose. When a target overdose in a few fractions is not clinically important, a single VMAT plan could be an efficient and easy solution in clinical practice: when the initial gas volume is <230 mL, no DO would be needed because the gas-induced underdose in the target seems not likely to occur; when the initial gas volume is ≥ 230 mL, using a VMAT plan with DO = 0.5 is preferred to avoid an underdose. For both plan-selection and single-plan strategies, when a large gas volume increase is continuously present, re-planning might be needed to prevent a continuous overdose in the target.
Supplemental Material
Download PDF (19.1 MB)Acknowledgments
The authors thank Mr. Martijn Kamphuis (Department of Radiation Oncology, Academic Medical Center, the Netherlands) for the pilot investigation.
Disclosure statement
Both Dr. T. Alderliesten and Dr. A. Bel are involved in projects supported by Elekta. Elekta was not involved in the study design, data collection, analysis and interpretation, and writing of the manuscript. The preliminary results of this work have been presented in ESTRO 36, Vienna, Austria.
Additional information
Funding
References
- van Hagen P, Hulshof MCCM, van Lanschot JJB, et al. Preoperative chemoradiotherapy for esophageal or junctional cancer. N Engl J Med. 2012;366:2074–2084.
- Hawkins MA, Brooks C, Hansen VN, et al. Cone beam computed tomography-derived adaptive radiotherapy for radical treatment of esophageal cancer. Int J Radiat Oncol Biol Phys. 2010;77:378–383.
- Hawkins MA, Aitken A, Hansen VN, et al. Cone beam CT verification for oesophageal cancer – impact of volume selected for image registration. Acta Oncol. 2011;50:1183–1190.
- Hawkins MA, Aitken A, Hansen VN, et al. Set-up errors in radiotherapy for oesophageal cancers-is electronic portal imaging or conebeam more accurate? Radiother Oncol. 2011;98:249–254.
- Yamashita H, Haga A, Hayakawa Y, et al. Patient setup error and day-to-day esophageal motion error analyzed by cone-beam computed tomography in radiation therapy. Acta Oncol. 2010;49:485–490.
- Jin P, van der Horst A, de Jong R, et al. Marker-based quantification of interfractional tumor position variation and the use of markers for setup verification in radiation therapy for esophageal cancer. Radiother Oncol. 2015;117:412–418.
- Gao X-S, Qiao X, Wu F, et al. Pathological analysis of clinical target volume margin for radiotherapy in patients with esophageal and gastroesophageal junction carcinoma. Int J Radiat Oncol Biol Phys. 2007;67:389–396.
- Kamphuis M, Van Wieringen N, Jin P, et al. PO-1096 Inter-fraction variation of gas volume in the abdominal region during radiotherapy for distal esophageal cancer. Radiother. Oncol. 2015;115:S592–S593.
- Nyeng TB, Nordsmark M, Hoffmann L. Dosimetric evaluation of anatomical changes during treatment to identify criteria for adaptive radiotherapy in oesophageal cancer patients. Acta Oncol. 2015;54:1467–1473.
- Kumagai M, Hara R, Mori S, et al. Impact of intrafractional bowel gas movement on carbon ion beam dose distribution in pancreatic radiotherapy. Int J Radiat Oncol Biol Phys. 2009;73:1276–1281.
- Houweling AC, Fukata K, Kubota Y, et al. The impact of interfractional anatomical changes on the accumulated dose in carbon ion therapy of pancreatic cancer patients. Radiother. Oncol. 2016;119:319–325.
- van der Horst A, Houweling AC, van Tienhoven G, et al. Dosimetric effects of anatomical changes during fractionated photon radiation therapy in pancreatic cancer patients. J Appl Clin Med Phys. 2017;18:142–151.
- Houweling AC, Crama K, Visser J, et al. Comparing the dosimetric impact of interfractional anatomical changes in photon, proton and carbon ion radiotherapy for pancreatic cancer patients. Phys Med Biol. 2017;62:3051–3064.
- Bouchard M, McAleer MF, Starkschall G. Impact of gastric filling on radiation dose delivered to gastroesophageal junction tumors. Int J Radiat Oncol Biol Phys. 2010;77:292–300.
- van de Voorde L, Larue R, Persoon L, et al. The influence of gastric filling instructions on dose delivery in patients with oesophageal cancer: a prospective study. Radiother Oncol. 2015;117:442–447.
- Soukup M, Söhn M, Yan D, et al. Study of robustness of IMPT and IMRT for prostate cancer against organ movement. Int J Radiat Oncol Biol Phys. 2009;75:941–949.
- Sasaki M, Ikushima H, Tominaga M, et al. Dose impact of rectal gas on prostatic IMRT and VMAT. Jpn J Radiol. 2015;33:723–733.
- Berger T, Petersen JBB, Lindegaard JC, et al. Impact of bowel gas and body outline variations on total accumulated dose with intensity-modulated proton therapy in locally advanced cervical cancer patients. Acta Oncol. 2017;56:1472–1478.
- de Boer HCJ, Heijmen BJM. eNAL: an extension of the NAL setup correction protocol for effective use of weekly follow-up measurements. Int J Radiat Oncol Biol Phys. 2007;67:1586–1595.
- Bates D, Mächler M, Bolker B, et al. Fitting linear mixed-effects models using lme4. J Stat Soft. 2015;67:51.
- R Core Team. R: A language and environment for statistical computing Vienna, Austria: The R Foundation for Statistical Computing; 2013.
- Markar S, Gronnier C, Duhamel A, et al. Salvage surgery after chemoradiotherapy in the management of esophageal cancer: is it a viable therapeutic option? J Clin Onol. 2015;33:3866–3873.
- van Daele E, Ceelen W, Boterberg T, et al. Effect of neoadjuvant radiation dose on surgical and oncological outcome in locally advanced esophageal cancer. Acta Chir Belg. 2015;115:8–14.
- International Commission on Radiation Units & Measurements. Prescribing, recording and reporting photon beam threapy (Supplement to ICRU report 50), ICRU Report 62, Bethesda, MD. Bethesda, MD; 1999.