
 ?Mathematical formulae have been encoded as MathML and are displayed in this HTML version using MathJax in order to improve their display. Uncheck the box to turn MathJax off. This feature requires Javascript. Click on a formula to zoom.
Abstract
Background: Dual-energy (DE) diagnostic computed tomography (CT) combines two scans of different photon energy spectra which can provide additional image information as compared to standard CT. We developed a DE material decomposition scan protocol for daily cone-beam CT (CBCT) of head-and-neck patients receiving radiotherapy and tested it in a clinical trial.
Material and methods: Our DE CBCT protocol consisted of an 80 and 140 kVp scan. The material decomposition algorithm split the low and high energy scan into components of two basis materials, aluminum and acrylic. Scans of different thicknesses and overlap of the basis materials were acquired to calibrate the model which decomposed the CBCT projections into thicknesses of aluminum and acrylic on a per-pixel basis. Pseudo monochromatic projections were created from these thicknesses and the known energy dependence of the attenuation coefficient of the basis materials. A frequency selective de-noising method was further applied to the basis material projections. The DE CBCT protocol was tested on seven patients. Two DE images were chosen, one at low (50–60) keV to evaluate soft tissue image quality and one at 150 keV to assess metal artifact reduction as compared to standard CBCT.
Results: The de-noising algorithm reduced noise by 41% and 69% in the 60 and 150 keV images, respectively, compared to images without the de-noising. The low keV image showed an increase in soft tissue contrast-to-noise ratio of 7–43% compared to the standard clinical CBCT for six of the seven patients. The 150 keV DE CBCT image reduced metal artifacts. Enhanced streaking from metal artifacts were observed in some of the DE CBCT images.
Conclusion: Monochromatic DE images from material decomposition can improve soft tissue contrast-to-noise ratio and metal artifact reduction. Improvements are limited, however, and new artifacts were also introduced by the DE algorithm.
Introduction
Daily imaging is used to position the patient before radiotherapy (RT) treatment. The acquired image sets can potentially be used in adaptive treatment strategies [Citation1–4]. Cone-beam computed tomography (CBCT) is a commonly used modality to acquire daily volumetric information about the patient’s anatomy and allows for comparison to the patient’s planning computed tomography (CT). The CBCT image quality, however, is often poor mainly due to a larger scatter contribution [Citation5].
Previous methods to improve the image quality of CBCT scans have included an anti-scatter grid [Citation6], iterative reconstructions [Citation7] and noise suppression and scatter reduction algorithms [Citation8,Citation9]. The dual energy (DE) technique for diagnostic CTs have shown several benefits, including metal artifact reduction and better visualization of different tissues [Citation10–14]. 2D DE radiographs have been investigated in RT treatment, e.g. with the goal of increasing soft tissue contrast [Citation15] or to give better accuracy for marker-less motion tracking with bone suppression [Citation16]. The DE technique has also been tested for CBCT images using phantom scans in a non-clinical setting [Citation17].
A number of pre-processing tools for CBCT reconstruction are most effective when applied in the projection space, before image reconstruction [Citation18]. For example, creating DE images from projection space, as opposed to image space, has been shown to reduce beam hardening effects [Citation19]. Therefore, our aim with this study was to develop a scan protocol for DE CBCT images using a projection-space material decomposition technique for CBCT scans acquired at a clinical RT accelerator. We present the protocol and assess the image quality in terms of soft tissue visibility and impact on metal artifacts on both phantom scans and clinical patient scans.
Material and methods
Material decomposition
X-rays in CBCT imaging have energies roughly in the range of 40–140 kilo electron volt (keV). The attenuation coefficient in this range mainly consists of two components, the photo-electric effect and Compton scattering [Citation20]. These two components, and thus, the attenuation coefficient of an arbitrary material can be approximated by the weighted sum of two basis materials that have well separated attenuation coefficients [Citation21]. The attenuation along a ray of photons with energy E can therefore be written as [Citation17]:
(1)
(1)
where I0 is the initial intensity, I is the measured intensity, µ is the linear attenuation coefficient at an energy E, and xA,B is the thickness of the basis materials A and B, respectively. This becomes a system of two equations with two unknowns, xA and xB when scanning at two different energies (high and low, denoted H and L). This is valid for mono-energetic beams; however, in general the CBCT X-ray source is a spectrum. To generalize to two spectra, H and L, the equation becomes [Citation21]:
(2)
(2)
where SL,H is the fraction of photons per energy interval dE. The solution for basis material thickness, xA and xB, can be approximated through a fit to scans of known amounts of basis material as follows. First, a log-normalisation should be applied to each projection, IE, using an air-only scan (= ln(IAir,E/IE), where
is the log-normalized projection, E is either the high- or low-energy scan and IAir,E is the air-only scan). The normalized projections can then be used in a linear approximate solution to EquationEquation (2)
(2)
(2) on the form:
(3)
(3)
where and
represents the normalized low and high energy projection pixel values and {a, b}n (n = 0-2) are parameters that can be determined by fitting EquationEquation (3)
(3)
(3) to calibration measurements with known thicknesses of basis material, xA,B. EquationEquation (3)
(3)
(3) is inspired from ref [Citation17], but this linear form yielded less artifacts in the current application. These equations describe a material decomposition and can be used to create basis material projections, xA and xB, of an arbitrary object. Monochromatic attenuated projections can be created from xA and xB using the attenuation coefficients [Citation22] of the two basis materials as follows [Citation17]:
(4)
(4)
where E0 is the monochromatic energy (referred to as the reconstruction energy in this paper) of the image and ∫ds is the line integral of the (unknown) attenuation coefficient in a given ray through the object. Acrylic and aluminum was used as the basis materials in this study as they have attenuation coefficients similar to soft tissue and cortical bone, respectively [Citation22], are well separated over the investigated energy interval and are easily obtainable with a high level of purity.
The high- and low-energy scan series were taken in succession and subsequently exported offline for analysis and reconstruction.
Radiation dose and calibration
Dose measurements were carried out in a 16 cm CTDI phantom (RTI group AB, Mölndal, Sweden) using a pencil ion chamber detector (Unfors Raysafe Xi detector) to ensure that the DE scan protocol did not increase the dose delivered to the patient as compared to the standard clinical CBCT imaging. Measuring the dose at central and four peripheral positions (12, 3, 6 and 9 o’clock positions) allowed for a generally accepted dose comparison measurement according to [Citation23]:
(5)
(5)
The dose of the DE protocol was kept equal to the dose of the standard CBCT by adjusting the mAs (Supplementary Table). Other scan parameters were identical to the standard parameters for head scans in our institution. A 1 mm copper plate (Leeds Test Object LTD, North Yorkshire, United Kingdom) filtration was added to the high energy scan to minimize the overlap between the high and low energy photon spectra [Citation24]. The copper filtration was physically mounted on the x-ray housing of the CBCT system on the linear accelerator. Due to the mounting and dismounting of the copper plate, there was approximately two minutes between the low and high energy CBCTs.
Measurements of two step-wedges of acrylic and aluminum were performed for the calibration of the material decomposition (EquationEquation (3)(3)
(3) ). The acrylic step-wedge had seven evenly distributed steps between 4.1 and 28.1 mm and the aluminum step-wedge had five evenly distributed steps between 3.3 and 15.7 mm (Supplementary Figure 1). These were imaged at various overlaps. As the dimensions of the step-wedges were small compared to the dimensions of a patient head and neck (H&N) scan, the step-wedges were also scanned with additional acrylic/aluminum blocks and with the CTDI phantom placed in front (to add the 145mm height of the phantom as additional acrylic thickness). A total of 113 calibration measurements were done for unique combinations of aluminum and acrylic thicknesses, chosen to span the material thickness region of 0 to 193.1 mm acrylic and 0 to 17.7 mm aluminum.
Phantom and patient measurements
A Catphan phantom (The Phantom Laboratory, Salem, NY, USA) was used to test the effect of the DE protocol in terms of contrast and noise amongst the inserts having an x-ray attenuation similar to soft tissues (Polystyrene and the Catphan background of clear epoxy) to evaluate image quality. In this study, contrast and noise was defined as in EquationEquation (6)(6)
(6) , as the numerator and denominator respectively.
The material decomposition algorithm was further tested on seven H&N patients who were scanned using the DE and the standard CBCT head protocol. Local ethical approval was acquired (H-16047987) and patients signed informed consent. The additional DE CBCT scan was taken at one of the patients’ initial treatment fractions and all comparisons were done to the standard CBCT acquired at the same treatment fraction. All CBCT scans were acquired using a clinical x-ray system at a linear accelerator (Truebeam STx OBI, Varian Medical Systems, Palo Alto, CA, USA) where the RT treatment was subsequently delivered. The effect of the de-noising on DE CBCT was tested in patient scans by comparing the contrast-to-noise ratio (CNR) for ROIs drawn in soft tissue structures for a 60 keV DE CBCT with and without the de-noising (Supplementary Figure 2). We defined the CNR as:
(6)
(6)
where Std is the standard deviation of the pixel values of the ROI.
We also compared the CNR in soft tissue structures in patients in the DE CBCT to the standard clinical CBCT. This was done for seven reconstruction energies, 40, 50, 60, 70, 80, 110 and 150 keV. The effect of the DE protocol on metal artifacts was assessed visually using a 150 keV DE CBCT.
De-noising method
After the decomposition, a frequency selective de-noising method was used to improve image quality of the aluminum- and acrylic-only projections (material projections) (Supplementary Figure 3): A Gaussian low-pass filter was applied to the material projections to reduce noise while adding an edge-projection to preserve boundary information in the de-noised material projections. The edge-projection was created using a linearly mixed image of the input 80 and 140 kVp projections according to:
(7)
(7)
where MP is the mixed projection, Px are the 80 and 140 kVp projections and α is a parameter chosen to minimize noise.
By varying α, from 0 to 1 in 100 steps, the noise was minimized in a ROI in a single patient projection. The α corresponding to minimal noise was chosen (α = 0.77) and was used for all other patient and phantom scans. The mixed projection was then used to generate an edge-projection using a high-pass filter. The final denoised projection was then created according to:
(8)
(8)
where LP is the low-pass gaussian filtered material projection, HP is the high-pass filtered mixed projection (edge-projection) and β is a scaling factor. The intensities of the edge projection did not match the intensities of the material projections. Therefore, β was determined to scale the edge projection to the same average intensity as a high-pass filtered raw material projection. This was done for each projection individually. All projections used in this study were reconstructed offline using iTools software (Varian Medical Systems).
Results
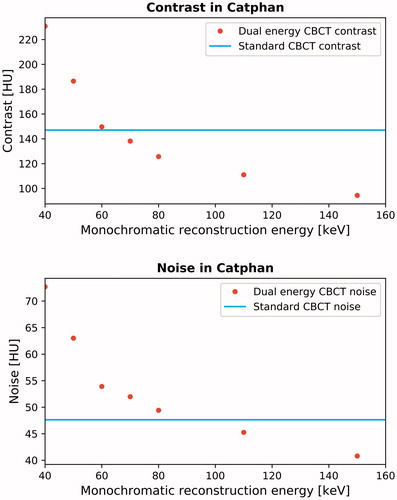
From the comparison between the DE CBCT images and the standard clinical CBCT images of the Catphan phantom, both the contrast and noise were seen to decrease as a function of reconstruction energy ().
Figure 1. Contrast and noise in Catphan phantom for dual energy monochromatic images at 40, 50, 60, 70, 80, 110 and 150 keV. For reference, the standard clinical value is show (horizontal full line).
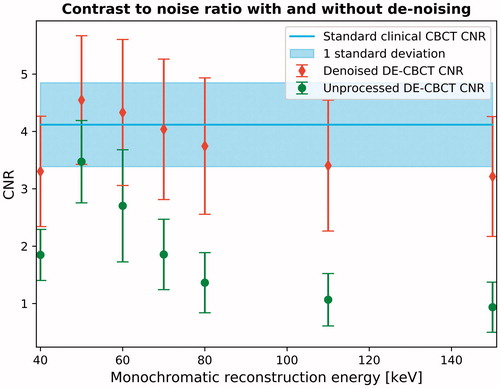
The effect of the de-noising method in patients in the final DE CBCT image was compared to a DE CBCT image without the de-noising (). A general improvement of CNR was observed when using the de-noising method, especially for the higher keV images. The noise was reduced by 41% and 69% in the 60 and 150 keV image, respectfully.
Figure 2. The effect on contrast-to-noise ratio (CNR) when using the de-noising technique on dual energy CBCTs. The red/green points are the mean CNR as a function of reconstruction energy for all patients with/without de-noising. The blue line and shaded area is the average standard CBCT CNR and standard deviation for all patients.
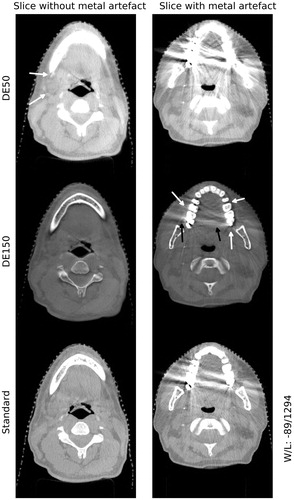
The visual comparison of DE CBCT images of patients at two selected reconstruction energies showed more well-defined soft tissue structures and increased contrast (50 keV image) and a reduction of metal artifacts (150 keV image) when compared to the standard clinical CBCT (). It was seen that the 150 keV image can reduce the size of streaking artifacts as compared to the standard clinical CBCT and reveal soft tissue structures. In general, the boundaries of the teeth and metal were sharper and clearly defined as compared to the standard clinical CBCT, however with a loss of soft tissue contrast. With respect to the 50 keV DE CBCT, the soft tissue contrast was improved.
Figure 3. Example dual-energy images for one patient. The top row: 50 keV dual energy CBCT slices without (left) and with metal artifacts (right). Arrows point to areas with improved soft tissue contrast. Middle row: same as top row for 150 keV image. Arrows indicate reduced metal artifacts (black) and where new soft tissue information is uncovered (white). Bottom row: same as top row for standard clinical CBCT.
In six of the seven patients a CNR increase (7–43%, with a median increase of 19%) was seen in the 50–70 keV reconstruction energy interval and in the remaining one patient the CNR was better in the standard clinical CBCT by 7%.
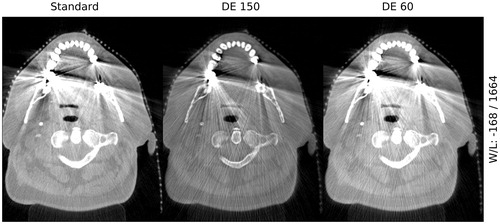
A slice with a metal artifact from the standard clinical CBCT was compared to 60 and 150 keV DE CBCT images (). The DE reconstruction process enhanced or introduced new streak artifacts in some of the patients as compared to the standard clinical CBCT for both the 60 and 150 keV image.
Figure 4. The impact of different reconstruction energies on metal artifacts and new artifacts in the DE images. The streaks in the DE images are seen to originate from the metal in the patient. Left: standard clinical CBCT. Middle: 150 keV DE CBCT. Right: 60 keV DE CBCT.
Discussion
The aim of this study was to develop and investigate the image quality of a DE CBCT protocol, using a material decomposition algorithm, to be used for daily imaging in radiotherapy. We have demonstrated the algorithms ability to create images at various reconstruction energies and presented the image quality of the DE CBCTs for a phantom and seven H&N patients. In terms of soft tissue visibility, the patient results agreed with the phantom measurements and the contrast followed the trend seen in other phantom studies [Citation17,Citation25]. The optimal reconstruction energy was around 50-60 keV since lower keV produced more noise and at higher keV a loss in contrast in soft tissue compared to the standard clinical CBCT ( and ). The value of DE pre-processing was demonstrated (). The frequency selective de-noising increased the CNR in the final DE image.
The material decomposition could result in artifacts which we hypothesize were caused by imperfect alignment (e.g., swallowing or jaw movement) of the 80 kVp and 140 kVp projections (see for enhanced streaking artifacts in the DE image). To correct for this, deformable image registration between the high kVp scan and the low kVp scan could be an option. These artifacts were not observed in the phantom scans.
The Hounsfield units (HU) depend on the photon spectra, and therefore, the window-level setting became an issue in comparing images. A 150 DE CBCT was compared to standard CBCT at two level settings chosen to yield the same magnitude of artifacts to demonstrate that the 150 keV DE CBCT still offers better imaging close to metal artifacts (Supplementary Figure 4).
Patient cases showed the flexibility that DE CBCT can potentially allow for (): The 50 keV DE CBCT was slightly better than the standard CBCT in terms of soft tissue visibility, which has also been shown in other phantom studies [Citation17,Citation26]. A lower contrast was seen in the soft tissue areas in the 150 keV DE CBCT; however, the metal artifact streaks were reduced. It is possible to reconstruct any of these DE CBCTs from the same scan set due to the flexible post-processing. Thus, this flexibility allows for multiple images to meet the clinical needs for each individual patient. This flexibility could further be expected to improve automated propagation of critical contours in a future on-line adaptive workflow. It is also possible that the DE CBCT can improve image registration of other modalities to improve accuracy of the patient setup and treatment, for example by fusion with a PET positive signal on-line. In future generation, with appropriate hardware changes, this benefit could be available at little to no cost in terms of radiation dose, scan time and clinical workload. This could for example be realized by advanced DE acquisition methods, such as dual source scanning [Citation27] or fast kVp switching methods [Citation28]. These were unavailable in the clinical CBCT system at the time of this study.
In conclusion, we have shown slightly improved soft tissue image quality for DE CBCTs reconstructed around 50-60 keV compared to standard clinical CBCT. The DE CBCT can increase soft tissue contrast, which could be relevant in some specialized situations. In terms of metal artifacts, we observed a reduction for the 150 keV DE CBCT image. The challenges of the presented DE protocol could origin from the low-technological sequential implementation and future hardware generations could resolve these issues. In this case, DE CBCT can offer improvements over conventional CBCT albeit it may still only be clinically important in some cases.
Disclosure of interest
No potential conflict of interest has been reported by the authors.
Supplemental Material
Download Zip (5 MB)Additional information
Funding
References
- Nijkamp J, Pos FJ, Nuver TT, et al. Adaptive radiotherapy for prostate cancer using kilovoltage cone-beam computed tomography: first clinical results. Int J Radiat Oncol Biol Phys. 2008;70:75–82.
- Schwartz DL, Garden AS, Shah SJ, et al. Adaptive radiotherapy for head and neck cancer-dosimetric results from a prospective clinical trial. Radiother Oncol. 2013;106:80–84.
- Elstrøm UV, Muren LP, Petersen JBB, et al. Evaluation of image quality for different kV cone-beam CT acquisition and reconstruction methods in the head and neck region. Acta Oncol. 2011;50:908–917.
- Kurz C, Dedes G, Resch A, et al. Comparing cone-beam CT intensity correction methods for dose recalculation in adaptive intensity-modulated photon and proton therapy for head and neck cancer. Acta Oncol. 2015;54:1651–1657.
- Siewerdsen JH, Jaffray DA. Cone-beam computed tomography with a flat-panel imager: magnitude and effects of x-ray scatter. Med Phys. 2001;28:220–231.
- Stankovic U, Van Herk M, Ploeger LS, et al. Improved image quality of cone beam CT scans for radiotherapy image guidance using fiber-interspaced antiscatter grid. Med Phys. 2014;41:061910.
- Wang J, Li T, Xing L. SU‐FF‐I‐44: Iterative image reconstruction for CBCT using edge‐preserving prior. Med Phys. 2009;36:2444.
- Zhu L, Wang J, Xing L. Noise suppression in scatter correction for cone-beam CT. Med Phys. 2009;36:741–752.
- Thing RS, Bernchou U, Mainegra-Hing E, et al. Patient-specific scatter correction in clinical cone beam computed tomography imaging made possible by the combination of Monte Carlo simulations and a ray tracing algorithm. Acta Oncol. 2013;52:1477–1483.
- Filograna L, Magarelli N, Leone A, et al. Value of monoenergetic dual-energy CT (DECT) for artefact reduction from metallic orthopedic implants in post-mortem studies. Skeletal Radiol. 2015;44:1287–1294.
- Matsumoto K, Jinzaki M, Tanami Y, et al. Virtual monochromatic spectral imaging with fast kilovoltage switching: improved image quality as compared with that obtained with conventional 120-kVp CT. Radiology. 2011;259:257–262.
- Bamberg F, Dierks A, Nikolaou K, et al. Metal artifact reduction by dual energy computed tomography using monoenergetic extrapolation. Eur Radiol. 2011;21:1424–1429.
- Chae EJ, Song J-W, Seo JB, et al. Clinical utility of dual-energy CT in the evaluation of solitary pulmonary nodules: initial experience. Radiology. 2008;249(2):671–681.
- McCollough CH, Leng S, Yu L, et al. Dual- and multi-energy CT: principles, technical approaches, and clinical applications. Radiology. 2015;276:637–653.
- Bowman WA, Robar JL, Sattarivand M. Optimizing dual-energy x-ray parameters for the ExacTrac clinical stereoscopic imaging system to enhance soft-tissue imaging. Med Phys. 2017;44:823–831.
- Tanaka R, Sanada S, Sakuta K, et al. Improved accuracy of markerless motion tracking on bone suppression images: preliminary study for image-guided radiation therapy (IGRT). Phys Med Biol. 2015;60:N209–N218.
- Li H, Giles W, Ren L, et al. Implementation of dual-energy technique for virtual monochromatic and linearly mixed CBCTs. Med Phys. 2012;39:6056–6064.
- Elstrøm UV, Olsen SR, Muren LP, et al. The impact of CBCT reconstruction and calibration for radiotherapy planning in the head and neck region – a phantom study. Acta Oncol. 2014;53:1114–1124.
- Nasirudin RA, Tachibana R, Näppi JJ, et al. A comparison of material decomposition techniques for dual-energy CT colonography. Proc SPIE Int Soc Opt Eng; 2015 Feb 21; 9412; pii: 94124F.
- Alvarez RE, Macovski A. Energy-selective reconstructions in X-ray computerized tomography. Phys Med Biol. 1976;21:733–744.
- Zou Y, Silver MD. Analysis of fast kV-switching in dual energy CT using a pre-reconstruction decomposition technique. Proc SPIE Int Soc Opt Eng. 2008;69:1313.
- Hubbell JH, Seltzer SM. NIST: X-Ray Mass Attenuation Coefficients. Physical Reference Data. 1996 [cited 2019 Feb 26]. Available from: https://www.nist.gov/pml/x-ray-mass-attenuation-coefficients
- Shope TB, Gagne RM, Johnson GC. A method for describing the doses delivered by transmission x-ray computed tomography. Med Phys. 1981;8(4):488–495.
- Primak AN, Giraldo JCR, Eusemann CD, et al. Dual-source dual-energy CT with additional tin filtration: dose and image quality evaluation in phantoms and in vivo. AJR Am J Roentgenol. 2010;195:1164–1174.
- Yu L, Leng S, McCollough CH. Dual-Energy CT-based monochromatic imaging. AJR Am J Roentgenol. 2012;199:S9–S15.
- Yu L, Christner JA, Leng S, et al. Virtual monochromatic imaging in dual-source dual-energy CT: Radiation dose and image quality. Med Phys. 2011;38:6371–6379.
- Flohr TG, McCollough CH, Bruder H, et al. First performance evaluation of a dual-source CT (DSCT) system. Eur Radiol. 2006;16:256–268.
- Papadakis AE, Damilakis J. Fast kVp-switching dual energy contrast-enhanced thorax and cardiac CT: a phantom study on the accuracy of iodine concentration and effective atomic number measurement. Med Phys. 2017;44:4724–4735.