
Introduction
State-of-the-art radiotherapy (RT) for prostate cancer has led to improved overall cancer-specific survival rates by increasing the dose delivered to the target, while maintaining the doses delivered to the organs at risk (ORs) [Citation1–3]. However, the rectum is still a dose limiting OR [Citation4] associated with late gastro-intestinal (GI) toxicity, which significantly impairs patients’ quality of life [Citation5,Citation6].
Late GI toxicity have been associated with rectal doses typically using dose-surface or dose-volume histogram (DSH/DVH) metrics derived from the planning CT [Citation4,Citation7–9]. Early models predicting morbidity based on DSH/DVH reduction methods based on planned dose distributions only showed moderate degree of association between dosimetric parameters and GI toxicity [Citation7–9]. The relatively weak associations may be explained by at least two key factors: (1) inter-fractional differences in rectal filling status, which make the planned dose not representative of the accumulated dose [Citation10]; and (2) disregarding of spatial information. Rectal dose surface maps (DSMs) have been suggested as a solution to account for spatial patterns in associations between dose distributions and GI toxicity, potentially improving dose-response relationships [Citation11–15]. Statistical simulations of motion-inclusive accumulated doses have showed potentially stronger associations to morbidity risk than the planned doses [Citation16–18]. Combining this with data from on-board 3D imaging (e.g. cone-beam CT, CBCT), one may potentially obtain accumulated DSMs, although few studies have utilized daily DSMs for that purpose. Shelley et al. presented the first study using on-board megavoltage CT to extract daily rectal DSM, showing an improvement in associations between GI toxicity and parameterized metrics extracted from the accumulated DSMs, compared to planned [Citation15]. However, there is still a need to accurately localize rectal regions more prone to trigger manifestation of late GI toxicity following RT for prostate cancer.
Therefore, the aim of this study was to investigate whether there is a spatial rectal dose-response relationship, as assessed from DSMs, for late GI toxicity following RT for prostate cancer using (1) planned doses and (2) accumulated doses from daily on-board imaging.
Material and Methods
Patient cohort and Treatment
A total of 449 patients were treated with intensity-modulated RT (IMRT) or volumetric modulated arc therapy (VMAT) for prostate cancer at the University of California, San Diego, between 2008 and 2014. Of these, 258 patients were treated with daily CBCT-guided set-up. Twelve patients (5%) presented with any late GI toxicity Grade ≥1; six of these (2%) developed Grade ≥2 late GI toxicity according to the RTOG criteria [Citation19]. These six cases had colonoscopy-identified rectal hemorrhage due to radiation proctitis. The remaining patients free from late GI toxicity were considered as potential controls. No case or control presented with pre-RT GI toxicity (proctitis, rectal hemorrhage, fecal incontinence or rectal fistula).
Three controls per case were matched according to age (± five years), Gleason score, risk group, pre-RT GI status, follow-up time, use of neoadjuvant androgen deprivation therapy, dose prescription and fractionation schedule. A total of 24 patients (six cases and eighteen matched controls) were analyzed. If a case presented more than three potential controls, the selected controls were those presenting the smallest difference in the follow-up time, and follow-up times for cases and controls (mean ± SD: 3.1 ± 0.8 years, vs. 3.7 ± 1.5 years, respectively) were not different (Mann-Whitney test p = .69). The collection of the toxicity information and classification of patient status were performed prospectively by the responsible medical doctor (AH), who was present in all follow-up visits of the patients due to treatment-related problems.
The patients were prescribed to a total of 77.4–81.0 Gy (in 43–45 fractions), delivered to the intact prostate with treatment to the seminal vesicles included at the discretion of the treating physician. All patients underwent planning CT and daily treatments in supine position with the lower extremities immobilized in a VacLock device (Civco Radiotherapy, IA, USA). Planning target volumes (PTVs) were generated in the planning CT from the clinical target volumes (CTVs), using 7 mm margin in all directions except 3 mm margin posteriorly. All treatment plans were performed in Eclipse v.8–10 (Varian Medical Systems, CA, USA), with the planning objective for the dose to the rectum V65Gy<17% and V40Gy<35% [Citation20]. Additionally, the 90% dose line was restricted to encompassing not more than the anterior half of the rectum on any axial slice and the 50% dose line was not allowed to encompass the full circumference of the rectum.
DSM analysis
For each patient, 13 CBCTs were rigidly registered to the planning CT and the connected dose matrix using the clinically recorded 3D treatment shifts (only translations). Dose distributions at each CBCT were a rigid translation of the dose matrix at the planning CT, assuming negligible variations in dose distributions (<2%) due to the interfractional changes [Citation21,Citation22]. Detailed contouring and registration workflow has been described previously [Citation23,Citation24] (Supplementary Material A).
For each patient, the rectum at the planning CT and registered CBCTs was virtually unfolded using a contour-wise method normalizing each dose distribution to a common frame of 200×200 pixels [Citation9,Citation14,Citation25]. Accumulated DSMs were calculated as the sum of the extracted daily map previously converted to EQD2Gy [Citation26], assuming an α/β = 3 Gy [Citation27].
Comparisons of dose distributions were performed using permutation t-tests on planned and accumulated DSMs, described in detail by Chen et al. [Citation28] and also previously used to study spatial dose patterns in patients presenting with GI toxicity [Citation13,Citation29] (Supplementary Material B).
Additionally, dose widths of the entire DSM, dose widths of the inferior part of the DSM, and DSH points for the isodose levels between 30 and 70 Gy (in 5 Gy steps) were compared between cases and controls. Dose widths were previously used to study the associations between spatial dose metrics and GI toxicity [Citation11,Citation15]. Finally, previously developed rectal DSM-based normal tissue complication probability (NTCP) models relating to mild GI symptoms [Citation14] were validated (Supplementary Material C and D). Comparisons were assessed using a two-way ANOVA test accounting for the matching information, while between planned and accumulated using paired t-tests. The statistical analysis was performed in Stata 13.1 (StataCorp, TX, USA) and in Matlab R2018a (The MathWorks Inc., MA, USA).
Results
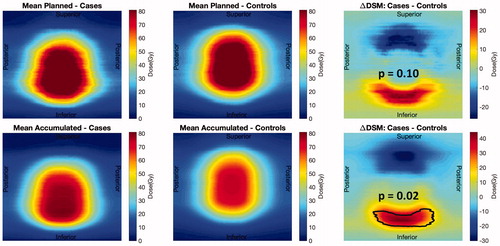
Cases had significantly higher doses compared to controls at the inferior part of the rectum (dose difference in the range 17 Gy–43 Gy) in the accumulated DSMs (p = .02); the differences in the planned DSMs were not significant (dose differences up to 31 Gy; p = .10; ). Additionally, controls had significantly lower doses in the accumulated DSMs than planned (p < .01).
Figure 1. Population average planned (first row) and accumulated (second row) DSMs. Comparison between controls (left column) and cases (central column) showing areas of significant differences (right column).
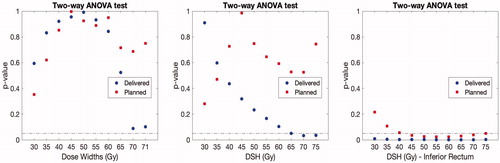
The largest differences in accumulated DSM-based metrics between cases and controls were observed for 70 Gy dose widths (p = .08) and DSH70Gy (p = .03, ). However, metrics extracted from the inferior part of the accumulated DSMs presented larger differences between cases and controls (p = .02). All these differences were found at non-significant levels considering the correction for multiple testing.
Figure 2. p-values of the two-way anova test comparing dose metrics extracted from the DSM between cases and controls for both planned (red) and accumulated (blue) dose distributions.
Discussion
Doses delivered to the inferior part of the rectum were found to be significantly higher in accumulated DSMs for patients that had late GI toxicity following high-precision RT for prostate cancer. A similar statistically significant difference was not observed using planned rectal doses, motivating the use of accumulated doses in the assessment of dose-response relationships for late GI toxicity. Using DVHs/DSHs we did not find corresponding differences between cases and controls. Adding to this, we also found that the patients with toxicity indeed had higher risk of toxicity when using DSM-based NTCP models.
Previous studies have showed that dose widths from the high dose region (60Gy) presented the best discriminative power for GI toxicity [Citation11,Citation15], which are in agreement with the findings of the present study (70 Gy, ). Our findings are also in line with previous observations showing the importance of the high doses delivered to the inferior part of the rectum in the manifestation of severe GI toxicity following RT for prostate cancer [Citation30–32]. However, the use of pixel-wise permutation t-test compared to DSM-based metrics enables identification of rectal areas primarily responsible for the development of GI toxicity.
The present results also showed a clear benefit of using accumulated doses in the analysis of dose-response relationships. In the comparison of planned dose distributions between cases and controls, the present method captured a non-significant trend (p = .10) of higher doses in the inferior rectum for cases compared to controls, however this trend only became significant using the accumulated doses (p = .02). Shelley et al. also demonstrated that delivered doses compared to planned predict better the manifestation of several acute GI symptoms following RT for prostate cancer [Citation15]. Their study was based on on-board daily MV CTs, where the field-of-view does not encompass the entire rectum, and the inferior and superior part of the rectum were therefore ‘filled in’ with information from the planning CT [Citation15].
The number of patients analyzed in the study is low but some significant differences were still observed, and these differences addressing higher doses delivered at the inferior rectum for cases were in concordance with previous studies [Citation30–32]. However, even under strict image-guided RT protocol, assessing rectum and bladder filling status prior each daily fraction delivery, planned dose distributions have limited predictive power of GI toxicity. Therefore, we cannot extract constraints for clinical use to minimize the risk of GI toxicity, and further investigation might be needed to determine dose levels in planned DSMs that will reduce the risk of toxicity in radiotherapy for prostate cancer.
In the analysis of the metrics extracted from DSMs, we acknowledge that multiple comparisons are performed. Therefore, the reader should interpret those borderline significant levels with caution since all reported p-values are above the significance level when correcting for multiple testing (). However, we clearly observed that differences between cases and controls were better described using dose metrics extracted form delivered compared to planned DSMs. Metrics from the inferior part of the rectum also presented a higher level of association compared to those extracted from the entire rectal map, confirming the implication of this part of the rectum in the manifestation of GI toxicity.
The method to extract the DSMs for the planning CT and each fraction is easy to implement. One potential application is to extract DSMs after every fraction (following rectum re-contouring) and reevaluate the risk of GI toxicity for each particular patient. This may open the path for an online adaptive RT for prostate cancer minimizing the risk of toxicity. Further investigation will also disclose whether the trends observed in this study are driven by the treatment planning process, or by the relative position between prostate, rectum and other organs at risk. Using this method we have shown the importance of doses delivered to the inferior rectum. Therefore, this organ substructure may be taken into account during planning to decrease substantially the dose in that region and the risk of late GI toxicity.
In conclusion, patients with late GI toxicity presented with significantly higher doses in the inferior part of the rectum compared to asymptomatic patients. In the planned DSM the patients developing toxicity already presented a trend of higher doses in the inferior sector of the rectum, and these differences became significant using the accumulated DSM extracted from on-board imaging. We also observed that DVH/DSH-based metrics were unable to capture the differences between patients with and without GI toxicity.
Supplemental Material
Download MS Word (569.2 KB)Disclosure statement
No potential conflict of interest was reported by the authors.
Related Research Data
References
- Beckendorf V, Guerif S, Le Prisé E, et al. 70 Gy versus 80 Gy in localized prostate cancer: 5-year results of GETUG 06 randomized trial. Int J Radiat Oncol Biol Phys. 2011;80:1056–1063.
- Heemsbergen WD, Al-Mamgani A, Slot A, et al. Long-term results of the Dutch randomized prostate cancer trial: impact of dose-escalation on local, biochemical, clinical failure, and survival. Radiother Oncol. 2014;110:104–109.
- Raziee H, Moraes FY, Murgic J, et al. Improved outcomes with dose escalation in localized prostate cancer treated with precision image-guided radiotherapy. Radiother Oncol. 2017;123:459–465.
- Michalski JM, Gay H, Jackson A, et al. Radiation dose-volume effects in radiation-induced rectal injury. Int J Radiat Oncol Biol Phys. 2010;76:S123–S129.
- Andreyev H. Gastrointestinal problems after pelvic radiotherapy: the past, the present and the future. Clin Oncol. 2007;19:790–799.
- Petersen SE, Bentzen L, Emmertsen KJ, et al. Development and validation of a scoring system for late anorectal side-effects in patients treated with radiotherapy for prostate cancer. Radiother Oncol. 2014;111:94–99.
- Fiorino C, Fellin G, Rancati T, et al. Clinical and dosimetric predictors of late rectal syndrome after 3D-CRT for localized prostate cancer: preliminary results of a multicenter prospective study. Int J Radiat Oncol Biol Phys. 2008;70:1130–1137.
- Liu M, Moiseenko V, Agranovich A, et al. Normal Tissue Complication Probability (NTCP) modeling of late rectal bleeding following external beam radiotherapy for prostate cancer: a test of the QUANTEC-recommended NTCP model. Acta Oncol. 2010;49:1040–1044.
- Buettner F, Gulliford SL, Webb S, et al. Modeling late rectal toxicities based on a parameterized representation of the 3D dose distribution. Phys Med Biol. 2011;56:2103–2118.
- Jaffray DA, Lindsay PE, Brock KK, et al. Accurate accumulation of dose for improved understanding of radiation effects in normal tissue. Int J Radiat Oncol Biol Phys. 2010;76:S135–S139.
- Buettner F, Gulliford SL, Webb S, et al. Assessing correlations between the spatial distribution of the dose to the rectal wall and late rectal toxicity after prostate radiotherapy: an analysis of data from the MRC RT01 trial (ISRCTN 47772397). Phys Med Biol. 2009;54:6535–6548.
- Lee R, Chan EK, Kosztyla R, et al. Dose-distance metric that predicts late rectal bleeding in patients receiving radical prostate external-beam radiotherapy. Phys Med Biol. 2012;57:8297–82307.
- Wortel RC, Witte MG, van der Heide UA, et al. Dose-surface maps identifying local dose-effects for acute gastrointestinal toxicity after radiotherapy for prostate cancer. Radiother Oncol. 2015;117:515–520.
- Casares-Magaz O, Muren LP, Moiseenko V, et al. Spatial rectal dose/volume metrics predict patient-reported gastro-intestinal symptoms after radiotherapy for prostate cancer. Acta Oncol. 2017;56:1507–1513.
- Shelley LEA, Scaife JE, Romanchikova M, et al. Delivered dose can be a better predictor of rectal toxicity than planned dose in prostate radiotherapy. Radiother Oncol. 2017;123:466–471.
- Thor M, Apte A, Deasy JO, et al. Statistical simulations to estimate motion-inclusive dose-volume histograms for prediction of rectal morbidity following radiotherapy. Acta Oncol. 2013;52:666–675.
- Thor M, Bentzen L, Elstrøm UV, et al. Dose/volume-based evaluation of the accuracy of deformable image registration for the rectum and bladder. Acta Oncol. 2013;52:1411–1416.
- Hysing LB, Ekanger C, Zolnay A, et al. Statistical motion modelling for robust evaluation of clinically delivered accumulated dose distributions after curative radiotherapy of locally advanced prostate cancer. Radiother Oncol. 2018;128:327–335.
- Lawton CA, Won M, Pilepich MV, et al. Long-term treatment sequelae following external beam irradiation for adenocarcinoma of the prostate: analysis of RTOG studies 7506 and 7706. Int J Radiat Oncol Biol Phys. 1991;21:935–939.
- Pollack A, Hanlon AL, Horwitz EM, et al. Dosimetry and preliminary acute toxicity in the first 100 men treated for prostate cancer on a randomized hypofractionation dose escalation trial. Int J Radiat Oncol Biol Phys. 2006;64:518–526.
- Casares-Magaz O, Thor M, Muren LP, et al. The need for dose re-calculation on cone-beam CTs in dose-response studies of pelvic normal tissues (abstr). Radiother Oncol. 2015;115:S508.
- Sharma M, Weiss E, Siebers JV. Dose deformation-invariance in adaptive prostate radiation therapy: implication for treatment simulations. Radiother Oncol. 2012;105:207–213.
- Casares-Magaz O, Moiseenko V, Hopper A, et al. Associations between volume changes and spatial dose metrics for the urinary bladder during local versus pelvic irradiation for prostate cancer. Acta Oncol. 2017;56:884–890.
- Casares-Magaz O, Muren LP, Pettersson N, et al. A case-control study using motion-inclusive spatial dose-volume metrics to account for genito-urinary toxicity following high-precision radiotherapy for prostate cancer. Phys Med Biol. 2018;7:65–69.
- Tucker SL, Zhang M, Dong L, et al. Cluster model analysis of late rectal bleeding after IMRT of prostate cancer: a case-control study. Int J Radiat Oncol Biol Phys. 2006;64:1255–1264.
- Bentzen SM, Dörr W, Gahbauer R, et al. Bioeffect modeling and equieffective dose concepts in radiation oncology-terminology, quantities and units. Radiother Oncol. 2012;105:266–268.
- Brenner DJ. Fractionation and late rectal toxicity. Int J Radiat Oncol Biol Phys. 2004;60:1013–1015.
- Chen C, Witte M, Heemsbergen WD, et al. Multiple comparisons permutation test for image based data mining in radiotherapy. Radiat Oncol. 2013;8:293.
- Heemsbergen WD, Hoogeman MS, Hart GAM, et al. Gastrointestinal toxicity and its relation to dose distributions in the anorectal region of prostate cancer patients treated with radiotherapy. Int J Radiat Oncol Biol Phys. 2005;61:1011–1018.
- Buettner F, Gulliford SL, Webb S, et al. The dose-response of the anal sphincter region-an analysis of data from the MRC RT01 trial. Radiother Oncol. 2012;103:347–352.
- Stenmark MH, Conlon ASC, Johnson S, et al. Dose to the inferior rectum is strongly associated with patient reported bowel quality of life after radiation therapy for prostate cancer. Radiother Oncol. 2014;110:291–297.
- Vanneste BGL, Buettner F, Pinkawa M, et al. Ano-rectal wall dose-surface maps localize the dosimetric benefit of hydrogel rectum spacers in prostate cancer radiotherapy. Clin Transl Radiat Oncol. 2019;14:17–24.