
Abstract
Introduction: Positron emission tomography (PET) using hypoxia-selective tracers like FAZA may guide radiation dose-escalation approaches. However, poor resolution combined with slow tracer retention in relatively inaccessible target cells and slow clearance of unbound tracer results in low-contrast images, and areas where viable hypoxic tracer retaining cells and necrosis (no tracer) are intermixed may pass unnoticed during image thresholding. Here we hypothesized that a clinical feasible one-day dual tracer approach that combines a short-lived (e.g., 11C labeled) metabolic tracer that provides voxel-wise information on viable tissue volume (preferably independently of tumor microenvironment) and a hypoxia marker, may limit threshold-based errors.
Material and methods: 11C-acetate and 11C-methionine uptake was quantified in tumor cell lines under tumor microenvironment-mimicking conditions of high/low O2 (21%/0%) and pH (7.4/6.7). Next, tumor-bearing mice were administered FAZA and sacrificed 1 h (mimics a clinical low-contrast image scenario) or 4 h (high contrast) later. In addition, all mice were administered pimonidazole (hypoxia) and 14C-methionine 1 h prior to sacrifice. Tumor tissue sections were analyzed using dual-tracer autoradiography. Finally, FAZA, or FAZA normalized to 14C-methionine retention (to adjust for differences in viable tissue volume) was compared to hypoxic fraction (deduced from immune-histological analysis of pimonidazole; ground truth) in PET-mimicking macroscopic pixels with variable extent of necrosis/hypoxia.
Results/conclusions: Low pH stimulated 11C-acetate retention in many cell lines, and uptake was further modified by anoxia, compromising its usefulness as a universal marker of viable tumor volume. In contrast, 11C-methionine was largely unaffected by the in vitro microenvironment and was further tested in mice. Necrosis increased the risk of missing hypoxia-containing pixels during thresholding and hypoxic fraction and FAZA signal correlated poorly in the low contrast-scenario. Voxel-based normalization to 14C-methionine increased the likelihood of detecting voxels harboring hypoxic cells profoundly, but did not consistently improve the correlation between the density of hypoxic cells and tracer signal.
Introduction
Hypoxia is a common feature of solid tumors and results in treatment resistance to radio- and chemotherapy [Citation1]. Radiosensitizers like nimorazole improve loco-regional tumor control in head and neck squamous cell carcinoma patients treated with radiotherapy considerably, but only in patients with hypoxic tumors [Citation2]. Loco-regional failure is still quite high, suggesting that nimorazole is unable to fully offset hypoxia-related radio-resistance. Accordingly, other strategies to overcome hypoxia are being explored. These include the use of hypoxia-activated pro-drugs or radiation dose escalation to hypoxic tumors or perhaps only to hypoxic tumor sub-volumes (so-called dose painting) [Citation1]. To allow for prober patient selection, treatment planning and efficacy monitoring of hypoxic intervention, detailed knowledge on tumor hypoxia in individual patients is required. Biopsy-based analysis of hypoxia-regulated genes is able to identify patients with poor prognosis and who benefit from nimorazole treatment [Citation2,Citation3], however, such an approach may be prone to sampling errors and is clearly not useful for creating dose painting plans and for repeated assessment of hypoxia during a treatment course [Citation1,Citation4]. Hypoxia PET imaging is arguably the leading and most appealing imaging technology for detection and quantification of tissue hypoxia, since it non-invasively allows assessment of the entire tumor volume in one examination, thus avoiding the risk of sampling errors. However, 18F labeled nitroimidazole-based hypoxia tracers like FMISO are characterized by slow retention and slow washout of unbound (hypoxia unrelated) tracer, which contaminates the images even hours after tracer administration [Citation5]. As a result, inter-tissue and intratumoral contrast is typically low. A particular concern is that tumor sub-volumes where small foci of hypoxic cells are intermixed with necrosis with little or no tracer, are overlooked when applying thresholds on static low-resolution PET images. Intense efforts have led to the development of novel tracers such as 18F-pimonidazole [Citation6], FAZA and HX4, but, at best, they only perform marginally better than the clinical workhorse tracer FMISO [Citation7–9]. The advent of novel 2-nitro-imidazole-based tracers with profoundly improved imaging characteristics is highly unlikely, but more refined scan protocols may improve image quality. In a previous study, we showed that integration of information on perfusion was unable to improve hypoxia-specificity and overcome the problem of low signal in partly necrotic hypoxic volumes, at least in tumor-bearing mice [Citation10], which contradicts modeling predictions [Citation11], thus underscoring the need for experimental validation. Here we hypothesize that inclusion of a second PET scan that provides reliable information on the extent of viable/dead tumor tissue may heighten accuracy, and lower the risk of missing hypoxic cells during thresholding procedures. FDG is by far the most widely used tracer in clinical oncology and is characterized by high uptake in viable tumor tissue. However, FDG retention is stimulated by hypoxia and a voxel-based normalization to FDG could therefore further aggravate the problem of low signal from partly hypoxic and necrotic sub-volumes. Although the hypoxia-driven stimulation of FDG retention is reduced in tumor cells with the Warburg phenotype [Citation12], the magnitude is highly variable and unpredictable. This may explain some of the discrepancy in clinical studies where clear positive correlations between hypoxia and FDG have been reported in some studies [Citation13,Citation14] but not in others [Citation15]. Importantly, a clinical attractive single-day dual-scan protocol combining FDG with a hypoxia-tracer is not feasible due to the long half-life of 18F (109.8 min). In contrast, the well-established tracers 11C-acetate and 11C-methionine have a radioactive half-life of 20.4 min, which easily allows a subsequent hypoxia scan on the same day. Accordingly, in the present study we tested the usefulness of these two tracers for quantification of viable tissue, and thus to help us to detect treacherous partly necrotic voxels, with apparent low uptake of hypoxia-selective tracers.
Materials and methods
Cell lines
The following cell lines were tested in vitro: SiHa and Caski (squamous cell carcinomas, SCC, of the cervix), FaDuDD (Head and Neck SCC), DU145 and PC3 (prostate adenocarcinomas, AC), MDA-MB-231 and MCF-7 (mammary AC), A549 (lung AC) and BxPC-3 (pancreatic AC). SiHa was cultured in MEM (SiHa) whereas remaining cell lines were cultured in HEPES-buffered Dulbeccós modified Eaglés medium (DMEM). Medium was supplemented with 10% FCS, non-essential amino acids, pyruvate and penicillin/streptomycin. To allow direct comparison, all experiments were performed in DMEM.
Animal tumor models
Mice were obtained from Taconic Laboratories (Ry, Denmark). Subcutaneous murine SCCVII squamous cell carcinoma tumors were established in the flanks of C3H/HenTac male mice by inoculation of minced tumor tissue material from a donor mice. Human Caski xenografts were established as dual-flank tumors in severely immunocompromised CIEA/NOG female mice from cell cultures by inoculation of 3 × 10⁶ cells mixed with 0.2 ml high concentration Matrigel (BD biosciences) per site. SCCVII tumors were used after ∼2 weeks whereas Caski tumors were ready for experiments after 7–8 weeks, when tumor volume reached approximately 0.5 cm3. All experiments were performed under national and European Union approved guidelines for animal welfare.
In vitro tracer experiments
Cells were seeded in 75 µl medium layered on 9 mm circular glass coverslips positioned in custom-built Petri dishes with multiple compartments with free fluid movement between compartments. This set-up allows incubation of up to 4 cell lines in quadruplicate (technical replicates) simultaneously, where cells are sharing a common pool of medium/tracer which minimizes unintentionally experimental variation unrelated to true biological variation (for further details see [Citation16]). Following cell adhesion (>6 h), 20 ml DMEM was gently added to each Petri dish and cells were allowed to grow until confluent. Before experiments, cells were replenished with 20 ml fresh standard DMEM or DMEM titrated to pH 6.7 (when equilibrated with 5% CO2) using a 37% hydrochloric acid solution. Cells were then transferred to airtight gas chambers from Billups-Rothenberg (San Diego, CA, USA), placed in a cell incubator and incubated with slow orbital shaking (to minimize built-up of tracer/O2 gradients in the incubation medium) while being continuously flushed with humidified gas mixtures with 5% CO2 and either 21% or 0% O2. Following a 2 h equilibration period, tracer dissolved in saline was added through small sealable holes (without compromising the chamber gas composition), and cells were allowed to incubate for an additional 30 min. Finally, cells were thoroughly washed in saline. Each coverslip (4 per cell line and per experimental condition) containing attached cells was transferred to scintillation vials and radioactivity was determined using a Packard well counter. Following decay correction and correction for any dish-to-dish variability in medium tracer content (measured in 100 µl medium samples drawn from each dish), cellular tracer retention was expressed relative to control cells (21% O2 and pH 7.4). Murine SCCVII tumor cells were not tested in vitro, since this cell type adheres poorly to glass.
In vivo tracer experiments
Tumor-bearing mice were administered ∼40 MBq FAZA intraperitoneally (IP) in 0.2 ml saline 1 h (low-contrast scenario) or 4 h (high-contrast scenario) prior to sacrifice. In addition, all mice were administered a mixture of 14C-methionine (0.037 MBq) and the hypoxia marker pimonidazole (60 mg/kg) IP in 0.02 ml/g 1 h prior to sacrifice (i.e., together with FAZA for the 1 h group). Mice were killed with neck dislocation and tumor and muscle (non-hypoxic reference tissue) samples were frozen in pre-cooled iso-pentane for autoradiographic analysis. Remaining tissue samples were weighed and radioactivity was determined using a Packard well counter, which only detects high-energy radiation (i.e., FAZA related signal) and tumor FAZA retention was expressed relative to muscle tissue.
Dual-tracer autoradiography
Multiple 10 µm tumor tissue cryo-sections were cut and immediately exposed to phosphor imaging plates for ∼2 h and analyzed using a BAS5000 scanner. Due to the large difference in administered doses of the two tracers, this first short round of autoradiography provides a reasonable accurate measure of FAZA, where the contamination from 14C-methionine contributes less than 2% to the total signal. Tissue sections were then left for at least 28 h to allow for complete 18F decay (<0.1‰ 18F remaining) and re-exposed to imaging plates for several days (to compensate for the low dose of 14C-methionine) and analyzed for the distribution of 14C-methionine as described for FAZA.
Pimonidazole staining
Following autoradiographic analysis, selected tissue sections were immune-stained for pimonidazole-adducts and digitalized and thresholded using ImageJ, resulting in maps displaying the distribution of viable hypoxic (pO2 < 10 mmHg) cells. For additional technical details, see [Citation10].
Image analysis
FAZA and 14C-methinone autoradiograms and pimonidazole hypoxia maps were manually co-registered using different landmarks like tissue section periphery, tissue holes/folds etc. Following co-registration, the spatial relationship between hypoxia and 14C-methionine was quantified by drawing regions of interest in viable non-hypoxic and viable severely hypoxic areas guided by late-time (4 h) FAZA autoradiograms. In addition, pixel-by-pixel scatterplot analysis comparing the signals from 4 h FAZA and 14C-methionine was performed using a 1 × 1 mm grid size. Due to extensive necrosis in Caski tumors, the scatterplot analysis was only performed in SCCVII tumors. Next, tissue sections from tumors collected 1 h after FAZA administration (low contrast scenario) were layered with multiple 2 × 2 mm pixels (as a mimic of the macroscopic volume sampled during PET scans) at the interface between necrosis and viable tissue. FAZA signal was expressed as a ratio relative to a non-hypoxic viable reference area (equivalent to quantification of clinical PET images) derived from non-hypoxic viable tumor tissue. The resulting ratios were compared to the absolute number of hypoxic cells in each pixel, referred to as hypoxic fraction (HF). Finally, we tested the usefulness of a normalization procedure, where FAZA was normalized to 14C-methionine (by dividing the two signals) in each pixel as well as in the non-hypoxic reference ROI and the resulting ratios were again compared to HF. Since necrosis was largely absent in SCCVII tumors, this analysis was only meaningful in Caski tumors. For an example, see .
Statistics
Tracer retention in cells exposed to low pH and/or O2 was expressed relative to control cells maintained at pH 7.4 and 21% O2. A one-sample t-test was performed to assess if the relative fold-change in tracer uptake was different from zero (i.e., control cells). Correlations between HF and raw/normalized tracer signals (FAZA, 14C-methionine, FAZA/14C-methionine) were analyzed using Pearson regression analysis.
Results
Initially, we tested in vitro whether tumor-mimicking microenvironmental conditions affect the retention of two clinically well-established short-lived PET tracers (). Low pH and pO2 affected the retention of 11C-methionine and 11C-acetate but not to a similar extent. Of note, the influence of the microenvironment on acetate retention was generally more pronounced and with larger inter-cell line variability. Hypoxia and acidosis significantly elevated acetate uptake in several cell lines, which was not the case for 11C-methionine. Based on the in vitro results, methionine was chosen for further in vivo testing of our primary hypothesis.
Figure 1. (A) In vitro 11C-acetate and 11C-methionine retention under various conditions, that mimics the deviant tumor microenvironment. Data are normalized to control conditions (O2 = 21%, pH = 7.4). The dotted lines indicate 75 and 125% of tracer retention under control conditions, respectively. *p < .05; †p < .001. n was 3-6 for all cell lines except for BxPC3 where it is 2. (B, C) Examples of corresponding FAZA (4 h PI) and 14C-methionine (1 h PI) autoradiograms and pimonidazole stainings for SCCVII (B) and Caski (C) tumor sections. It is evident that, 14C-methionine retention is reduced in hypoxic areas. In SCVII, which is largely non-necrotic, the spatial relationship between FAZA and 14C-methionine was analyzed by calculating Pearson’s r values from scatterplots based on a 1 × 1 mm grid covering the entire viable hypoxic area. The grid-based analysis was not performed in Caski tumors due to excessive central necrosis, resulting in few or none pixels in viable non-hypoxic tissue. However, manual delineation of viable non-hypoxic and hypoxic areas (encircled areas) guided by FAZA autoradiograms revealed that methionine retention also in this tumor model was reduced under hypoxia.
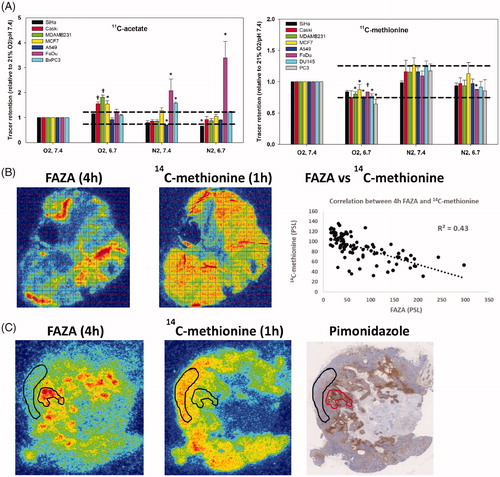
The FAZA tumor-to-reference tissue ratio increased over time and was 0.98 ± 0.2 and 5.8 ± 1.2 in Caski tumors, 1 and 4 h after tracer administration, respectively. The corresponding values for SCCVII was 1.44 ± 0.3 and 5.6 ± 0.7 at 1 and 4 h, respectively. These whole-tissue differences were also mirrored in invasive analysis, where FAZA correlated strongly to HF 4 h post-injection (PI), whereas the correlation was much weaker at 1 h PI (see Supplementary Figure 1). 14C-methinonie was largely restricted to viable areas whereas some FAZA penetration into necrotic areas was observed as early as 1 h PI (e.g., ). A comparison of late-time (4 h) FAZA autoradiograms (which provides an accurate measure of intratumoral hypoxia as shown in Supplementary Figure 1) and 14C-methionine autoradiograms revealed reduced 14C-methionine retention in hypoxic areas (). Analysis of manually drawn ROIs encompassing non-necrotic FAZA hotspots revealed that 14C-methionine was lowered by ∼60% and ∼50% in viable hypoxic areas in Caski and SCCVII tumors, respectively. A separate analysis of macroscopic pixels positioned at the interface of the viable tumor rim and central necrosis, and thus comprising both viable hypoxic cells and necrosis in Caski tumor sections in the FAZA 1 h group (low-contrast scenario), revealed a poor correlation between tracer signal and absolute number of hypoxic cells in most tumors (). In addition, most voxels were classified as being non-hypoxic when signal was normalized to non-hypoxic viable tumor tissue (or muscle, not shown) using a clinical established ratio of 1.4 (). We next repeated the analysis following normalization of FAZA to 14C-methionine in each pixel and in the non-hypoxic viable reference ROI. This normalization process reduced the number of hypoxia-containing pixels that were classified as non-hypoxic by thresholding and improved the correlation between tracer signal and density of hypoxic cells in 4 out of 5 tumors (for an example see ). A summary of all analyses at a per tumor basis is provided in the table insert in .
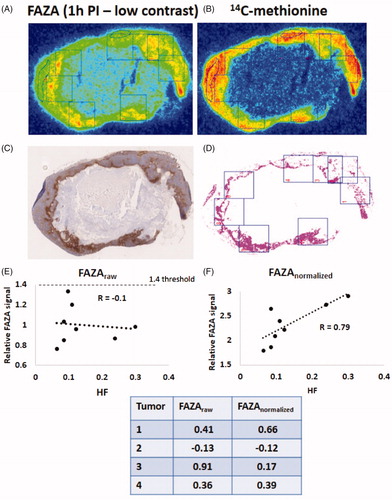
Figure 2. Example of pimonidazole maps and autoradiograms 1 h after FAZA administration (low-contrast scenario) derived from a Caski tumor. Pixels with a size of 2 x 2 mm were positioned arbitrarily on the FAZA autoradiograms (A). Pixels were next positioned similarly on the 14C-methionine (B) autoradiograms and the pimonidazole maps (C, D) to include non-hypoxic and hypoxic viable tissue and necrosis. A free-hand ROI encircling a non-hypoxic viable reference area was also included. Signals from the two tracers were determined and compared to hypoxic fraction (HF) extracted from segmented pimonidazole maps (D). HF was not corrected for necrosis and thus represents the absolute number of radioresistant hypoxic cells. (E) correlation between HF and FAZApixel-to-reference ROI signal (equals the approach used in clinical settings). (F) correlation between HF and FAZApixel-to-reference ROI signal following normalization to the respective 14C-methionine signal values in each pixel/ROI (for further explanation see materials and methods). The table insert shows the same analysis as in E and F but performed in 4 other tumors.
Discussion
Unfortunately, inherent weaknesses in PET in general (low resolution) and hypoxia PET in particular (poor image contrast) remains a significant obstacle, and novel tracers or more sophisticated scans that include information on perfusion (e.g., [Citation10]) have not led to any significant progress or clinical implementation. A particular concern is the confounding influence of tissue necrosis in areas with viable treatment-decisive hypoxic cells, which may lead to signal dilution and threshold errors. Unlike in patients, hypoxia PET tracers are able to obtain excellent image contrast and hypoxia specificity in tumor-bearing mice. Indeed, tumor-to-muscle tissue ratios in our two tumor models reached very high values close to 6, four hours after tracer administration, which probably reflects profound metabolic rate differences between mice and humans, leading to much more effective clearance of unbound tracer in mice at late time points. We have previously shown that hypoxia imaging 1–1.5 h PI in mice results in clinical relevant tumor-to-muscle tissue ratios slightly above one [Citation10]. Therefore, tumor tissue material collected 1 h after FAZA injection was used to test our central hypothesis, that the low-contrast problem may be partly overcome if some information on viable tissue content on a voxel-basis is available. Preferably, such a metabolic marker is minimally influenced by the deviant and heterogeneous tumor microenvironment. Somewhat reduced uptake in hypoxic tissue may also be beneficial, since it is expected further to increase the possibility of detecting small foci of hypoxic cells. Conversely, very low uptake of a metabolic marker may result in noisy images and extreme image-derived values following a voxel-by-voxel normalization process. The retention mechanism of acetate is not fully understood but may, besides various monocarboxylate transporters, involve a significant diffusive component of un-dissociated (protonated) acetic acid. This may explain that uptake was somewhat elevated in many cell lines under extracellular acidosis (). Furthermore, recent studies (e.g., [Citation17]) have shown that acetate is an important fuel for hypoxic and nutrient-deprived cells, suggesting that some cell lines may adaptively upregulate acetate transport under low oxygen conditions, as we observed in FaDu cells. Clearly, and as explained previously, this is not ideal for the intended normalization procedure.
Methionine is an important protein building block, but tumor uptake is considered as a marker of transmembrane amino acid uptake capacity, rather than protein synthesis per se, which may explain largely unaltered uptake under hypoxic conditions, although persistent low pO2 is known to suppress protein synthesis [Citation18]. Based on our in vitro tracer assay, showing that the microenvironment influence methionine retention minimally, we decided to use methionine (14C-labeled to allow dual-tracer autoradiography) for in vivo testing of our hypothesis. 14C-methionine retention was somewhat lowered in hypoxic cells in vivo (). This may relate to partial methionine depletion by well-oxygenated cells close to capillaries, thus limiting methionine delivery to more remote and chronically hypoxic cells. Alternatively, the difference between in vitro and in vivo data, may be caused by an adaptive ATP-saving depression in protein synthesis and amino acid transport capacity under chronic hypoxia, which may not become evident under the acute 2 h exposure period used in vitro.
As expected, an initial comparison between FAZA signal and absolute number of hypoxic cells in macroscopic pixels positioned at the interface of the viable tumor rim consisting of both hypoxic and non- hypoxic cells and central necrosis revealed a poor correlation during the low-contrast scenario (). In addition, nearly all voxels were classified as being non-hypoxic when signal was normalized to non-hypoxic viable tumor tissue and a clinical established ratio of 1.4 was applied (). However, when the analysis was repeated following normalization of FAZA to 14C-methinonie (FAZAnorm) in each pixel, most pixels with hypoxia (pimonidazole) were classified as being hypoxic (). Although normalization greatly lowered the risk of overlooking voxels containing hypoxic cells, normalization did not consistently improve the correlation between PET signal and HF (, table insert), and in one tumor normalization unexpectedly reduced the correlation profoundly.
In our study we used pimonidazole as the ground truth for quantification of the number of viable hypoxic cells. A validation-process of the distribution of FAZA where it is compared to a closely related hypoxia probe with a similar retention mechanism may seem as flawed circular reasoning. However, during the pimonidazole staining protocol unbound compound is effectively washed away and the final staining only shows bound reduced pimonidazole-adducts whereas the FAZA signal consists of both bound (hypoxia-unrelated) and unbound tracer.
Conclusions
Our pre-clinical study, mimicking a clinical low-contrast scenario, suggests that a clinical feasible normalization process where a hypoxia PET scan is preceded by an 11C-methionine scan may reduce the risk of overlooking hypoxic radio-resistant cells in partly necrotic voxels and possibly increase the quantitative accuracy of PET imaging. Appropriate handling of voxels with very low signal on both FAZA and 11C-methionine PET, which may lead to noisy or extreme normalized values remains problematic, but avoiding wasting dose to such areas may be justified since the absolute number of hypoxic cells by necessity must be low. Clearly, further studies are required and should preferably include additional tumor models and dual-tracer repeated PET scans which may further add complexity, but also clinical relevance, compared to an exclusively autoradiographic-based approach, were co-registration uncertainties are reduced to a minimum.
Supplemental Material
Download MS Word (1.3 MB)Acknowledgements
The authors thank Ms M. Simonsen from the Department of Nuclear Medicine and PET Centre (Aarhus University Hospital) and Ms I. M. Horsman, Mr M. Johannsen, Ms D. Grand, and Ms M. Kristiansen from the Department of Experimental and Clinical Oncology (Aarhus University Hospital) for excellent technical and practical assistance.
Disclosure statement
No potential conflict of interest was reported by the authors.
Additional information
Funding
Related Research Data
References
- Horsman MR, Mortensen LS, Petersen JB, et al. Imaging hypoxia to improve radiotherapy outcome. Nat Rev Clin Oncol. 2012;9:674–687.
- Toustrup K, Sørensen BS, Lassen P, et al. Gene expression classifier predicts for hypoxic modification of radiotherapy with nimorazole in squamous cell carcinomas of the head and neck. Radiother Oncol. 2012;102:122–129.
- Toustrup K, Sørensen BS, Metwally MA, et al. Validation of a 15-gene hypoxia classifier in head and neck cancer for prospective use in clinical trials. Acta Oncol. 2016;55:1091–1098.
- Grégoire V, Thorwarth D, Lee JA. Molecular imaging-guided radiotherapy for the treatment of head-and-neck squamous cell carcinoma: does it fulfill the promises? Semin Radiat Oncol. 2018;28:35–45.
- Busk M, Horsman MR, Overgaard J. Resolution in PET hypoxia imaging: voxel size matters. Acta Oncol. 2008;47:1201–1210.
- Busk M, Jakobsen S, Horsman MR, et al. PET imaging of tumor hypoxia using 18F-labeled pimonidazole. Acta Oncol. 2013;52:1300–1307.
- Wack LJ, Mönnich D, van Elmpt W, et al. Comparison of [18F]-FMISO, [18F]-FAZA and [18F]-HX4 for PET imaging of hypoxia-a simulation study. Acta Oncol. 2015;54:1370–1377.
- Peeters SG, Zegers CM, Lieuwes NG, et al. A comparative study of the hypoxia PET tracers [18F]HX4, [18F]FAZA, and [18F]FMISO in a preclinical tumor model. Int J Radiat Oncol Biol Phys. 2015;91:351–359.
- Chen L, Zhang Z, Kolb HC, et al. 18F-HX4 hypoxia imaging with PET/CT in head and neck cancer: a comparison with 18F-FMISO. Nucl Med Commun. 2012;33:1096–1102.
- Busk M, Munk OL, Jakobsen SS, et al. Hypoxia positron emission tomography imaging: combining information on perfusion and tracer retention to improve hypoxia specificity. Acta Oncol. 2017;56:1583–1590.
- Thorwarth D, Eschmann SM, Paulsen F, et al. A kinetic model for dynamic [18F]-Fmiso PET data to analyse tumour hypoxia. Phys Med Biol. 2005;50:2209–2224.
- Busk M, Horsman MR, Kristjansen PE, et al. Aerobic glycolysis in cancers: implications for the usability of oxygen-responsive genes and fluorodeoxyglucose-PET as markers of tissue hypoxia. Int J Cancer. 2008;122:2726–2734.
- Mönnich D, Thorwarth D, Leibfarth S, et al. Overlap of highly FDG-avid and FMISO hypoxic tumor subvolumes in patients with head and neck cancer. Acta Oncol. 2017;56:1577–1582.
- Di Perri D, Lee JA, Bol A, et al. Correlation analysis of [18F]fluorodeoxyglucose and [18F]fluoroazomycin arabinoside uptake distributions in lung tumours during radiation therapy. Acta Oncol. 2017;56:1181–1188.
- Zegers CM, van Elmpt W, Hoebers FJ, et al. Imaging of tumour hypoxia and metabolism in patients with head and neck squamous cell carcinoma. Acta Oncol. 2015;54:1378–1384.
- Busk M, Horsman MR, Jakobsen S, et al. Cellular uptake of PET tracers of glucose metabolism and hypoxia and their linkage. Eur J Nucl Med Mol Imaging. 2008;35:2294–2303.
- Gao X, Lin SH, Ren F, et al. Acetate functions as an epigenetic metabolite to promote lipid synthesis under hypoxia. Nat Commun. 2016;7:11960.
- Sørensen BS, Busk M, Overgaard J, et al. Simultaneous hypoxia and low extracellular pH suppress overall metabolic rate and protein synthesis in vitro. PLoS One. 2015;10:e0134955.