
 ?Mathematical formulae have been encoded as MathML and are displayed in this HTML version using MathJax in order to improve their display. Uncheck the box to turn MathJax off. This feature requires Javascript. Click on a formula to zoom.
Abstract
Purpose
Pelvic target dose from intensity-modulated proton therapy (IMPT) is sensitive to patient bowel motion. Robustly optimized plans in regard to bowel filling may improve the dose coverage in the treatment course. Our purpose is to investigate the effect of air volume in large and small bowel and rectum on target dose from IMPT plans.
Methods and material
Data from 17 cancer patients (11 prostate, 3 gynecologic, 2 colon, and 1 embryonal rhabdomyosarcoma) with planning CT (pCT) and weekly or biweekly scanned quality assurance CTs (QACTs; 82 QACT scans total) were studied. Air in bowels and rectum traversed by proton pencil beams was contoured. The robust treatment plan was made by using 3 CT sets: the pCT set and 2 virtual CT sets that were copies of pCT but in which the fillings of bowels and rectum were overridden to be either air or muscle. Each plan had 2–5 beams with a mean of 3 beams. Targets in the pCT were mapped to the QACTs by deformable image registration, and the dose in QACTs was calculated. Dose coverage (D99 and D95) and correlations between dose coverage and changes in air volume were analyzed. The significance of the correlation was analyzed by t test.
Results
Mean changes of D99 in QACTs were within 3% of those in the pCT for all prostate and colon cases but >3% in 2 of the 3 gynecologic cases and in the embryonal rhabdomyosarcoma case. Of these three cases with mean change of D99 > 3%, air volume may be the main cause in 2. For the prostate cases, correlation coefficients were <0.7 between change in air volume and change in D99 and D95, because other anatomy changes also contributed to dose deviation. Correlation coefficients in the non-prostate cases were >0.9 between D99 change and rectum and between D95 change and small bowel, indicating a greater effect of the air volume on target dose.
Conclusion
The air volume may still have an important effect on target dose coverage in treatment plans using 3 CT sets, particularly when the air is traversed by multiple beams.
Introduction
Proton radiation therapy is increasingly used to treat a range of disease sites. The integral dose in the patient’s body is lower with proton plans than with photon plans, and the dose beyond the proton beam range decreases dramatically to a negligible level. For prostate and other cancers in the pelvic region, low doses to organs at risk (OARs) may reduce dose toxicity. In a study comparing dose toxicity outcomes from proton therapy and intensity-modulated radiation therapy (IMRT), Fang et al. showed by univariate analysis that 4.3% and 13.8% of acute gastrointestinal toxicities were grade ≥2 for proton therapy and IMRT, respectively, with corresponding genitourinary findings of 21.3% and 28.7% [Citation1]. This suggested that fewer patients would have medium- and high-grade toxicities with proton treatment than with IMRT. Lin et al. reported acute toxicities in 11 patients with post-hysterectomy gynecologic cancer treated with proton pencil-beam scanning [Citation2]. Compared with IMRT plans, the proton plans reduced dose to bone marrow, rectum, bowels, and bladder. Hematologic, gastrointestinal, and genitourinary toxicities were within acceptable tolerances. These and other studies show similar or slightly better treatment outcomes with proton therapy than IMRT [Citation3,Citation4]. The dosimetric advantage in proton plans is not fully transferred to outcomes because of essential uncertainties in proton therapy, including proton range uncertainty and relative biologic effectiveness. In addition, proton range is sensitive to patient anatomy change in the proton beam path. In the pelvis, in addition to patient weight change, air in bowels and rectum, bladder filling, and femoral bone rotation can significantly affect proton range [Citation5,Citation6].
Robust planning techniques are used in proton treatment planning to mitigate CT number-stopping power conversion uncertainty and translational setup uncertainty. The RayStation (RaySearch Laboratories AB; Stockholm, Sweden) treatment planning system (TPS) can generate robust plans from multiple CT image sets. Our institute uses 3 CT image sets to reduce the potential effect of air in bowels and rectum on dose in daily treatment: the original CT set and 2 virtual CT sets that are the same as the original, except that the large and small bowels and rectum are filled with either air or muscle [Citation7]. Thus we consider the extreme cases for potential filling in the CT. One might think that the plan would be robust against fillings during the course of treatment and that no further bowel motion assessment is needed. However, if, during treatment, air in the rectum or bowels is significantly more than that during the CT scan (so that the volume of the rectum or bowels is larger than that during the CT scan), the virtual CT sets might not be sufficient. To address these concerns, we report our investigation on the effect of air in rectum and bowels on target dose by utilizing planning CTs (pCTs) and regularly scanned quality assurance CTs (QACTs).
Material and methods
Data from 17 cases of prostate cancer and other cancers in the pelvis were randomly selected for this retrospective, Internal Review Board–approved study. Patients were treated at Maryland Proton Treatment Center at University of Maryland School of Medicine with Varian ProBeam (Varian Medical Systems; Palo Alto, CA) intensity-modulated proton therapy (IMPT) in the last 2 years. The selection criteria included that the treatment plans were made in RayStation TPS, and the QACTs were regularly scanned. Treatment diagnoses included two prostate bed–only, nine prostate with lymph nodes, three gynecologic, and two colon cancers and one embryonal rhabdomyosarcoma. lists the information on beam arrangement, prescription dose, and adaptive planning for each case. OARs were contoured in the region of the target plus a 2-cm extension in the inferior and superior directions. Treatment plans were created in RayStation 7 and 8. Robust planning techniques were used. A 3.5% range uncertainty and 5-mm setup uncertainty were added to the target. In addition to the pCT set, 2 CT sets (both copied from the pCT set) were used in robust planning. The density of filling in bowels and rectum was overridden to that of air in 1 CT set and muscle in the other CT set. For the prostate bed boost plans, two single-field optimized lateral parallel opposite pair (POP) beams were used and delivered on either the same day or alternative days. For prostate cancer with lymph nodes, three multifield optimized beams were used, two lateral and one posterior, except in one case in which a synthetic implant was on the left. Virtual blocks were contoured in regard to the target geometry (see, for example, Figure S1 in Supplementary Materials) and used to block unexpected pencil beams entering defined regions in all investigated cases. (See the RayStation user manual for details on virtual blocks.) The TPS prevents any pencil beam from stopping at or passing through the virtual block. For cases using posterior beams, a virtual block (rectum block) was used to avoid pencil beams in the rectum and tissues posterior to the rectum. For cases with targets involving bilateral lymph nodes, a virtual block (mid-block) was used to prevent beams from reaching the contralateral nodes, thus reducing dose to the bladder and bowels between the nodes (Figure S1 in Supplementary Materials). The planning goal was to cover 100% of the gross tumor volume (GTV) and at least 95% of the clinical tumor volume (CTV) prescription doses and to meanwhile limit dose to OARs per Radiation Therapy Oncology Group guidelines [Citation8]. With range and setup uncertainties, the planning goal of the worst-case scenario was 95% of CTV covered by 95% of prescription dose. The pencil-beam convolution superposition algorithm was used to calculate dose.
Table 1. Information on investigated cases.
In the treatment room, the patient was set up on a 6°-of-freedom robotic couch and positioned by onboard cone beam CT (CBCT) or orthogonal kV planar images. CBCTs were acquired in the first 3 fractions and then weekly or biweekly, and kV images were acquired in each fraction. The image guidance used bony structure for patient positioning. For patients with fiducial markers in the prostate (all prostate cases had fiducial markers except cases 7 and 8), the location of the markers on treatment day had to be within 3 mm of that in the pCT. Bowel and rectum filling were assessed by CBCT.
Anatomy changes were monitored by weekly or biweekly QACTs that were scanned in the same region as the pCTs. Dose deviations on the target and OARs were obtained by performing dose calculation in the registered QACTs with treatment plan beamline data. Rigid registration was used for dose calculation in QACTs, and deformable image registration (DIR) was performed to transform the contours of targets and OARs from the pCTs to QACTs. The deformed contours were not manually edited, but the deformation was checked. In the clinic, when the dose deviation was out of the tolerance range, an adaptive process was triggered. The new plan was then used as the reference for the QACTs that followed. In total, 82 QACTs were acquired in these 17 patients.
In this retrospective study, we contoured air in the large and small bowels and the rectum in all the pCTs and QACTs. Because the dose contribution from the air out of the beam path is negligible, we focused on air in the target and in the entire proximal region of the target in the beam path. The change in air volume between the pCT and a QACT is expressed as the symmetric difference:
(1)
(1)
We investigated ΔD99 and ΔD95, the deviations of target dose at 99% and 95% of the volume, and the correlation between ΔVair and ΔD99 (ΔD95). To express the deviation from the prescription dose, we used the relative difference = 100(DpCT – DQACT)/Dx of D99 and D95, where DpCT and DQACT are the doses in the pCT and QACT, respectively, and Dx is the prescription dose. We checked whether the deviation of target dose was >5% and/or >3%. These numbers were adopted according to International Commission on Radiation Units and Measurements Report No. 24 [Citation9], in which an uncertainty of 5% of dose was tolerable and the tolerance for patient setup, including the anatomy change, was 3%. To compare the robustness of plans with and without using the 3 CT–set technique on ΔVair, we reoptimized plans in the pCT only and performed dose calculation in the QACTs with the replanned beamline data. Results were analyzed by the Student’s t-test in Microsoft Excel.
Results
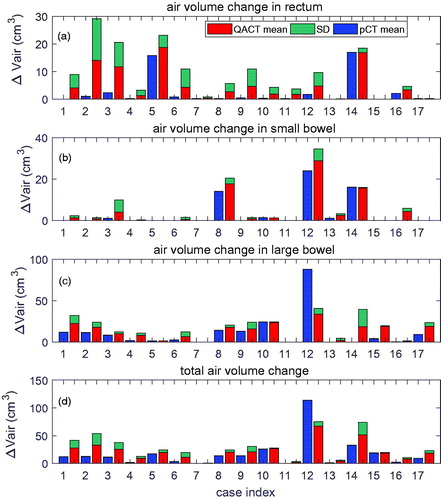
The mean and standard deviation (SD) of ΔVair in the rectum, small bowel, and large bowel are displayed in , respectively. shows total ΔVair in the rectum, small, and large bowels. For each case, air volume in the pCT is displayed before the mean and SD of ΔVair in the QACTs. The SD in the pCT was zero, because only 1 pCT was used. From , ΔVair in rectum and small bowel in the QACTs was larger than or similar to air volume in the pCT. This was also true for air in the large bowel, except for case 12. This may indicate that for a majority of the treatment course, the air volume change during treatment was larger than the air volume during pCT scanning.
Figure 1. ΔVair extracted from the pCT and QACT in: (a) rectum; (b) small bowel; and (c) large bowel for the 17 cases. Total ΔVair is displayed in (d). Cases 1–11 are prostate cancer (prostate bed–only in cases 7 and 11); cases 12–14 are gynecologic cancer; cases 15 and 16 are colon cancer; and case 17 is embryonal rhabdomyosarcoma. For each case, air volume in the pCT is displayed in blue before the mean and SD of ΔVair in the QACTs.
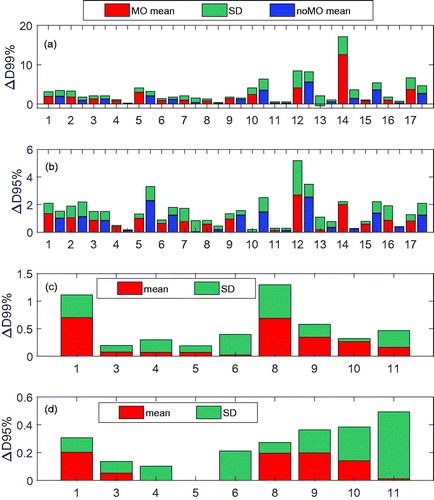
shows the relative dose difference. Out of all 17 cases, the mean of D99% was >5% in 1 case (14) and >3% in 2 cases (12 and 17) (). No cases had
D95% >3% (). When the boost plans were applied to the QACTs in the prostate bed cases, air in bowels and rectum was not in the lateral POP beam paths, and the means of
D99% and
D95% were <1.5% () and <0.5% (), respectively.
Figure 2. (a) D99% and (b)
D95% in the initial plan in all study cases; (c)
D99%; and (d) ΔD95% in the boost plan in the prostate cases. In (a) and (b), results from optimization with and without virtual CTs are displayed. “Mean_MO” and “Mean_noMO” stand for the mean value of the dose changes from the plans with and without the virtual CTs in the optimization, respectively. In (c) and (d), virtual CTs were used.
For plans without virtual CTs, 1 case (12) had a mean of D99% >5%, 2 cases (10 and 15) >3%, and no case with a mean of
D95% >3% in the QACTs of the initial plans (). Interestingly, for case 14, the mean of
D99% was 12.5% from the plan with virtual CTs but decreased to 1.5% from the plan without virtual CTs. It was found that the plan without virtual CTs had more POP component (beams with 90° and 270°; see Figure S2 in Supplementary Materials for more detail). The difference in ΔD99% (ΔD95%) from the plans with and without virtual CTs was within 1%, except in cases 5, 10, 12, and 15, in which the means of ΔD99% or/and ΔD95% improved >1% (the maximum improvement was 2.8% in ΔD99% in case 15, and 1.4% in ΔD95% in case 10) by using the virtual CT sets, and in case 14, where the mean of ΔD99% decreased by 11%.
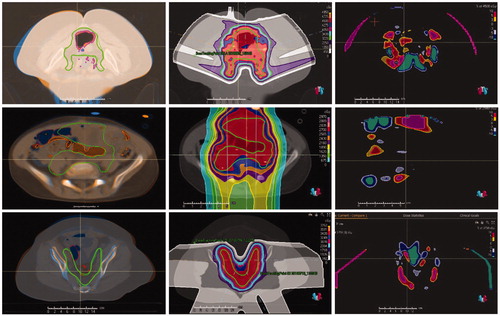
To determine whether air volume was the main cause of the large deviation in D99 in cases 12, 14, and 17, we checked the registered images and the dose differences. The top row in shows the DIR of the pCT and the third QACT of case 12, with dose and dose difference distributions. Air in the large bowel was in the target, and the locations of air were different in the pCT and QACT, resulting in accumulated In addition, patient body anatomy change further increased the difference. For case 17, as shown in the middle row in , the locations of air were quite different in the pCT and QACT, and air was in the beam paths, resulting in proton beam range deviation and dose change. In the displayed slice, the dose was from the anterior–posterior beams only, because the lateral beams were blocked. For case 14, as shown in the bottom row in , from the registered pCT and QACTs, the anatomy change in the beam paths was obvious, especially bony structure displacement. Thus, the main cause of the large
D99% in case 14 was patient body anatomy change, although the air volume change might contribute to
D99%. For this case, adaptive plans were created from QACTs, but the
D99% remained >5%.
Figure 3. Registered pCT and QACT (left column), dose distribution in the pCT (middle column), and difference in doses in the pCT and QACT (right column) for cases 12 (top row), 17 (middle row), and 14 (bottom row). The CTV contour in the pCT is in solid green, and the dashed green line on the QACT was obtained by DIR. Brown = contour of air in pCT; red = contour of air in QACT.
The correlation coefficients and t-test p values between D99%,
D95%, and ΔVair in rectum, small and large bowel, as well as total ΔVair are listed in . In general, the correlation coefficients were larger in the non-prostate cases than those in the prostate cases, but the P values were less in the prostate cases except the p values in small bowel. The positive correlation coefficient indicates that dose decreases as volume difference increases. For the prostate bed, the correlation (p) between
D99% and ΔVair in the rectum was –0.34 (0.01) and that between
D95% and ΔVair in the rectum was –0.46 (0.01).
Table 2. Correlation coefficients and t-test p values between D99%,
D95%, and ΔVair in rectum, small and large bowel, and total change of air volume.
We also checked the effect of ΔVair on the target dose coverage in QACTs. In these 17 cases, 2 (cases 13 and 16) had CTV D99 < 95% of Dx and D95 < 95% of Dx in the original plan, whereas 5 (cases 12, 13, 14, 16, and 17) had means of D99 < 95% of Dx and 2 (cases 13 and 16) had D95 < 95% of Dx in QACTs (see Figure S3 in Supplementary Materials for more details).
Discussion
We retrospectively studied the effect of air in bowels and rectum on dose distribution for pelvic diseases. For cases 12 and 17, there was a strong effect on D99 and D95. Specifically, the locations of air in the pCT and some QACTs were different, and the air was on the path of multiple beams. This increased dose deviation. The delocation of air is similar to intrafractional air movement and will result in significant dose change [Citation10]. To prevent this from happening, we suggest contouring the air and beam paths in the pCT and using these contours to assess patient preparation and setup before beam delivery.
We found air between the left and right sides of lymph nodes in most prostate cases. It is the virtual mid-block that prevents beams from passing through the air. The shape of the mid-block can have a critical effect on both dose distribution and plan’s robustness to air volumes. If the mid-block is thin and a large quantity of air appears during beam delivery but not in the pCT, the beams can pass through the air and deliver dose to the other side of the mid-block. We should emphasize that the mid-block is virtual, not physical. The mid-block only stops the beams in the plan but not necessarily in the patient body. On the other hand, if the mid-block is thick enough to cover potential air, dose coverage on the lymph nodes could still be challenged by proton beam range uncertainty.
The effect also depends on beam arrangement. For prostate bed cases planned with lateral POP beams, air volume in the rectum had little effect on D99 (D95). This may be a benefit from the POP beams. Rectum gas could delocate the prostate in the anterior–posterior direction. However, the mean of D99%
D95%) was within 1% of the prescription dose. This may indicate that the margin we used on the GTV was sufficient for the rectum gas effect. Of the 11 prostate cases, cases 1, 3, 4, and 7 used spacers (Hydrogel SpaceOAR, Boston Scientific Corporation; Bedford, MA) between the prostate and rectum. The pCTs with the spacers were used in both the CTV and GTV plans. The spacer could reduce rectum dose and prostate motion in photon radiation therapy [Citation11], but from
D99% and
D95%, we did not see statistical deviation with and without the spacer in the IMPT plans. In our prostate cases, the standard beam angles were lateral POP beams plus 1 posterior beam. However, more robust plans could be obtained by using other beam angle arrangements [Citation12].
This retrospective study revealed that the mean of D99%
D95%) was within 3% of the prescription dose for all the prostate cases. The result agreed with the findings by Berger et al who did not use robust optimization planning but added a 5-mm isotropic internal target volume margin to the PTV in their cervix cancer cases [Citation13]. This indicates the high robustness of the plans against air and anatomy change. Furthermore, the mean and SD of
D95% were less than those of
D99%, although for CTV the correlation coefficient was higher between
D95% and ΔVair than that between
D99% and ΔVair.
To compare the robustness of the plan from the 3-CT sets with that from the single-CT sets, we removed the virtual CTs, reoptimized the plan, and recalculated dose in the QACTs. The difference of the means of ΔD99% (ΔD95%) from the plans with and without using virtual CTs was within 1%, except in 4 cases in which the means of ΔD99% or/and ΔD95% improved by >1% by using the virtual CT sets. However, in case 14, the mean of ΔD99% increased 11% by using the virtual CTs. Several groups have recently reported improved robustness planned from multiple CT sets in head-and-neck and lung sites [Citation14,Citation15]. They found that such a robust plan could significantly maintain target dose coverage and only slightly increase OAR dose. The multiple CT sets included potential anatomy change. Comparatively, anatomy change (bowel and rectum fillings, femoral bone rotation, etc.) in the pelvis is more interfractional than long term. In our investigated cases, adaptive planning was performed in only 1 of 11 prostate cases and none of the colon cases but all of the gynecologic cases and the embryonal rhabdomyosarcoma case ().
In addition to the air volume, other interfractional factors, including body anatomy change, femoral bone rotation, and bladder fillings, contribute to dose change [Citation5,Citation6]. This may explain why the correlation coefficients were not >0.7 in the prostate cases (). However, in the non-prostate cases the correlation coefficient was 0.94 for D99 change and rectum, and 0.95 for D95 change and small bowel. Thus, in the non-prostate cases air volume change should merit attention. Investigations on the change of proton beam range (water equivalent length) and on the correlation between the change of range and dose may improve our results and are warranted. All investigated plans were planned with a 3.5% range uncertainty. This added a few millimeters extra to proximal and distal margins on the target, depending on the depth of the target. However, our dose calculation was performed on the pCT and QACT. Hence, the results reported here represent the best-case scenario, in which range uncertainty is zero in the patient’s body. A more complete analysis should consider the worst-case scenario, with a range uncertainty of 3.5% in the patient’s body or, alternatively, with 0% range uncertainty assumed in planning [Citation16,Citation17]. However, even in this best-case scenario, we obtained D99 decreased >3% in 2 gynecologic and 1 embryonal rhabdomyosarcoma cases, 2 of which we attribute to the air volume changes.
Conclusion
We retrospectively investigated the effect of air in large and small bowels and rectum on dose coverage in 17 prostate and other pelvis cases by using the pCT and 82 QACTs. Plans were made robust to the filling of bowel and rectum and uncertainties on setup and range. In most cases, the mean of D99 (D95) change was within 3%, and, particularly for those prostate bed cases in which lateral POP beams were used, the plans were quite robust for air volume. In three non-prostate cases, the mean of D99 change was >3%. In two of these three cases, air volume change was considered to be the main cause of the dose change. Thus, air volume may still have an important effect on target dose coverage in the robust treatment plans, particularly when the air is traversed by multiple beams.
Supplemental Material
Download MS Word (667.1 KB)Acknowledgments
This work was partially supported by AAPM Undergraduate Research Fellowship program, the Seeds Grant in Radiation Oncology at the University of Maryland School of Medicine. We thank Dr. Nancy Knight for her scientific editing and the anonymous reviewers for their insightful comments.
Disclosure statement
No potential conflict of interest was reported by the author(s).
References
- Fang P, Mick R, Deville C, et al. A case-matched study of toxicity outcomes after proton therapy and intensity-modulated radiation therapy for prostate cancer. Cancer. 2015;121(7):1118–1127.
- Lin LL, Kirk M, Scholey J, et al. Initial report of pencil beam scanning proton therapy for posthysterectomy patients with gynecologic cancer. Int J Radiat Oncol Biol Phys. 2016;95(1):181–189.
- Grewal AS, Schonewolf C, Min EJ, et al. Four-year outcomes from a prospective phase II clinical trial of moderately hypofractionated proton therapy for localized prostate cancer. Int. J. Radiat. Oncol. Biol. Phys. 2019;105(4):713–722.
- Santos PMG, Barsky AR, Hwang WT, et al. Comparative toxicity outcomes of proton-beam therapy versus intensity-modulated radiotherapy for prostate cancer in the postoperative setting. Cancer. 2019;125(23):4278–4293.
- Trofimov A, Nguyen PL, Efstathiou JA, et al. Interfractional variations in the setup of pelvic bony anatomy and soft tissue, and their implications on the delivery of proton therapy for localized prostate cancer. Int. J. Radiat. Oncol. Biol. Phys. 2011;80(3):928–937.
- Yao W, Krasin MJ, Farr JB, et al. Feasibility study of range-based registration using daily cone beam CT for intensity-modulated proton therapy. Med Phys. 2018;45(3):1191–1203.
- Zhu M, Kaiser A, Mishra MV, et al. Multiple CT robust optimization to account for random anatomic density variations during intensity-modulated proton therapy. Advances in Radiat Oncol. 2019. DOI:10.1016/j.adro.2019.12.003
- Gay HA, Barthold HJ, O'Meara E, et al. Pelvic normal tissue contouring guidelines for radiation therapy: a Radiation Therapy Oncology Group consensus panel atlas. Int. J. Radiat. Oncol. Biol. Phys. 2012;83(3):e353–362.
- Report 24, Journal of the International Commission on Radiation Units and Measurements, Volume os13, Issue 1, 1976.
- Kumagai M, Hara R, Mori S, et al. Impact of intrafractional bowel gas movement on carbon ion beam dose distribution in pancreatic radiotherapy. Int J Radiat Oncol Biol Phys. 2009;73(4):1276–1281.
- Pinkawa M, Berneking V, Schlenter M, et al. Quality of life after radiation therapy for prostate cancer with a hydrogel spacer: 5-year results. Int J Radiat Oncol Biol Phys. 2017;99(2):374–377.
- Gravgaard Andersen A, Casares-Magaz O, Petersen J, et al. Beam angle evaluation to improve inter-fraction motion robustness in pelvic lymph node irradiation with proton therapy. Acta Oncol. 2017;56(6):846–852.
- Berger T, Petersen JBB, Lindegaard JC, et al. Impact of bowel gas and body outline variations on total accumulated dose with intensity-modulated proton therapy in locally advanced cervical cancer patients. Acta Oncol. 2017;56(11):1472–1478.
- Cubillos-Mesías M, Troost EGC, Lohaus F, et al. Including anatomical variations in robust optimization for head and neck proton therapy can reduce the need of adaptation. Radiother Oncol. 2019;131:127–134.
- Wang X, Li H, Zhu XR, et al. Multiple-CT optimization of intensity-modulated proton therapy - Is it possible to eliminate adaptive planning? Radiother Oncol. 2018;128(1):167–173.
- Zhang X, Dong L, Lee AK, et al. Effect of anatomic motion on proton therapy dose distributions in prostate cancer treatment. Int J Radiat Oncol Biol Phys. 2007;67(2):620–629.
- Soukup M, Söhn M, Yan D, et al. Study of robustness of IMPT and IMRT for prostate cancer against organ movement. Int J Radiat Oncol Biol Phys. 2009;75(3):941–949.