
ABSTRACT
Local governments around the world are increasingly coproducing services with citizens, commonly as a response to austerity. A common approach is to use ‘citizen sensors’, relying on citizens to report issues digitally through web portals or apps. There is mixed evidence about how different citizens act in different environments with concerns about resulting (in)equity in outcomes. This paper examines citizen-reporting of maintenance of the public realm through a UK digital platform (FixMyStreet.com). We find service requests follow a parabolic relationship between neighbourhood deprivation levels and reporting, but ignoring the contributions of ‘superusers’ there is a more linear relationship, with more reports in less-deprived areas. We find that the presence of significant infrastructure (transport, schools) leads to more reports, suggesting guardianship over journeys as well as residential neighbourhoods. We conclude that local government, when directly coproducing services with citizens, need to be careful to ensure equitable outcomes between neighbourhoods.
Introduction
As widely discussed across literatures in public administration, public management and political science, coproduction, in a variety of forms, has become a more common way of delivering public services over the past two decades (Bovaird, Citation2008; Bovaird et al. Citation2015; Needham Citation2008; Whitaker Citation1980). A driver for this is to deepen deliberative democracy, but a more practical reason is to use citizen knowledge to better target the increasingly limited resources of governments (Bailey, Bramley, and Hastings Citation2015; Bovaird et al. Citation2015). A widely researched example of coproduction in local government is encouraging citizens to make direct requests for a range of services and repairs and improvements to the public realm. Which citizens make these requests, and how often, will affect the distribution of resources and neighbourhood quality. Reporting issues such as cleanliness, upkeep and maintenance of public areas are commonly referred to in North America as ‘311’ services (Clark et al. Citation2020; O’Brien Citation2017; Offenhuber Citation2015). These can be reported via telephone, web portals and mobile phone apps channelled through Customer Relationship Management databases. Aggregated, the data from these requests can be used to explore citizen demands for placekeeping – the management and maintenance of the local environment (Dempsey et al. Citation2011, Citation2011). Local governments may perceive of such data as an accurate report of problems requiring services. However, this presupposes all citizens are equally able and willing to report such issues – an empirical question to which there are varying answers.
The complex and varying relationship between citizen contact and measures of socio-economic status has been well established in 311 studies from North America (Clark et al. Citation2020; White and Trump Citation2018;). In this paper, we report on analysis of data from FixMyStreet.com (FMS) from across the UK. FMS allows citizens to report problems through an online portal that sends the report to the appropriate local authority. This can be done via a smartphone, tablet, or personal computer through a crowdsourcing platform. This kind of citizen reporting via technology is part of a wider suite of ‘smart city’ tools, which use reported and automated data collection to improve the efficiency of service and asset management in a city (Meijer Citation2011; Norris and Reddick Citation2013).
The data from FixMyStreet is quite different from that contained in many 311 analyses. Firstly, 311 analyses commonly cover a single urban area (for example: Xu and Tang Citation2020 in Tallahassee, FL; O’Brien et al. Citation2017 in Boston, MA), whereas FixMyStreet data have coverage nationwide, in varied urban and rural areas. 311 analyses also often rely on a subset of types of citizen reports, whereas we look at all reports. FixMyStreet data can also help us understand whether people are motivated to mainly report issues in residential areas where they may live, or whether altruistic guardianship of areas can be detected for places that are not a ‘home’, such as transport infrastructure. The richness of our data thus allows us to interrogate further whether the coproduction of place-keeping services through direct citizen reporting may drive inequalities in outcomes through a number of under-examined routes.
This paper uses FMS reports from between 2011 and 2015 to explore how access factors (broadband and mobile connectivity), geographic and infrastructure factors (presence of schools, companies and train stations) and socio-economic factors (measures of neighbourhood deprivation) relate to the number of reports from neighbourhoods. As with other analysis, we find a parabolic relationship between socio-economic status and volume of reports, but also find that this effect is modified by the presence of superusers in areas of higher deprivation. However, this relationship differs for types of issues reported, with a direct relationship between lower deprivation and higher reporting of road defects, and an inverse relationship with lower reporting for environmental problems (dog fouling and littering). We also find that, while rural use of FMS is in the minority, this usage demonstrates how online services can solve different problems in different contexts. Taken together, we suggest there are risks that direct coproduction of place-keeping services by local government could lead to worsening outcomes for more deprived neighbourhoods. This suggests local governments need to be critical and analytical in their use of such data, and in-line with previous research on place-keeping (Hastings Citation2007) maintain investment in planned services to maintain neighbourhood quality.
Citizen sensors and local service provision
Place-keeping services are a core activity for local government. In the UK and globally, such services are at the forefront of changes in local administration. In the short term, services are being transformed as a consequence of ‘efficiencies’ and austerity cuts: service redesigns and staff reductions; cuts in service levels; facilities closed or merged; contracting-out (APSE Citation2017; Hastings et al. Citation2017). Within England, Gray and Barford (Citation2018) estimated that central government funding to local government had reduced by 23.7% over 2009–2017. Further, it was local authorities with the highest proportion of deprived neighbourhoods that were hit hardest by the cuts (Hastings et al. Citation2017). As spending for statutory services has been protected, cuts to placekeeping services amounted to £2 billions between 2009 and 2017 (Gray and Barford Citation2018; Eckersley and Tobin Citation2019). These budget cuts have led to the exploration of new (and cheaper) ways of delivering services.
Coproduction can be seen as a spectrum of approaches where citizen knowledge is brought together with service expertise to deliver greater efficiency (Needham Citation2008; Alford Citation2002; Bovaird Citation2007; Offenhuber Citation2015; Osborne Citation2018). The spectrum of approaches ranges from long-term, in-depth collaboration with citizens groups where they are empowered to deliver for their community with the state, to one-way reporting by a citizen to a government to report a problem which requires a service response (Bovaird et al. Citation2015). For placekeeping services, this might mean participation in strategic and operational planning, such as highlighting local problems; the delivery of service, such as community litter-picks; or particularised contacting (Cantijoch, Galandini, and Gibson Citation2016) – making use of citizens acting as sensors reporting individual problems (Offenhuber Citation2015; O’Brien, Citation2016) or apps such as FixMyStreet (Sjoberg, Mellon, and Peixoto Citation2017; Offenhuber Citation2015). Citizen reporting is especially useful for reports that are a matter of human perception, such as perceived safety (Sepasgozar et al. Citation2019). The data recorded from such service interactions provide new ways to understand either environmental quality or levels of citizen engagement with services.
Citizen demand for placekeeping can be rooted in private or collective motivations, and will have both private and public benefits (Schmidthuber et al. Citation2017). Cantijoch, Galandini, and Gibson (Citation2016, 1898) argue that ‘particularised contacting’ has been seen as less meaningful engagement than voting and communal activity as it is ‘driven primarily by private instrumental interests and did not seek to address broad and collective policy issues’. While place-keeping will reflect individual concerns, their resolution can have collective benefits. The pothole in the road outside someone’s home is both of concern to them, but of general concern to all users of that road; dog fouling in a park may be of concern to the citizen who steps in it, but improving the quality of public places will benefit the community. Research from the Austrian city of Lintz found motivations for reporting driven by this concern for collective benefits (Schmidthuber et al. Citation2017).
Requests for services are also subject to feedback loops between citizens and service providers. Hastings (Citation2009a), Hasting (Citation2009b) found expectations of citizens and service providers interact, where less responsive services lead to fewer requests for services by citizens. This in turn suggests that residents of an area are more likely to discard litter, or take less pride in their neighbourhood, justifying differences in service levels. Similarly, Schmidthuber et al. (Citation2017) found that previous experience of reporting issues to city authorities in Lintz was a motivator for citizens reporting through a new online platform. Michener (Citation2013) found evidence of neighbourhood effects aligned to the ‘broken-windows’ thesis, that when a particular threshold of neighbourhood environmental disorder is reached citizens stop engaging as they feel overwhelmed by the sheer volume of problems. In the opposite direction, areas with greater political resources may be able to lobby for better service, improving the environment and creating an expectation of successful response to service requests (Hastings et al. Citation2014). More directly, the responsiveness of authorities affects the behaviour of citizens, with Sjoberg, Mellon, and Peixoto (Citation2017) finding that swift resolution of problems led to greater likelihood of producing future reports. This suggests the level of participation from individual citizens is not fixed but shaped by contextual factors (Przeybilovicz et al. Citation2022).
Online reporting services: FixMyStreet and 311
In the US, 311 services began in Baltimore in 1996 as a reaction to the large number of non-emergency calls going to the 911 system (Clark, Brudney, and Jang Citation2013). After this success, it was promoted by the Clinton administration to improve local government performance and taken up by various local governments in the USA to access government services. While primarily a telephone service, websites and smartphone apps now offer alternative reporting channels. The term ‘311’ has become a generalised global label for this kind of reporting service.
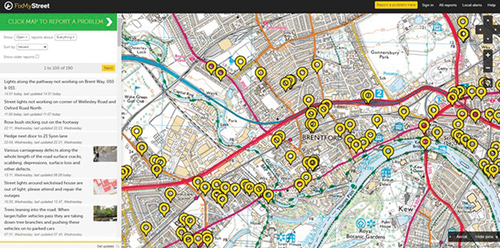
As noted, FMS () is both a product that local governments in the UK can use as a 311 portal, and also a charitable service that refers reports to local authorities via email. The website provides a simple-to-use interface to report problems in a user’s local area (identified by their postcode/zipcode). Reports are then channelled to the relevant local authority via email, or through integration with internal systems. The software is available as open-source and there are 20 instances running outside the UK. Since its launch in 2007, FMS has processed over a million problem reports across the UK, so it provides a large, national dataset of where problems are being reported.
Figure 1. Screenshot of FMS interface.
The format of FMS data and 311 data is very similar, but differences in its generation mean they need to be interpreted differently. Both datasets detail the reported problem, location and when reported, but 311 data sometimes have detail about the reporter not captured in FMS. FMS covers multiple authorities, and so category names differ between areas. As a voluntary system, FMS reports will also only be a partial picture of issue reporting, as many of which will go directly to the authority. As FMS is used as an official reporting system, this makes comparisons between areas more difficult as this represents more official engagement than voluntary citizen engagement. Further, duplicate reports are ideally reduced in FMS by people being aware of others already having reported the same issue as all reports are public, whereas duplicate reports in a 311 dataset indicate how visible a problem may be.
Disentangling reports of problems, the actual problems and equity
A key challenge in analysing equity and coproduction via direct citizen reporting is disentangling attributes that make someone more likely to report an issue, and ‘neighbourhood’ effects that make it more likely that issues will be present (Hastings Citation2009a; White and Trump Citation2018). The socio-economic status (SES) of citizens is related to both incidence of problems in their area and reporting rates. Nearly 40 years ago, Hero (Citation1986) synthesised this literature suggesting there was a parabolic relationship between contacting and SES being driven by two different factors: awareness of the ability to contact (which increases with SES), and need to contact (which decreases with SES) giving a peak of contacting in the middle. A ‘median’ contacter lives in an area with problems, but expects these problems can be fixed by contacting government. This means that two factors drive reports: the instances of problems, and the likelihood of citizens reporting these problems. These effects are difficult to identify from the administrative data alone. Researchers have attempted to overcome this through analysing subsets of the data or collecting additional data for comparison (O’Brien). While this may seem to be a social science methodology problem, the parabolic relationship also points to equity issues in resource distribution if local governments rely on reports to target services. If there are a lower number of reports from deprived neighbourhoods with greatest service need due to structural issues (Hastings Citation2009a), and a higher number of reports from neighbourhoods with fewer problems, and reactive services flow from these requests, then inequalities in environmental outcomes will be exacerbated. Ultimately, this could lead to citizens to disengage from reporting the state entirely, if they feel local problems are too great to overcome (Michener Citation2013).
One way to understand the relationship between reporting and neighbourhood or individual characteristics is to analyse reports when there is a uniform problem, such as snowfall or storm damage. As snowfall is evenly distributed across a city, this creates an even demand for snow-clearance, allowing uneven use to be examined. Researchers thus checked 22 other services and found that ‘unlike snow removal, the initial distribution of need for these other services is likely endogenous to the city’s unique geography and neighbourhood-level demographics’ (Levine and Gershenson Citation2014a, 616). Xu and Tang (Citation2020) used a similar approach to understand the impact of smartphone app-based reporting of power cuts following a hurricane in Tallahassee, FL, finding that app use resulted in faster reporting and quicker response time in poorer neighboourhoods. White and Trump (Citation2018, 14) argue that experimental design to control for one effect can be ‘inventive and interesting, but in many potential research designs involving 311 data, they may be infeasible and/or inapplicable’.
Additional data can be used to validate or enrich data collected through 311 systems. White and Trump (Citation2018) argue that creating a direct measure of need is the best approach to exploring citizen engagement with reporting data, thus O’Brien, Sampson, and Winship (Citation2015b, 41) used an audit of street light problems alongside 311 data. A similar approach can be explored with third-party surveys of issues. In England, the Keep Britain Tidy neighbourhood survey found a higher incidence of dog fouling in more deprived neighbourhoods; however, FMS data show a peak of reporting in the middle of the scale, with declining reports of dog fouling in more deprived areas (Parsons Citation2017). O’Brien (Citation2016: 91) separately used a survey to investigate the motivations behind reports in Boston, MA, and found ‘clear specialization by individuals in reporting either issues arising from natural deterioration or incivilities’, findings supported by research by Schmidthuber et al. (Citation2017) in Austria.
Data are generated by users, not geography
Previous analysis of FMS users show they are not representative of the wider population, and this affects the kind of data that is produced. A 2016 survey showed that users were older and more likely to be male than the population at large. Cantijoch, Galandini, and Gibson (Citation2016) found the user base was 64.4% male, with a mean age of 55 and ethnic minorities were under-represented, representing 2% as opposed to 14% of the UK population. Some of this difference is due to the voluntary nature of FMS. When FMS is used by a local authority as its CRM system, 42% of reports were made by women versus 28% on FixMyStreet.com (Parsons Citation2019). This unevenness is significant because it affects the kinds of problems that are reported and where they live. Solymosi, Bowers, and Fujiyama (Citation2017) found that different categories of reports were more likely to be reported by men and women (with a rough division between problems noticed while driving as opposed to while walking) and Hastings, Matthews, and Wang (Citation2021) found that reports are more likely to be from women who live in deprived neighbourhoods. This suggests that FMS and 311 reports should be seen as ‘bundles’ of related services, with different drivers of reporting (Parsons Citation2019b). Where different groups have different needs but have different rates of reporting, this affects which problems are addressed, and in-turn the provisioning of services.
Evidence from 311 studies suggest existing resources and relationships to the state also affect reports. Feigenbaum and Hall (Citation2015) found in Boston that a 10% increase in per-capita income predicts a 3% increase in the number of requests for snow removal and ‘higher income areas are more likely to place requests using the city’s smartphone app’. White and Trump (Citation2018) sound a note of caution, finding ‘the relationship between income/poverty and 311 calls can look dramatically different depending on which time period the researcher chooses to aggregate calls over’ suggesting poverty rates and household incomes should not be taken as a proxy for the need for services. Levine and Gershenson (Citation2014a) and Pak, Chua, and Vande Moere (Citation2017) both note differences in participation levels between ethnic groups and between first-generation migrants and others. There is evidence that newer technologies, particularly smartphones, are a mediating factor here. Xu and Tang (Citation2020) suggest that services accessible through a mobile phone can help close distributional inequality in public service provision and overcome some of these barriers and Young (Citation2021, 13) found that reports made through an Open311 app were resolved faster on average than those made by telephone, People’s interactions with the state are part of feedback loops which lead some to not engage, and others to engage far more than average. This is supported by Schmidthuber et al. (Citation2017) who, applying the technology acceptance model, found that although new technologies could encourage new people to report, it was previous experience of reporting that more strongly predicted reporting on new platforms.
Where a subset of users engage far more than others, this may also affect the impact of the service. Recognition of such ‘superusers’ or ‘super-engagers’ with the local state has been widely acknowledged in a broad range of literature on coproduction in public services (Naff Citation2009; Hastings, Matthews, and Wang Citation2021). For example Bang and Eva (Citation1999) identified ‘everyday makers’ who work to improve neighbourhoods and communities. A wider literature has identified a gendered aspect to this, with women often extended their domestic guardianship out to the wider neighbourhood (Grimshaw Citation2011; Hastings, Matthews, and Wang Citation2021). As Haklay (Citation2016, 42) argues ‘[t]he specific background and interests of high contributors will, by necessity, impact on the type of data that is recorded’, and in the case of requests for public services, this could bias the distribution of those public services in their favour (Matthews and Hastings Citation2013). However, this does not necessarily produce socio-economic inequalities in patterns of reporting, with Hastings, Matthews, and Wang (Citation2021) finding that women ‘superusers’ in more deprived nieghbourhoods (reporting issues over 100 times in a year) mediating the impact of men reporting more in less-deprived neighbourhoods. User activity on FixMyStreet is similar to other prominent online services in that most reports are created by a small number of the total users, 10% of users account for over 60% of reports (Parsons Citation2019a).
Barriers to access and the smart countryside
Online forms of 311 have the potential to improve services but also present new barriers to access. Improving the efficiency of the information gathering process can improve the level of service (Clark et al. Citation2020; Schmidthuber et al. Citation2017; Wu Citation2020; Xu and Tang Citation2020). The internet can lower the costs of engagement, but these reduced costs might reinforce existing participation divides (Bimber Citation2001). Internet use had reached 78% of the UK population by the midpoint of our data’s range in 2013 (Dutton, Blank, and Groselj Citation2013, 12), but less internet use is associated with other social or individual factors. Existing 311 studies that have considered the impact of new web-based services (open government platforms; smartphone apps) have tended to consider urban areas (Schmidthuber et al. Citation2017; Xu and Tang Citation2020). While the initial digital divide was solely related to factors of access like geography and socio-economic status, as access has become easier it has become clearer that participation is also moderated by cultural factors, where use or non-use is affected by perceived utility, and intermediaries may be available to gain some of the benefits of participation (Scheufele and Nisbet Citation2002; Dutton, Blank, and Groselj Citation2013; Schmidthuber et al. Citation2017). These cultural factors interweave with factors like age, and geography, complicating the question of who can easily access internet resources. The nationwide coverage of the FMS dataset allows us to answer some of these questions, particularly whether poorer internet access in rural areas may make it more difficult for citizens to access web-based public services.
There are potentials for unique benefits from technology in rural areas. Online citizen reporting is often described as a component of ‘smart cities’, which aim to use technology to increase the efficiency of urban life. A British Standards Institute (Citation2014) report positions smart cities as a solution to problems of urbanism, and defines a smart city as the ‘effective integration of physical, digital and human systems in the built environment to deliver a sustainable, prosperous and inclusive future for its citizens’ (British Standards Institute Citation2014). Nothing in this description could not also apply to programmes and technologies deployed in rural areas, and the citizen-centred approaches described by Sepasgozar et al. (Citation2019) can equally be applied to rural areas. Ashmore, Farrington, and Skerratt (Citation2015, 276) argue that rural broadband can increase rural citizens ‘control over everyday activities’, and improved speed leads to greater reliability and resilience for personal and business decisions. Parker (Citation2000) argues internet access in rural areas has a greater payoff than in urban areas as rural areas benefit less from the inherent network and amalgamation effects generated in dense urban environments. Digital technologies can bring some of the benefits of the urban environment to less physically connected businesses and places, with the significant limitation of needing to increase skills in the population.
It is important to recognise that rural local authorities have different needs and demographics to urban authorities, and this affects the applicability of solutions developed for cities. Finland has explored ‘Smart Countryside’ approaches, narrowing in on the importance of familiarising ‘people with digital tools and [investing] in building the capacity and willingness of people to use digital services’ (ENRD Citation2018). The presence of good infrastructure (while important) is not sufficient and the researchers found areas with good infrastructure but ‘no solutions for products or services that would be built on this infrastructure’. Rural areas in the UK have, on average, a population that is older, less wealthy and less well educated than urban areas, all of which are factors that lead to different profiles of internet use. Thus, Blank et.al. (Citation2018) suggest studies highlighting the lack of broadband use in rural areas treat rurality as independent, when it is highly related to these other factors. As demographic characteristics are unevenly spatially distributed, what appear to be regional factors might in reality be demographic ones. For digital services that operate in both urban and rural areas, differences in use may result from different kinds of users as well as different access to online infrastructure.
The overwhelming proportion (80%) of FMS users are in urban areas, but in rural areas there are slightly more reports as a proportion of the population. shows that 20% of reports in England and Wales (2011–2015) are made in rural areas, while only containing 18% of the population. This is especially noticeable in rural villages who make up 11% of reports from 7% of the population. While containing a minority of the country, they contain most of the physical area – and so of equal population areas in rural and urban areas, the rural area will be physically far larger. Alternatively, this difference could result from different effectiveness of engagement feedback loops, where more affluent rural authorities have seen their funding decline far less than urban authorities (Hastings et al. Citation2017), and so may have more capacity to respond to reported issues. The environment is also different, and there are different needs linked to the local built environment (Keep Britain Tidy Citation2015; O’Brien, Sampson, and Winship Citation2015b). For example, densely populated areas and high streets have greater littering and place-keeping issues; and peripheral neighbourhoods with large open-spaces are difficult to manage (Hastings Citation2007). Thus, rural areas possibly represent not just a minority use of FMS but a distinct use.
Table 1. Urban–Rural classification.
Research questions
Existing research on coproduction via 311 services has variously found a complex and contradictory story about how this is linked to (in)equity in outcomes in terms of place-keeping. Our data does not allow us to link reporting to outcomes, however the UK-wide scope of our data allows us to understand differences in reporting rates in a UK context, and to understand the impact of a wider range of geographies than much of the existing 311 research Our analysis investigated four main questions examining platform effects; rural/urban distinctions; the effects of multiple deprivation; and the impact of built infrastructure in driving reports. Intersecting these areas of concern is a common question of whether factors should be understood as relating to the entirety of services reported, or if effects are more limited to the type of issue being reported. This produces our four research questions:
(1) the dataset contains reports from where FMS is the official reporting mechanism in some areas, while a voluntary system in others. Areas where it is the official system almost certainly have higher reports compared to the baseline, so our first question is: can this effect be isolated by removing the reports made through these branded portals, or is there any effect for reports made through FixMyStreet.com that needs to be controlled for regardless?
(2) There is some evidence suggesting that there is a distinct rural use of FMS, but this might be affected by different demographics and internet access in rural areas. Our second question therefore is: controlling as much as possible for demographic, population and access factors, is FMS used notably differently in rural areas?
(3) Our third question is, similarly controlling for population factors, what is the relationship between levels of neighbourhood deprivation in an area and reporting rates? Further, do the different motivations and much higher activity of a small group of superusers (users who make more than 50 reports) affect this relationship?
(4) Experiments related to 311 studies find that most reports are made in a tight radius of a reporters’ home. This cannot be explored in FMS data. However, the data allow us to explore if people’s sense of guardianship extends over their daily journeys and wider environment. Our fourth research question therefore is: are there more reports around ‘non-home’ focal points, such as schools, offices or transport hubs?
Methodology and data processing
The research questions were explored by constructing a model exploring the relationship between FMS reports and relevant variables. This was run against four different possible ways of counting the reports: with and without superusers (people who reported more than 10 times in one area); and with and without reports made through official partner websites, where all reports will come via FMS. The model was then examined on subsets of the data that represent different kinds of reports made.
The model uses a dataset covering England, Scotland and Wales covering 2011–2015. While more years of data have become available since, using this range simplifies the other datasets used for comparison. FixMyStreet.com collects data through the whole of the UK, but there are comparatively few reports (844) made in Northern Ireland during this time range so these were excluded. Almost all UK local authorities accept reports via FixMyStreet.com (the public facing site maintained by mySociety), with 22 councils refusing reports for at least some of the 2011–2015 period. Reports in these areas are excluded.
FMS records report incidents as latitude and longitude, for this study these have been converted into counts for small geographical areas. These are Lower Super Output Areas (LSOAs) for England and Wales and Datazones (DZs) for Scotland, which have a lower average population. LSOAs have an average population of approximately 1,700 people, whereas Datazones are about half that size, with an average population of 900.
A count without superusers was made by excluding all reports but one in a LSOA/DZ made by a user who had made more than 10 reports. This means all superusers are reduced to one report in an area, but may have reports over several areas. A count without reports made via official portals was made by excluding individual reports made through all portals other than FixMyStreet.com or the mobile app. A dataset of how long local authorities were FixMyStreet clients in the time period is used to construct a measure of ‘client_years’ as a control. While FMS contains data for many councils, the reporting service is customised by council. Either by email coordination or through the Open311 standard, FMS tries to mirror the internal reporting categories of the different local authorities. As such, it is not simple to group reports in one area with reports in another. There are hundreds of separate categories, many of which describe similar problems. To examine if effects are similar on different kinds of reports, reports were amalgamated into Nyanzu (Citation2018)’s C-level categories grouping all FixMyStreet reports into eight meta-categories ().
Table 2. FMS service categories.
We sourced the population size, population density, and average age for each LSOA/DZ across Great Britain. The respective Rural Urban Classification from the ONS and National Records of Scotland have different scales but have a common definition of the difference between an urban and rural area. This was used to create a binary ‘rural’ variable across the dataset. Ofcom’s 2015 Connected Nations report provided statistics on internet speed by postcode and on mobile coverage by local authority. Mobile connectivity was represented by ‘3 G signal available inside homes’, and a variable of the number of broadband lines was constructed by joining several counts of different speed lines together. Using data from Edubase, the Scottish schools database, the National Public Transport Access Nodes (NaPTAN) and Companies House, variables were constructed of how many schools are in a LSOA/DZ, a z-score converted indicator of how many companies were registered (some areas contain a disproportionate number) and a binary indicator of a train station in a LSOA/DZ.
To examine the effect of socio-economic status on reporting, we used measures of multiple deprivation calculated for each LSOA/DZ. The Index of Multiple Deprivation is a measure used in the UK to examine relative poverty/deprivation across different geographic areas. These combine measures across a range of different domains of ‘deprivation’. Each UK nation publishes a separate index that is not directly comparable (Noble et al. Citation2006). Abel, Barclay, and Payne (Citation2016) produced a UK-wide score based on the income and employment indicators from each nation. These are based on the English 2015 index, the Welsh 2014 index, and the Scottish 2012 index. This index was used to create a single UK-wide model, with binary variables for data from Scotland and Wales included to account for any source dataset variability (for instance, datazones having a lower population than LSOAs). The scores were normalised and converted to a percentile. A squared polynomial relationship was used to test for the expected parabolic distribution.
Nine per cent of small areas had no reports in this time range and so were recorded as ‘0’ observations. This breaks the assumption for Poisson regression that the variance is not larger than the mean and led to the choice of a negative binomial regression model.
Results
shows the results of the national dataset against four models with different ways of constructing the count variable (including/excluding data from official portals and superusers). shows (including both official portals and superusers) how the model performs against different groupings of reports made to FixMyStreet.
Table 4. (Continued.)
Table 3. Four regression models with different ways of constructing the count variable
Table 4. Model performance for different groupings of reports
The coefficients have been transformed into odds ratios, where each increase of 1 unit of a dependent variable represents an X times increased likelihood of a higher count in the independent variable versus the baseline odds of a report. Values below 1 are negative effects (reduce the odds of a report).
Controls
Unsurprisingly, areas had more reports when reports through their official website were used in the model. More significant is that these areas have more reports even when data through the official website is ignored. As official portals are often branded as ‘FixMyStreet’, this suggests that additional reports are made through FixMyStreet.com even when there is an official website available. This highlights the importance of controlling for client status even when data from client websites is excluded.
Rural drivers of reports
Controlling for the population of the LSOA/DZ (positive), the average age of residents in a LSOA/DZ (negative) and the effects of broadband and 3 G access, there is a negative effect of population density on reports. This reflects a slight increase in reports in more sparsely populated areas. There is an additional (significant, but weak for the size of model) effect of being a rural area only in Model 1, which contains both official portals and superuser reports. This suggests this finding of an additional effect (beyond that of reduced population density) is not robust, and this result likely reflects a different mix of categories of reporting in that dataset.
Looking at individual groups of reports, controlling for population, population density consistently has a negative effect (with no significant effect for public space issues). Additionally, there is a strong effect of an area being a rural LSOA/DZ for every grouping of reports. Most major types of reports were more common in urban areas, with the exception being environmental health and access issues (obstructions to rights of way for vehicles and pedestrians), and Road Safety.
Multiple deprivation
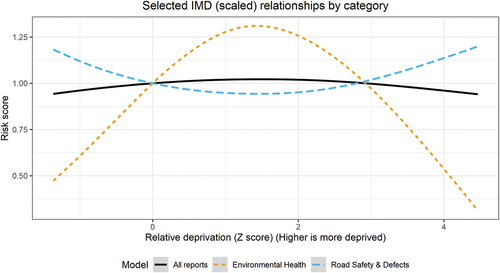
While most features of the model are consistent in direction and scale across the three models, this is not the case for multiple deprivation. Only Models 1 and 3 (which contained reports made by superusers) show the expected parabolic relationship, with a positive score for multiple deprivation (reports increase as there is more deprivation) and negative score for squared multiple deprivation (reports decrease for areas with the highest levels of deprivation). Excluding superusers, there is no significant polynomial effect and instead there is a negative linear relationship, where reports are less likely as an area gets more deprived. Looking at individual groups of reports, the parabolic relation remains for most categories (it is present but weaker for abandoned vehicles), but there is a negative linear relationship for environmental health and access issues, and an inverse parabola for road safety issues.
In this dataset, a higher score is a more deprived area. shows the different relationships between a standardised IMD score and the associated change in the risk factor depending if superusers are included. shows how road safety issues has the reverse pattern while environmental health has a more exaggerated version of the pattern over all reports. As these are z-scores, that the reversal points are not centred on 0 (and tend to be towards 2 standard deviations from the average small area) means the reversals should mostly be understood as being in the small number of areas with significantly higher deprivation than the average. In measures of multiple deprivation, the most deprived areas will be experiencing several kinds of overlapping deprivation and so residents will be disadvantaged in cumulative ways. This is reflected directly in much higher multiple deprivation scores for these areas, and in this case with distinct patterns of use of FixMyStreet from less-deprived areas, even after accounting for other potential factors.
Figure 2. Relationship between standardised deprivation score change in risk factor.
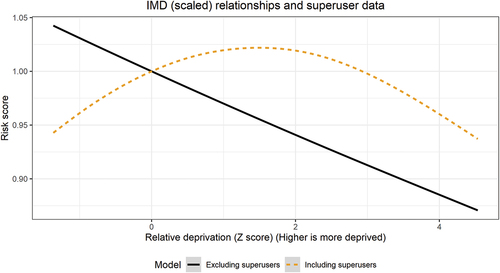
Figure 3. Comparison of reports of road safety issues and environmental health issues.
Guardianship
Infrastructure points lead to an increase of reports. There were more reports in areas with schools, more registered companies, and where there is a railway station was common across the four national models, making the effect robust against questions of data selection. Looking at individual groups of reports, the presence of registered companies has a significant positive effect across all types of reports. The effect of a railway station is positive for all, but insignificant for access and public space issues. The effect of schools is only significant (positive effect) for road safety issues.
Conclusion
This paper explored the applications of the FMS dataset to problems raised by the literature analysing data from 311 services and the implications of these problems for using citizen reports to target place-keeping services. In particular, we were concerned to understand whether a greater reliance on coproducing place-keeping services in this way might lead to growing inequalities between neighbourhoods, as the more socio-economically advantaged and able would report issues more often (Matthews and Hastings Citation2013). The most important finding is that the parabolic curve related to socio-economic status observed from other forms of contacting is present in the FMS dataset. This pattern is only observable on the inclusion of superusers, without whom there is only a negative effect of higher measures of deprivation. While there are concerns super-contributors may shape the end result of the data against the general interest, in the case of FMS, the effect of superusers seems positive. They lead to more reports from deprived areas than would otherwise be the case. There is, therefore, a risk of services becoming unequally distributed if citizen reports are prioritised over regular inspection. Such regular inspections have been cut as part of austerity measures, so there is a risk that this is exacerbating inequalities in environmental outcomes between deprived and less-deprived neighbourhoods, that had previously been mitigated by targeted service delivery (Hasting Citation2009b).
Examining a national dataset allows exploration how ‘smart city’ technology can be applied to rural services. While most FixMyStreet reports are made to urban local authorities, there are distinct categories of reports that have more use for rural authorities, beyond any direct effect of decreasing population density. Different kinds of infrastructure have positive effects on the number of local reports, but schools only seem to have an effect on reports of road safety. This reflects a broader idea of guardianship than explored in distance from home analysis, and is a conclusion that can be tested in all 311-like datasets without a requirement for additional information. It suggests people will report issues they pass by on their commute (railway stations) or while in areas with a high number of businesses, such as shopping streets.
This analysis has shown the limitations of looking for general explanations of FMS reports. Including all data only explain 8% of the variation (using a McFadden pseudo-R2). However, when restricted to certain categories, the explanatory power is higher for five out of eight categories, with the Access mode explaining 22% of the variation. Different kinds of reports have different drivers that need to be explored separately.
Finally, our analysis shows that for local government, citizen-reported environmental data can provide information about the perceived need for placekeeping. What it cannot do, is reflect the actual need. Automated sensors and regular scheduled surveys can provide more thorough coverage, but what this research suggests is that encouraging ‘superusers’ may help improve the overall results of user submitted data. As found by Hastings, Matthews, and Wang (Citation2021) such individuals in deprived neighbourhoods do a lot of the ‘work’ in maintaining neighbourhood quality, and so should not be dismissed as ‘the usual suspects’ but rather ‘everyday makers’ (Bang and Eva Citation1999). For researchers, or policymakers, exploring factors that drive this local need, user submitted data can be suggestive but will rarely be sufficient on its own to draw conclusions.
Disclosure statement
Alex Parsons is employed by mySociety, the charity that produces and runs FixMyStreet, as a researcher.
Additional information
Funding
Notes on contributors
Peter Matthews
Dr Peter Matthews, is Senior Lecturer in Social Policy at the University of Stirling. His research focuses on neighbourhood inequalities and local government measure to ameliorate these.
Alex Parsons
Alex Parsons is a senior researcher at the charity mySociety, studying the impacts and uses of civic technology on issue reporting, freedom of information and democratic information.
Elvis Nyanzu
Dr Elvis Nyanzu, is a researcher at Oxford Brooks Business School. Hi research interests include cities, regions, urban policy, GIS spatial analysis, poverty, inequality, housing and real estate markets.
Alasdair Rae
Alasdair Rae runs Automatic Knowledge Ltd, a spatial data, analytics and training company. Previously he was a Professor of Urban Studies and Planning at the University of Sheffield. He specialises in spatial data analysis and visualisation, often with a focus on neighbourhoods and deprivation.
References
- Abel, G. A., M. E. Barclay, and R. A. Payne. 2016. “Adjusted Indices of Multiple Deprivation to Enable Comparisons within and between Constituent Countries of the UK Including an Illustration Using Mortality Rates.” BMJ Open 6 (11): 11. doi:10.1136/bmjopen-2016-012750.
- Alford, J. 2002. “Why Do public-sector Clients Coproduce? toward a Contingency Theory.” Administration & Society 34 (1): 32–56. doi:10.1177/0095399702034001004.
- APSE. 2017. Redefining Neighbourhoods: A Future beyond Austerity? Trafford: Association for Public Service Excellence.
- Ashmore, F. H., J. H. Farrington, and S. Skerratt. 2015. “‘Superfast Broadband and Rural Community Resilience: Examining the Rural Need for Speed’, Scottish Geographical Journal.” Taylor & Francis 131: 265–278.
- Bailey, N., G. Bramley, and A. Hastings. 2015. “Symposium Introduction: Local Responses to “Austerity”.” Local Government Studies 41 (4): 571–581.
- Bang, H. P., and S. Eva. 1999. “The Everyday Maker: A New Challenge to Democratic Governance.” Administrative Theory & Praxis 21 (3): 325–341. doi:10.1080/10841806.1999.11643381.
- Bimber, B. 2001. “Information and Political Engagement in America: The Search for Effects of Information Technology at the Individual Level: Information and Political Engagement in America.” Political Research Quarterly 54 (1): 53–67. doi:10.1177/106591290105400103.
- Blank, G., M. Graham, and C. Calvino. 2018. “Local Geographies of Digital Inequality.” Social Science Computer Review 36 (1): 82–102.
- Bovaird, T. 2007. “Beyond Engagement and Participation: User and Community Coproduction of Public Service.” Public Administration Review 67 (5): 846–860. doi:10.1111/j.1540-6210.2007.00773.x.
- Bovaird, T., G. G. Van Ryzin, E. Loeffler, and S. Parrado. 2015. “Activating Citizens to Participate in Collective Co-Production of Public Services.” Journal of Social Policy 44 (1): 1–23. doi:10.1017/S0047279414000567.
- Bovarid, T., and E. Loeffler. 2008. “User and Community Co-Production of Public Services: Fad or Fact, Nuisance or Necessity?.” In TSRC Briefing Paper 12. Birmingham: Third Sector Research Centre.
- British Standards Institute. 2014. “Smart City Framework – Guide Customer Service to Establishing Strategies for Smart Cities and Communities.” London: British Standards Institute.
- Cantijoch, M., S. Galandini, and R. Gibson. 2016. “‘It’s Not about Me, It’s about My Community ‘: A mixed-method Study of Civic Websites and Community Efficacy’.” New Media & Society 19 (8): 1896–1915. doi:10.1177/1461444815616225.
- Clark, B. Y., J. L. Brudney, and S.-G. Jang. 2013. “Coproduction of Government Services and the New Information Technology: Investigating the Distributional Biases.” Public Administration Review 73 (5): 704–713. doi:10.1111/puar.12092.
- Clark, B. Y., J. L. Brudney, S.-G. Jang, and B. Davy. 2020. “Do Advanced Information Technologies Produce Equitable Government Responses in Coproduction: An Examination of 311 Systems in 15 U.S. Cities.” The American Review of Public Administration 50 (3): 315–327.
- Dempsey, Burton, N. Dempsey, and M. Burton. 2011. “Defining place-keeping: The long-term Management of Public Spaces.” Urban Forestry & Urban Greening 11 (1): 11–20. doi:10.1016/j.ufug.2011.09.005.
- Dutton, W. H., G. Blank, and D. Groselj. 2013. Cultures of the Internet: The Internet in Britain. Oxford Internet Survey 2013. Oxford Internet Institute, University of Oxford.
- Eckersley, P., and P. Tobin. 2019. “The Impact of Austerity on Policy Capacity in Local Government.” Policy and Politics 47 (3): 455–472. doi:10.1332/030557319X15613701303511.
- ENRD. (2018). “Smart Countryside Study Finland - Working Document.” 1–4. Retrieved from https://enrd.ec.europa.eu/sites/enrd/files/tg_smart-villages_case-study_fi.pdf
- Feigenbaum, J. J., and A. B. Hall (2015) “‘How High-Income Neighborhoods Receive More Service From Municipal Government: Evidence From City Administrative Data’.” http://scholar.harvard.edu/files/jfeigenbaum/files/feigenbaum_hall_respublica.pdf
- Gray, M., and A. Barford. 2018. “The Depths of the Cuts: The Uneven Geography of Local Government Austerity.” Cambridge Journal of Regions, Economy and Society 11 (3): 541–563. doi:10.1093/cjres/rsy019.
- Grimshaw, L. 2011. “Community Work as Women’s Work? the Gendering of English Neighbourhood Partnerships.” Community Development Journal 46 (3): 327–340. doi:10.1093/cdj/bsr034.
- Haklay, M. E. 2016. ”Why is Participation Inequality Important?” In European Handbook of Crowdsourced Geographic Information, edited by C. Capineri, M. Haklay, H. Huang, V. Antoniou, J. Kettunen, F. Ostermann, R. Purves, 35–44. London, United Kindom: Ubiquity Press.
- Hasting, A. 2009b. “Poor Neighbourhoods and Poor Services: Evidence on the “Rationing” of Environmental Service Provision to Deprived Neighbourhoods.” Urban Studies 46 (13): 2907–2927. doi:10.1177/0042098009344995.
- Hastings, A. 2007. “Territorial Justice and Neighbourhood Environmental Services: A Comparison of Provision to Deprived and better-off Neighbourhoods in the UK.” Environment and Planning. C, Government & Policy 35 (6): 896–917. doi:10.1068/c0657.
- Hastings, A. 2009a. “Neighbourhood Environmental Services and Neighbourhood ‘Effects’: Exploring the Role of Urban Services in Intensifying Neighbourhood Problems.” Housing Theory and Society 24 (4): 503–524.
- Hastings, A., N. Bailey, G. Bramley, R. Croudace, and D. Watkins. 2014. “‘Managing ’ the Middle Classes: Urban Managers, Public Services and the Response to Middle- Class Capture.” In Local Government Studies 40 (2): 203–223. doi:10.1080/03003930.2013.815615.
- Hastings, A., N. Bailey, G. Bramley, and M. Gannon. 2017. “Austerity Urbanism in England: The ‘Regressive Redistribution’ of Local Government Services and the Impact on the Poor and Marginalised.” Environment & Planning A 49 (9): 2007–2024. doi:10.1177/0308518X17714797.
- Hastings, A., P. Matthews, and Y. Wang. 2021. “Unequal and Gendered: Assessing the Impacts of Austerity Cuts on Public Service Users.” In Social Policy and Society, 1–21.
- Hero, R. E. 1986. “Explaining Citizen-Initiated Contacting of Government Officials: Socioeconomic Status, Perceived Need or Something Else?” Social Science Quarterly 67 (3): 627–635.
- Keep Britain Tidy. 2015. How Clean Is England? the Local Environmental Quality Survey of England 2014/15. London: Keep Britain Tidy.
- Levine, J. R., and C. Gershenson. 2014a. “From Political to Material Inequality: Race, Immigration, and Requests for Public Goods.” Sociological Forum 29 (3): 607–627. doi:10.1111/socf.12106.
- Matthews, P., and A. Hastings. 2013. “Middle-Class Political Activism and Middle-Class Advantage in Relation to Public Services: A Realist Synthesis of the Evidence Base.” Social Policy & Administration 47 (1): 72–92. doi:10.1111/j.1467-9515.2012.00866.x.
- Meijer, A. J. 2011. “Networked Coproduction of Public Services in Virtual Communities: From a Government-Centric to a Community Approach to Public Service Support.” Public Administration Review 71 (4): 598–607. doi:10.1111/j.1540-6210.2011.02391.x.
- Michener, J. 2013. “Neighborhood Disorder and Local Participation: Examining the Political Relevance of “Broken Windows”.” Political Behavior 35 (4): 777–806. doi:10.1007/s11109-012-9217-x.
- Naff, K. C. 2009. “Nancy Alfaro as an Exemplary Collaborative Public Manager: How Customer Service Was Aligned with Customer Needs.” a 69 (3): 487–493.
- Needham, C. 2008. “Realising the Potential of Co-production: Negotiating Improvements in Public Services.” Social Policy and Society 7 (27): 221–231. doi:10.1017/S1474746407004174.
- Noble, M., G. Wright, G. Smith, and C. Dibben. 2006. “Measuring Multiple Deprivation at the small-area Level.” Environment & Planning A 38 (1): 169–185. doi:10.1068/a37168.
- Norris, D. F., and C. G. Reddick. 2013. “Local E-Government in the United States: Transformation or Incremental Change?” Public Administration Review 73 (1): 165–175. doi:10.1111/j.1540-6210.2012.02647.x.
- Nyanzu, E. (2018) “FixMyStreet Meta Categories.” viewed 27 September 2019. https://github.com/mysociety/fms_meta_categories
- O’Brien, D. T. 2016. “‘Using Small Data to Interpret Big Data: 311 Reports as Individual Contributions to Informal Social Control in Urban Neighborhoods’, Social Science Research.” Elsevier Ltd 59: 83–96.
- O’Brien, D. T., D. Offenhuber, J. Baldwin-Philippi, M. Sands, and E. Gordon. 2017. “Uncharted Territoriality in Coproduction: The Motivations for 311 Reporting.” Journal of Public Administration Research and Theory 27 (2): 320–335.
- O’Brien, D. T., R. J. Sampson, and C. Winship. 2015b. “Ecometrics in the Age of Big Data Measuring and Assessing “Broken Windows” Using Large-scale Administrative Records.” Sociological Methodology 45 (1): 101–147. doi:10.1177/0081175015576601.
- Offenhuber, D. 2015. “Infrastructure legibility—a Comparative Analysis of open311-based Citizen Feedback Systems.” Economy and Society 8 (1): 93–112.
- Osborne, S. P. 2018. “From Public service-dominant Logic to Public Service Logic: Are Public Service Organizations Capable of Co-production and Value Co-creation?” Public Management Review 20 (2): 225–231. doi:10.1080/14719037.2017.1350461.
- Pak, B., A. Chua, and A. Vande Moere. 2017. “FixMyStreet Brussels: Socio-Demographic Inequality in Crowdsourced Civic Participation.” Journal of Urban Technology 24 (2): 65–87. doi:10.1080/10630732.2016.1270047.
- Parker, E. B. 2000. “Closing the Digital Divide in Rural America.” Telecommunications Policy 24 (4): 281–290.
- Parsons, A. (2017) “Dog Fouling and FixMyStreet.” Viewed 27 September 2019. https://research.mysociety.org/publications/dog-fouling-and-fixmystreet
- Parsons, A. (2019) “Explorer: FixMyStreet: Gender - Female.” Viewed 27 September 2019. https://research.mysociety.org/sites/explorer/fms/analysis/gender/female/method/
- Parsons, A. (2019a). “Super Contributors and Power Laws.” https://www.mysociety.org/2019/08/20/super-contributors-and-power-laws/
- Parsons, A. (2019b). “Service Bundles: Exploring the Many Uses of mySociety Services.” https://www.mysociety.org/2019/08/20/service-bundles/
- Przeybilovicz, E., M. A. Cunha, S. Geertman, C. Leleux, A. Michels, Z. Tomor, W. R. Webster, and A. Meijer. 2022. “Citizen Participation in the Smart City: Findings from an International Comparative Study.” Local Government Studies 48 (1): 23–47.
- Scheufele, D. A., and M. C. Nisbet. 2002. “Being a Citizen Online: New Opportunities and Dead Ends.” Harvard International Journal of Press/Politics 7 (3): 55–75.
- Schmidthuber, L., D. Hilgers, T. Gegenhuber, and S. Etzelstorfer. 2017. “The Emergence of Local Open Government: Determinants of Citizen Participation in Online Service Reporting.” Government Information Quarterly 34 (3): 457–469. doi:10.1016/j.giq.2017.07.001.
- Sepasgozar, S. M. E., S. Hawken, S. Sargolzaei, and M. Foroozanfa. 2019. “Implementing Citizen Centric Technology in Developing Smart Cities: A Model for Predicting the Acceptance of Urban Technologies.” Technological Forecasting and Social Change 142: 105–116. doi:10.1016/j.techfore.2018.09.012.
- Sjoberg, F. M., J. Mellon, and T. Peixoto. 2017. “The Effect of Bureaucratic Responsiveness on Citizen Participation.” Public Administration Review 77 (3): 340–351. doi:10.1111/puar.12697.
- Solymosi, R., K. J. Bowers, and T. Fujiyama. 2017. “Crowdsourcing Subjective Perceptions of Neighbourhood Disorder: Interpreting Bias in Open Data.” The British Journal of Criminology 58 (4): 944–967. doi:10.1093/bjc/azx048.
- Whitaker, G. P. 1980. “Coproduction: Citizen Participation in Service Delivery.” Public Administration Review 40 (3): 240–246. doi:10.2307/975377.
- White, A., and K. Trump. 2018. “The Promises and Pitfalls of 311 Data.” Urban Affairs Review 54 (4): 794–823. doi:10.1177/1078087416673202.
- Wu, W.-N. 2020. “Determinants of citizen-generated Data in a Smart City: Analysis of 311 System User Behavior.” Sustainable Cities and Society 59: 102167. doi:10.1016/j.scs.2020.102167.
- Xu, C. K., and T. Tang. 2020. “Closing the Gap or Widening the Divide: The Impacts of Technology-Enabled Coproduction on Equity in Public Service Delivery.” Public Administration Review 80 (6): 962–975. doi:10.1111/puar.13222.
- Young, M. M. 2021. “The Impact of Technological Innovation on Service Delivery: Social Media and Smartphone Integration in a 311 System 311 System.” Public Management Review. 1–25.