
Abstract
Background
There are few reliable osteological indicators to detect parity or infer puberty in skeletal remains. Nitrogen (δ15N) and stable carbon (δ13C) isotope ratios in human tissues can be affected by metabolically unbalanced states engendered by pregnancy or rapid growth, offering potential biomarkers.
Aim
This pilot study explores the potential of incremental dentine-collagen isotope ratio analysis to identify puberty and gestation.
Subjects and methods
Incremental dentine δ15N and δ13C profiles were produced by analysing third molars extracted as part of dental treatment of 10 individuals living in Sudan. Demographic and anthropometric data at the time of tooth extraction was available. Medical histories were unknown.
Results
Isotopic signatures potentially related to pubertal growth, with an average δ15N reduction of 0.78 ± 0.29‰, are indicated. Six isotopic signals suggestive of pregnancy, with an average δ15N decrease of 0.48 ± 0.22‰, are also observed. The timing, speed and amplitude of post-partum δ15N patterns seemingly infer infant feeding practices and maternal nutritional status.
Conclusion
This pilot study highlights the potential of incremental dentine isotope analysis for the reconstruction of early reproductive histories in skeletal remains. However, controlled studies with a larger human cohort are needed to validate these findings, establish isotopic signals linked to puberty and lactation, and improve chronology accuracy.
Introduction
Studying variables relating to reproduction has the potential to make important contributions to our understanding of societies, past and present, in terms of health, nutrition, physiological stress and culture (Sperling and Beyene Citation1997, p. 144). Indeed, while the age and rate at which individuals go through puberty and the length of their reproductive period are governed by established physiological factors, wide inter-individual variations linked to nutrition, growth, in utero stress and biological sex are seen (Soliman et al. Citation2014; English et al. Citation2020). In females, age at first gestation (AFG) is influenced by age at menarche -i.e. first occurrence of menstruation signalling the onset of fertility- as well as social norms and education (Marchetta and Sahn Citation2015). Fertility is similarly highly variable, being affected by malnutrition and cultural practices like deliberate birth spacing or infant feeding, with prolonged lactation creating a longer ovulation interval (Delgado et al. Citation1982). Thus, wide disparities in reproduction patterns are observed between and within societies depending on subsistence practices, food availability and cultural practices. In turn, gestation has a significant impact on the physical health, nutritional status and mortality of both mothers and offspring. Pregnancy and lactation cause a substantial increase in maternal nutritional demand, thus gestations occurring at high frequency or in challenging environmental conditions increase the risk of malnutrition and morbidity, with subsequent repercussions on population growth and health (Black et al. Citation2008; Victora et al. Citation2008).
However, these significant aspects of life are a neglected area of study for past societies, especially archaeological populations, due to the challenge of uncovering information related to puberty or parity. For past populations, few references in early historical texts exist (Fildes Citation1986) and the few existing skeletal indicators for pregnancy are mostly unsatisfactory.
Osteological indicators for parity include ‘pubic tubercule extension’ (PTE), which results from the increased stimulation of abdominal muscles during the later stage of pregnancy and childbirth (Cox Citation2000). PTE is positively associated with the number of obstetric events but does not inform on fertility, AFG or inter-birth interval (IBI) (Cox Citation2000). Pre-auricular sulcus and pubic pitting are often referred to as ‘parturition scars’, yet these indicators are not specific to parturition since they have multiple causes, including hormonal and physical stress on pelvic articulation experienced during childbirth (Cox Citation2000). In addition, the skeletal remains of women who gave birth often lack both these markers. ‘Parturition lines’, based on the recording and subsequent preservation of microstructural alterations associated with gestational metabolic changes in developing teeth, can be observed in histological dentine sections and may indicate AFG and IBI if these events occur before tooth development is completed by about 23 years (Dean and Elamin Citation2014). However, parturition lines do not always form during pregnancy, they can result from other stress events, and their estimated timing is inaccurate.
Puberty encompasses sexual and physical maturation, including the development of secondary sex characteristics (e.g. breast, genitals and pubic hair) and a peak growth period (Viner Citation2008). Puberty consists of a clear sequence of stages over time, affecting endocrine, skeletal, muscular and reproductive systems, with puberty completion taken to indicate that an individual has achieved its adult body stature and is able to reproduce (Dorn and Biro Citation2011). James Tanner introduced the concept of pubertal status being linked to growth patterns, as summarised by the ‘tempo of growth’ (i.e. the timing and intensity of peak growth velocity) (Cole Citation2020). Puberty onset is marked by growth acceleration until ‘peak height velocity’ (PHV) is reached (Marshall and Tanner Citation1986). As growth starts to slow down, girls experience menarche and boys develop their full adult voice (Hägg and Taranger 1982). The growth spurt concludes with the fusion of long-bone epiphyses and pelvis maturation (Marshall and Tanner Citation1986). The physical transition into adulthood denoted by puberty may not correspond with mental and cultural maturation processes (Arnett Citation2007). Thus, individuals starting puberty early may appear older, and late developers may appear younger, creating a dichotomy between physical and psychosocial identities. In this paper, we refer to the transition between childhood and adulthood as adolescence, a period marked by the onset of puberty and the ability to function as an independent adult (Lewis et al. Citation2016).
In contemporary populations, developmental age is generally established using Tanner scales to assess secondary sexual characteristics, an intrusive and often inaccurate process (Dorn and Biro Citation2011); a reason proposed by English et al. (Citation2020) to explain boys’ underrepresentation in studies on the timing of puberty in humans. Indeed, in girls, menarche provides an alternative and precise measure, a set point in time that can be self-reported accurately. Physical maturation is also established by generating individual linear growth velocity curves using longitudinal data and extracting the timing of growth landmarks like age at PHV (Cole Citation2020). However, these two methods are only applicable to living individuals. A third method, assessing the developmental stage of bone fusion or teeth formation using x-ray, is restricted to medical investigations of growth disorders in living individuals but has been adapted for use with archaeological skeletal remains to help establish the age when important stages of pubertal development were reached in past populations (Shapland and Lewis Citation2013). Nevertheless, while osteological assessment helps establish the timing of growth and therefore puberty, in archaeological populations, the method relies on studying individuals who did not survive into adulthood, and thus may not be representative of the population; and accuracy depends on skeletal preservation (Henderson and Padez Citation2017).
Stable light isotope analysis may offer an alternative biomarker to help identify both the pubertal growth spurt and pregnancy in skeletal remains. Indeed, δ15N of body tissues primarily reflects the diet of an individual but is also affected by their metabolic status, with anabolic states like growth and pregnancy generally resulting in reduced δ15N (Fuller et al. Citation2004; Waters-Rist and Katzenberg Citation2010; Reitsema Citation2013). Isotopic variations linked to growth are suggested in animal studies, yet they have not yet been investigated in incremental tissues of modern living human beings (e.g. Trueman et al. Citation2005; Warinner and Tuross Citation2010). The δ15N reduction associated with tissue accretion means that incremental dentine-collagen isotope ratio analysis (IDIA) could be a powerful tool to investigate the pubertal growth spurt -potentially establishing the ‘tempo of growth’-. The close relationship between growth and sexual development means that IDIA could also indirectly aid the study of sexual maturation in skeletal remains.
Isotopic shifts linked to pregnancy have been successfully measured in hair (Fuller et al. Citation2004; D'Ortenzio et al. Citation2015). IDIA achieves a lower temporal resolution than hair analysis, but teeth are much more commonly preserved in archaeological deposits and allow retrospective data collection beyond the last few years before death or sampling (Wilson and Gilbert Citation2007, p. 156; Henderson et al. Citation2014). Like hair, dentine in teeth contains a significant amount of protein, forms sequentially, and does not remodel (Eerkens and Bartelink Citation2013). Teeth are also highly resistant to taphonomic damage, and third molars (M3) typically form between 8 and 23 years of age (AlQahtani Citation2009), making them a viable alternative tissue to study reproduction patterns -i.e. sexual maturation including the start of fertility, and potential subsequent pregnancies- during late adolescence and early adulthood.
This study, therefore, aims to explore the potential of IDIA to detect short-term isotopic changes from anabolic physiological events linked to either puberty or pregnancy and reconstruct early reproductive life. We do this by analysing M3 teeth from ten contemporary individuals for whom some basic demographic, anthropometric and geo-political information is available; including eight women suspected of having experienced pregnancy during M3 formation, although medical and obstetric histories were unknown.
Nitrogen and carbon stable isotopes
Elements naturally exist in various isotopic forms with marginally different atomic masses, which affect the rate at which each isotope enters chemical reactions (Van der Merwe Citation1982). Thus, as elements go through metabolic processes, the relative abundance of their isotopes changes, a phenomenon known as fractionation or discrimination (Phillips Citation2012). This means that the isotope ratio of an individual reflects the isotopic composition of their diet plus a fractionation factor (Phillips Citation2012). This principle has enabled the reconstruction of dietary histories, environments and the identification of metabolic disturbances from nutritional, pathological or physiological events, using isotope ratios.
Isotopes as biomarkers of diet
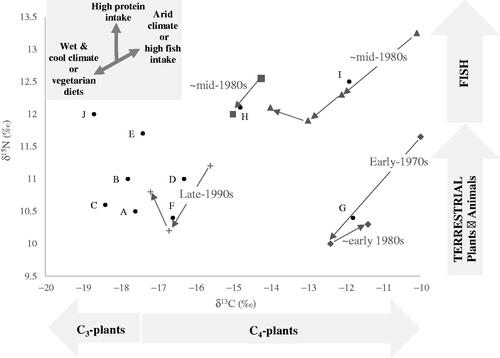
The isotopic values of body proteins like dentine-collagen predominantly reflect the isotopic composition of the protein component of the diet at the time the tissue is formed (Ambrose and Norr Citation1993; Jim et al. Citation2006). Dietary carbohydrates and lipids have a lesser influence on δ13C values of body proteins, contributing up to 25% of the carbon skeleton used in the de novo synthesis of non-essential amino acids (Martinez del Rio et al. Citation2009; Fernandes et al. Citation2012). The main factor influencing δ15N values of foods is their place in the food chain, with an average stepwise δ15N increase of 3.6% between each trophic level (Fuller et al. Citation2012). Thus, δ15N values of body proteins can help differentiate plant-based and animal-based protein intake (Petzke et al. Citation2005, ). The δ13C change with each trophic level is less pronounced, with average discrimination between diet and muscles of 0.8 ± 1‰ (Chisholm et al. Citation1982; Newsome et al. Citation2010). Still, combining δ15N and δ13C can also help distinguish marine resources subsistence from terrestrial-based diets since aquatic food chains are longer (Grupe et al. Citation2009, ). However, δ13C is mostly used to differentiate plants with different photosynthetic pathways at the base of the human food chain (Wright and Schwarcz Citation1999, ). The majority of economically important plants like wheat, rice and tubers are C3-plants, which have δ13C values of −26.5 ± 4‰ (Van der Merwe Citation1982). C4 plants like maize, millet, sorghum, sugar cane and other tropical grasses, display δ13C values of −12 ± 2‰.
Figure 1. Biplot of bulk δ15N and δ13C for the 10 M3, including values during various consecutive phases of M3 formation for individuals with indications of major dietary and/or environmental shifts.
Isotopes as environment indicators
Food isotope values are also influenced by their environmental conditions. Generally, arid, acidic, saline or anaerobic waterlogged environments are associated with increased δ15N and δ13C compared with wet colder climates, with particularly elevated δ15N observed in animals living in salt marshes and coastal ecosystems (Ambrose Citation1991; Tieszen Citation1991; Britton et al. Citation2008, ). The effect of aridity on δ15N is intensified when animals become water-stressed since inadequate fluid intake leads to increased excretion of 15N-depleted urea to help conserve water, resulting in increased δ15N of body tissues (Ambrose Citation1991). Severe water stress may also lead to increased δ15N in humans, although the effect has not been studied.
Isotopes as nutritional and physiological biomarkers
The isotopic composition of body proteins like dentine-collagen is also affected by fractionation associated with protein metabolism. In metabolically stable individuals meeting their nutritional requirements for protein and energy, δ15N discrimination between diet and collagen tissues (Δδ15Ndiet-collagen) is relatively stable at 3–5‰ (Bocherens and Drucker Citation2003). The higher offset of 6‰ observed in well-nourished individuals in two human-based studies could result from their reported protein intake being significantly higher than their requirements (Hedges et al. Citation2009; O'Connell et al. Citation2012). Indeed, a positive correlation between Δδ15Ndiet-collagen and protein intake above requirements exists, which may be linked to the increased rate of deamination and 14N-enriched urea excretion associated with the breakdown of amino acids in excess of requirement (Tomé and Bos Citation2000; Martinez del Rio et al. Citation2009). Thus, in metabolically stable individuals, excessive protein intake leads to raised δ15N, independently of the isotopic composition of the diet ().
Isotopes as markers of catabolic states
Catabolic states result from insufficient or poor-quality dietary protein intake; and during catabolism, the rate of breakdown of less vital body proteins like muscles increases to provide amino acids for the synthesis and replacement of more essential body proteins (Mekota et al. Citation2009). Such ‘recycling’ of body amino acids can be likened to an internal trophic effect and leads to raised δ15N of body proteins. Inadequate protein intake also results in the increased contribution of dietary carbohydrates and lipids -or even body fat stores when energy intake is insufficient-, to provide carbon for amino acid synthesis (Newsome et al. Citation2010; Nardoto et al. Citation2011; Iacumin et al. Citation2016). Since lipids are generally depleted in 13C, inadequate protein intake, particularly when accompanied by energy deficiency, leads to reduced δ13C (Tieszen Citation1991).
Thus, in patients with anorexia or non-disease-related protein-energy malnutrition, catabolic states are associated with δ15N increase of up to 1.9‰ and δ13C decrease of up to 5.4‰ (Hobson et al. Citation1993; Mekota et al. Citation2009; Neuberger et al. Citation2013). The wide variations in the extent and rapidity of δ15N and δ13C shifts during catabolic states may be related to varying diets, the original amount of body fat and protein reserves, and the extent of weight loss and accompanying physiological states like growth, pregnancy or disease (Neuberger et al. Citation2013). Pathological states like systemic infections, fevers, diarrhoea, cancer or AIDS can have a similar catabolic effect, therefore isotopic responses to such conditions can mimic protein deficiency (Reitsema Citation2013).
Isotopes as markers of anabolic state
Anabolic states occur when body protein synthesis increases to enable extra tissue deposition during juvenile growth, pregnancy, recovery from starvation, or tissue repairs following trauma (Waters-Rist and Katzenberg Citation2010; Webb et al. Citation2015). Anabolic states are characterised by increased efficiency of protein metabolism, including enhanced direct routeing of amino acids towards protein synthesis, thus by-passing processes creating isotope fractionation like deamination and transamination, and reduced 14N excretion through decreased amino acids oxidation and increased urea salvage (Kalhan Citation2000). Improved dietary protein utilisation through decreased amino acid oxidation has been demonstrated in association with pubertal growth (Beckett et al. Citation1997).
Isotopes and growth
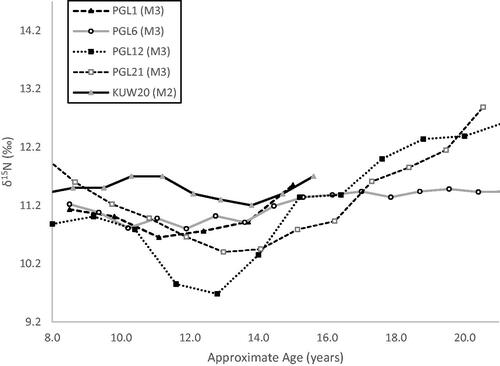
An inverse correlation between growth rate and δ15N enrichment of animal tissues has been shown (e.g. Trueman et al. Citation2005; Warinner and Tuross Citation2010; Reitsema and Muir Citation2015; Webb et al. Citation2016). An inverse relationship between weight gain and δ13C has also been observed in a small-scale controlled feeding animal study, which recorded hair isotope values about 3.9‰ lower for δ13C and about 0.9‰ lower for δ15N in faster-growing pigs (Warinner and Tuross Citation2010). A similar isotopic response, inversely correlated to growth rate, is expected during infancy or puberty growth spurts in humans, although early work by Waters-Rist and Katzenberg (Citation2010), based on long bones from protohistoric individuals aged 7–19 years, suggests that growth has a minimal influence on the isotopic composition of human bone-collagen. Indeed, the bone turnover rate has since been shown to be too slow to record metabolic shifts in isotopic values previously recorded in hair studies (Nitsch et al. Citation2010; Beaumont Citation2020). Certainly, δ15N reductions, -unexplained by dietary or environmental changes on the basis of a lack of accompanying δ13C variations-, are seen in dentine isotopic profiles derived from second or third molars of both Seventeenth century Scottish soldiers and Nineteenth century Irish populations (Beaumont and Montgomery Citation2016, ; Millard et al. Citation2020). The recurrence of the isotopic phenomenon across different historical periods or locations hints at an anabolic physiological event, an interpretation reinforced by the temporal agreement of the isotopic dip with the putative pubertal growth spurt. The observed δ15N reductions vary in intensity (up to 3.1‰), timing and duration, potentially illustrating the genetically driven variety of growth patterns seen within populations, but also variations introduced by differing nutritional status (Veldhuis et al. Citation2005).
Figure 2. Incremental dentine δ15N profiles of Seventeenth century Scottish soldiers and Nineteenth century Irish men from Kilkenny Union workhouse famine cemetery ( adapted from Beaumont and Montgomery Citation2016; Millard et al. Citation2020).
The effect of growth on isotope values of incremental tissues has not been established in living human beings, however, an inverse correlation between weight gain and δ15N values has been noted during pregnancy (Fuller et al. Citation2004). δ15N values inversely correlated with weight gain were also noted in patients recovering from anorexia -i.e. underweight individuals, transferring from either a catabolic or steady-state nitrogen balance to an anabolic state, as they received treatment to gain weight- (Mekota et al. Citation2009). δ15N reductions of 0.6–2.2‰ were seen by Mekota et al. (Citation2009). Re-instatement of positive energy intake during the starvation recovery also incurred a 1.5–5.7‰ δ13C increase, reflecting reduced reliance on adipose tissue to provide carbon skeleton for de novo protein synthesis (Mekota et al. Citation2009).
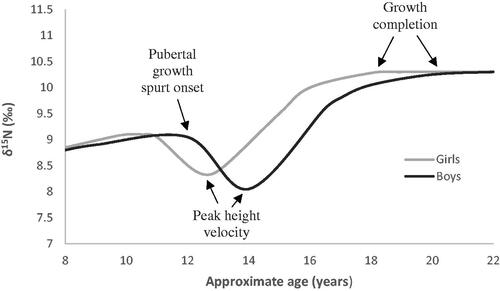
presents projections of the nitrogen isotopic changes expected during the pubertal growth spurt, based on normalised linear growth velocity patterns in European children and our understanding of the relationship between growth and δ15N values (Veldhuis et al. Citation2005). Based on the assumption that δ15N variations linked to pubertal growth are inversely proportional to growth rate, then the point when δ15N begins to decrease is considered to indicate growth spurt initiation, with the resultant lowest δ15N value highlighting PHV, and the restored δ15N value denoting growth completion (). Such standardised isotopic curves, however, mask non-conformities among individual children in the timing and tempo of pubertal growth, especially for children of different ethnic origins or living in different geographic, socioeconomic or historical environments (Veldhuis et al. Citation2005).
Figure 3. The exemplar of incremental dentine δ15N profiles during pubertal growth (based on linear growth patterns defined by Veldhuis et al. Citation2005).
Isotopes during gestation and breastfeeding
During healthy (human) pregnancies, maternal δ15N values at birth are on average 0.8‰ (0.3–1.3‰) lower than δ15N values recorded at conception (Fuller et al. Citation2004; D'Ortenzio et al. Citation2015). However, no overall δ15N changes over the 9 months period have been noted in gestations associated with nutritional stress (Fuller et al. Citation2005). δ13C shifts have not been observed during pregnancy (Fuller et al. Citation2004, Citation2005; D'Ortenzio et al. Citation2015).
The effect of lactation on maternal isotopic composition is not yet fully understood, however, there are indications from both animal and human studies that lactation may engender isotopic changes in mothers (e.g. Kurle Citation2002; Fuller et al. Citation2006; Habran et al. Citation2010; Reitsema Citation2012). Reitsema and Muir (Citation2015) reported that lactating rhesus macaques exhibit significantly lower δ15N values (by 0.3‰) and higher δ13C values (by 0.4‰) than non-lactating females eating the same diet. One explanation suggests that the excretion of milk leads to lower δ15N values in maternal tissues because milk is enriched in 15N (Kurle Citation2002). However, increased bulk δ15N values of milk relative to the mother are seen in marine animals (Kurle Citation2002), but not in humans (de Luca et al. Citation2012; Romek et al. Citation2013; Herrscher et al. Citation2017) or other animals (Jenkins et al. Citation2001; Reynard and Tuross Citation2015). In humans, δ15N values for milk proteins appear to match those of mothers' fingernails (Fuller Citation2003); instead, breastmilk 15N-depletion is thought to be linked to its relatively high concentration of 14N-enriched urea, while the relatively low δ13C values come from high levels of 13C-depleted fat rather than 13C-enriched proteins (Schoeller Citation1999; Braun et al. Citation2013). An alternative hypothesis is that, although ultimately lactation does not result in a positive nitrogen balance since the extra tissue produced (milk) is then excreted, lactogenesis still leads to metabolic adaptations akin to anabolic states to conserve nitrogen for milk synthesis (with the possible difference that urea excretion shifts from urine to milk), resulting in lower δ15N values of maternal tissues, as seen during pregnancy.
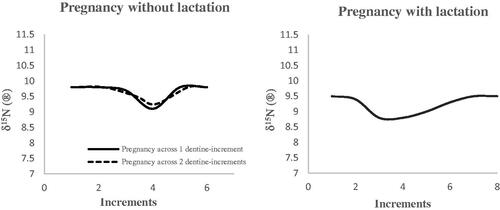
shows the modelling of δ15N variations expected in maternal dentine during pregnancy and breastfeeding, based on our understanding of the effect of those two physiological events on δ15N values from the limited data available. The projection for the isotopic effect of lactation is based on the practice of exclusive breastfeeding for the first 6 months of life and continuation until the child is 2 years or beyond, in line with recommendations from the World Health Organisation (World Health Organization (WHO) United Nations Children’s Found (UNICEF) Citation2003).
Figure 4. The exemplar of maternal incremental dentine δ15N profiles during pregnancy and lactation (based on Fuller et al. Citation2004; D'Ortenzio et al. Citation2015; Fuller et al. Citation2006; Herrscher et al. Citation2017).
Incremental dentine isotope analysis (IDIA)
Primary dentine grows sequentially, forming successive layers from the dentine-enamel junction in the tooth crown to the root apex (Hillson Citation1996). Once formed, dentine-collagen does not remodel, therefore providing a sequential record of biological signals at the time of teeth formation (Fuller et al. Citation2003). By cutting serial sections perpendicular to the tooth axis, the isotopic history of an individual can be reconstructed, allowing the investigation of isotopic changes over time. Since the timing of teeth formation is well-established and differs between each tooth type, a chronology of the isotopic changes can be created, spanning in utero to early adulthood life (AlQahtani Citation2009).
Reduction of the minimum section size required for analyses to 0.75–1mm has significantly increased temporal resolution to 8–9 months, which should enable the detection of shorter-term events like pregnancy (Beaumont et al. Citation2013a, Citation2013b). However, growth lines do not form exact horizontal lines, instead growing at an angle, which increases towards the root tip (Eerkens et al. Citation2011). Cutting horizontal sections thus creates an overlap between each successive sample, resulting in attenuated isotopic signals and providing isotopic trends rather than absolute time-averaged values (Beaumont et al. Citation2013a, Henderson et al. Citation2014). This is particularly significant for segments from the root, where the angle of the growth lines is more acute. Nevertheless, IDIA has been successfully applied to help identify the duration of breastfeeding and infant feeding practices (e.g Dupras and Tocheri Citation2007; Howcroft et al. Citation2012, Citation2014; Eerkens and Bartelink Citation2013; Sandberg et al. Citation2014), and malnutrition and recovery from food-shortages, including dietary changes associated with food relief (Beaumont et al. Citation2015; Beaumont and Montgomery Citation2016).
Diet, nutrition and reproductive health in Sudan
Sudanese diet remains traditional, based on a limited choice of local foods, with cereals like sorghum, vegetables like cassava, and milk forming the basis of the diet across the country (Food and Agriculture Organisation of the United Nations (FAO) Citation2010). Proteins are mostly derived from dairy products and groundnuts, with an overall relatively low intake of animal proteins like meat or eggs, although fish can make an important contribution to the diet in regions along the Nile and its tributaries, the Red Sea coast or river systems in the southern regions (Food and Agriculture Organisation of the United Nations (FAO) Citation2020).
Prolonged political unrest and recurring droughts have resulted in seasonal to chronic food shortages, with the first severe drought recorded in 1967–1973 in the Sahel belt, while southern regions experienced particularly severe famines throughout the 1980s and 1990s (Tambel et al. Citation2014). Such circumstances have resulted in substantial population displacements from the regions most affected by conflicts and famines towards Khartoum.
In Khartoum, contemporary women generally meet their overall energy and protein needs, although the risk of essential amino-acids deficiency remains since proteins are mostly derived from plant sources with lower protein quality (Nyuar et al. Citation2012). The likelihood of Sudanese women developing protein-energy malnutrition is increased during gestation since their food intake is generally unchanged -or even reduced as a result of food aversions or cultural food avoidances- despite the increased nutritional requirements associated with pregnancy (Karrar-Osman Citation1985; Harrison Citation1997). Furthermore, 7% of women are married before the age of 15, with nearly a quarter giving birth before 18 years of age, and women in poorer rural areas generally giving birth at even younger ages (Oxfam and Ministry of Health (MoH)) Citation1997; UNICEF Citation2016). A study by Otor and Pandey (Citation1998) reported that first births occur on average at 19.7 years. Such relatively young AFG is likely linked to both the young age of women at marriage and limited access to contraception (Rogers and Earnest Citation2014; World Health Organization (WHO)) Citation2011). Gestation during adolescence, a period of increased nutritional requirement for the mother who is still growing, further increases health and nutritional stress during pregnancy.
Certainly, high levels of maternal malnutrition are observed outside of the capital city, especially in rural areas, with half of the women being reported as severely underweight (BMI <18.5) in the rural Red Sea region (Oxfam and Ministry of Health (MoH)) Citation1997). Such widespread maternal malnutrition is supported by the high prevalence of maternal morbidity and mortality associated with gestation and parity (a third of women experience complications), low-birth-weight babies (25%) and infant mortality (8%) (World Health Organization (WHO) 2015; UNICEF Citation2016).
In Sudan, the average IBI is 2.5–3.5 years, linked to the universal practice of prolonged breastfeeding (Tyler et al. Citation2014). Indeed, prolonged breastfeeding for 12–30 months is generally practiced across Sudan, with half of the babies still being breastfed at 24 months of age (Tyler et al. Citation2014). The risk of maternal malnutrition is further influenced by infant feeding practices since prolonged breastfeeding significantly increases requirements for both proteins and calories (Black et al. Citation2008). In Ethiopia, up to 1 in 5 lactating mothers are undernourished (Boke et al. Citation2021). However, the effect of infant feeding on the nutritional status of Sudanese mothers is lessened since many women traditionally increase their intake post-partum to compensate for loss during childbirth and enhance milk production (Karrar-Osman Citation1985).
Data on supplementary feeding, especially bottle feeding, is highly variable. A 1987 survey in rural Khartoum indicated that 62% of babies were introduced to bottle feeding relatively early in their life, yet in a 2014 study, as few as 17% of mothers in Khartoum supplemented breast milk with bottle feeding from the age of 4–6 months (Harrison Citation1997; Tyler et al. Citation2014). ‘Household’ supplementary food is generally introduced between 4 and 6 months of age in towns, although weaning is more likely to occur from the later age of 9 months in rural areas (Oxfam and Ministry of Health (MoH)) Citation1997; Harrison Citation1997).
Subjects and methods
Materials and subjects
A sample of 10 M3 teeth was randomly chosen from a larger assemblage, collected as part of a separate study, alongside basic (self-reported) demographic and (measured) anthropometric information during routine dental treatment in Khartoum. The 10 selected teeth represent a cross section of the Khartoum population in terms of age, ethnicity and body mass index (BMI), although only 2 of the teeth are from males (). Medical histories were reported by some of the women who donated teeth to the larger tooth assemblage, although unfortunately, pubertal, obstetric, medical or dietary histories were not available for the teeth selected for this study. All selected teeth were free of caries or excessive wear.
Table 1. Demographic and anthropometric data of the 10 individuals.
Ethical approval was granted by the Ethics Committee at the Khartoum Centre for Research and Medical Training (KCRMT, date 06-03-2012). The teeth and associated data were processed through Ethical Tissue at the University of Bradford, ensuring that conditions of patient anonymity and informed written consent were met.
M3 teeth were chosen to investigate early reproductive history since they are the last teeth to develop, generally between the ages of 8.5 and 23.5 years (AlQahtani Citation2009). Teeth from this assemblage are particularly appropriate since many Sudanese women experience their first gestation(s) during this period (Otor and Pandey Citation1998). While they were not available for use in this study, five women who donated teeth to the larger tooth assemblage for the Dean and Elamin (Citation2014) study are known to have experienced pregnancies during the formation of their M3 teeth. The five women experienced their first pregnancy at the average age of 15.6 years, with the earliest recorded AFG at 12 years, and displayed an average IBI of 3.5 years (Dean and Elamin Citation2014). Aspects of contemporary Sudanese life such as diets containing few processed foods and the high prevalence of breastfeeding, mean that the results could also potentially be extrapolated to anthropological studies of past or traditional-subsistence populations.
Incremental dentine isotope analysis
The teeth were sectioned to obtain a full-length longitudinal section of dentine. Surface debris and identified secondary or tertiary dentine were removed by air-abrasion using a slow-speed tungsten-carbide rose-head bur. Each root was demineralised using the modified Longin method (O’Connell and Hedges Citation1999) and sequential dentine-collagen was obtained using method 2 in Beaumont et al. (Citation2013a). Teeth were demineralised in 0.5 M hydrochloric acid at 4 °C. Each demineralised root was cut into approximately 1 mm regular sections using a scalpel, with each segment then placed in sealed microtubes, with pH3 acidified water at 70 °C for 48 hours, to enable denaturation of the collagen fibrils. Filtration was not carried out to prevent sample size reduction. Instead, samples were centrifuged prior to freezing and freeze-drying to concentrate contaminants to the base of the microtube.
δ15N and δ13C were measured by combusting 0.5 mg of each dentine sample. Samples were measured in duplicate in the University of Bradford Stable Light Isotope Laboratory in a Thermo Flash EA 1112 with the separated N2 and CO2 then introduced to a delta plus XL via a Conflo III interface and compared with laboratory and international standards (IAEA 600, CH3, N1) that were interspersed through each analytical run.
The C/N ratios obtained from each dentine sample are within the recommended 3.1–3.5 range, confirming good preservation of the collagen (Van Klinken Citation1999), which would be expected from modern teeth which have never been buried. The results are expressed using the delta (δ) notation in parts per thousand (‰) relative to the international standards Vienna-Pee Dee Belemnite for δ13C and AIR for δ15N. The analytical error was determined at ±0.2‰ or better.
An approximate chronological age (based on the average timing of M3 formation) was assigned to each segment and isotope ratios profiles for each tooth were plotted using Excel software (Beaumont and Montgomery Citation2015). Nutritional stress, dietary and environmental shifts were identified using δ13C, enabling the isolation of isotopic signals related to other metabolic changes. The timing of M3 teeth formation is notably variable (Mincer et al. Citation1993). M3 formation begins on average around age 8.5 years, but can start any time between 7 and 13 years (Hillson Citation1996; AlQahtani Citation2009). Isotopic changes were therefore ‘matched’ to known extreme climate events or famines, allowing to ‘correct’ (or confirm) isotopic timelines. The estimated ages stated in the rest of this paper refer to ‘corrected’ chronologies. Demographic data available for each subject and information about modern Sudanese geo-political history and culture were used to help interpret isotopic variations for each profile.
Results
Calculated bulk isotope values, the range of incremental isotope values and the temporal resolution obtained for each tooth are shown in . Temporal sequence profiles for each tooth are shown in . Results potentially relating to puberty and pregnancy are summarised in and . Analysis to define the baseline diet and environment along with the detailed interpretation of dietary and environmental changes will be published in a separate paper.
Figure 5. The proposed interpretation of δ15N and δ13C profiles in relation to pubertal growth, for women who display life events or stress during late childhood and adolescence.
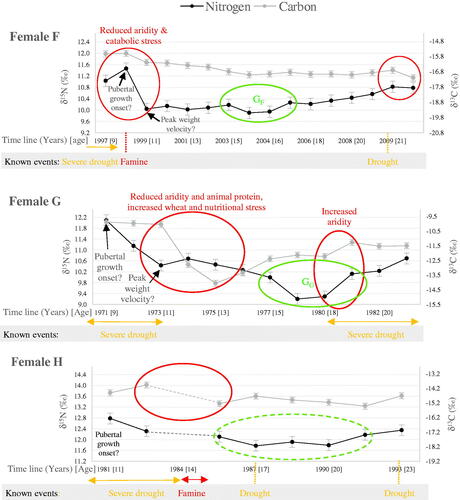
Figure 6. The proposed interpretation of δ15N and δ13C profiles over the time of M3 formation, in relation to pubertal growth, for the two men.
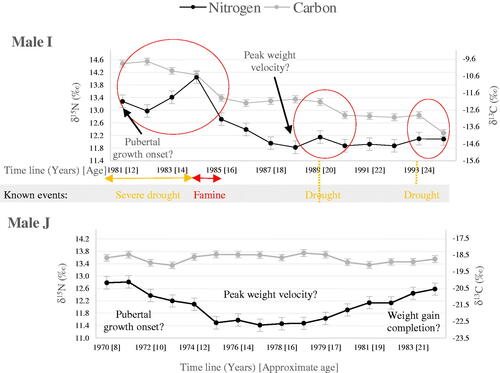
Figure 7. The proposed interpretation of δ15N and δ13C profiles in relation to pubertal growth, for women with no obvious life events during late childhood and adolescence.
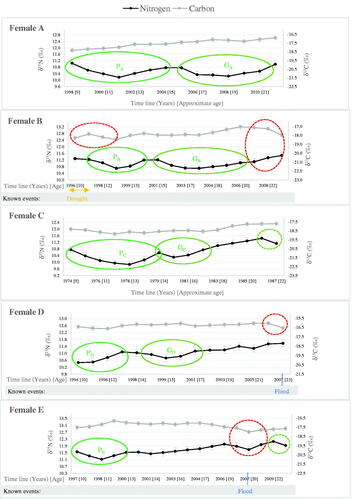
Table 2. Summary of isotope results for the 10 M3.
Table 3. Summary of the isotope data proposed to represent pubertal growth.
Table 4. Summary of the isotope data interpreted as gestational events.
δ15N and δ13C temporal sequences
The dentine sections obtained represent, on average, periods of 11.9 ± 2.7 months, varying from 9 months for female E to 18 months for female H. Variations in temporal resolution between teeth are introduced by the differing root length. Such timing remains approximate because of the averaging produced by the method.
Small isotopic changes can result from the collagen preparation method and instrument imprecision, therefore only δ15N and δ13C variations greater than 0.3‰ are considered as potentially reflecting behaviourally meaningful events (Eerkens et al. Citation2016).
Dietary, environmental and catabolic events
Since δ13C levels vary with diet, environment and nutritional stress, but are not thought to be significantly affected by other metabolic events (e.g. anabolic states of pubertal growth or pregnancy), δ13C is used to isolate dietary and environmental changes. Four individuals have highly variable δ13C values, indicative of major events ( and ). δ13C shifts indicative of dietary and/or environmental changes are suggested for female H before she enters her teenage years; although the lower temporal resolution (linked to the shorter root length of the tooth) and some missing data (due to a misplaced sample) render full interpretation challenging (). Male I also experiences three major δ13C shifts at the estimated ages of 13, 20 and 24 years (). Both H and I display substantial δ13C and δ15N reductions at the estimated ages of 14 and 15 years, respectively, which corresponds with the severe 1980–1984 drought across the Sahel Belt and the subsequent 1984–1985 famine (Teklu et al. Citation1991; , Tambel et al. Citation2014). The isotopic profiles exhibited by female H and male I at the start of M3 formation -including the high δ15N values compared with other individuals- are therefore understood to reflect increased isotopic values of local plants and animals from water stress, with the subsequent isotope shift highlighting the end of the drought. For male I, nutritional stress, suggested by a short but substantial δ15N peak also coincides with these elevated isotopic values and could have resulted from the ensuing famine, substantiating an environmental interpretation (). The first isotopic shift for male I is therefore interpreted as showing concurrent events in the form of decreased aridity and nutritional stress. The two further δ13C shifts displayed by male I also relate to two known localised droughts in 1989 and 1993; while two small δ13C peaks of 0.6‰ for H correspond with two recorded droughts in 1987 and 1993 ( and , Tambel et al. Citation2014).
The overall δ13C and δ15N patterns for female G at the start of M3 formation are comparable to that of male I -albeit with a terrestrial rather than fish-based diet- and correspond with a known severe drought in 1967–1973 (, Tambel et al. Citation2014). δ15N levels reached after those events in early adolescence are the lowest for all the participants, highlighting a likely extremely low intake of animal proteins, an observation in agreement with the collapse of food production in the aftermath of droughts (Teklu et al. Citation1991). δ13C patterns after the drought, as G enters her teenage years, also suggest acute malnutrition (). The absence of a δ15N peak, which is normally seen with nutritional stress, can be explained by the accompanying decreasing aridity and dietary trophic level linked to food shortages. The substantial δ13C reduction may also reflect increased wheat consumption from food relief (Food and Agriculture Organisation of the United Nations (FAO)) Citation2005). The major isotopic changes displayed by female G around age 11 years are therefore indicative of a simultaneous reduction in aridity levels and animal protein intake, increased C3-cereals consumption, and nutritional stress. The isotopic upward shift experienced by G around the age of 18 years is thought to represent recurring increased aridity as the region entered the 1980–1984 drought .
The temporal isotopic profile for female F suggests that at about 9 years of age she experienced a catabolic event, seemingly associated with dietary and/or environmental changes and coinciding with the 1996–1997 drought and subsequent famine in 1998 (, Tambel et al. Citation2014). The small but sustained δ13C reduction of 0.6‰ associated with an extensive δ15N decrease of 1.5‰, and the fact that F has one of the lowest bulk δ15N, point to the combination of decreased aridity, catabolic stress, and long-term dietary shift akin to both overall protein intake and trophic level reduction resulting from increased reliance on proteins from plant-foods (). The δ13C shift displayed by F aged 21 years is also linked to a localised drought and famine in 2009 (, Tambel et al. Citation2014).
Since δ13C shifts from the proposed simultaneous events linked to droughts and famines exacerbate each other, while the δ15N effect of catabolic stress cancels that of dietary and environmental changes, individuals G-I display a higher range of δ13C variations compared with δ15N values (). Major δ13C changes suggestive of dietary, environmental or catabolic events are not seen in other teeth, yet the range of δ13C variations for females A and B is unexpectedly higher than that of δ15N since metabolic events are thought to only affect δ15N values (). Both women display small but sustained δ13C shifts (). For B, a lesser event may be indicated at age 11 years, corresponding with the 1996–1997 drought (Tambel et al. Citation2014). However, these small δ13C shifts may also highlight a greater influence of physiological events on δ13C values than anticipated; possibly reflecting increased reliance on body fat as a source of carbon for protein synthesis during periods of increased tissue production, or body fat changes that occur in women during puberty, pregnancy and lactation (Prentice et al. Citation1996; Rogol et al. Citation2002).
Anabolic events
Women A, B and C have comparable δ15N patterns during M3 formation, experiencing two consecutive and discernible dips of 0.6–0.9‰ and 0.3–0.5‰ from 9–11 years of age and 14–15 years of age, respectively (). Female E similarly experiences a gradual 0.5‰ δ15N reduction from about 9 years old and displays a second smaller 0.3‰ δ15N dip, but at the later age of about 18 years (). Some of the observed δ15N depressions are subtle, yet instrumental imprecision is unlikely since the isotopic patterns are sustained over time. Slight variations in terms of shape or intensity for the initial δ15N dip are seen, yet the δ15N decline consistently starts at around age 9–10 years for all four women (despite woman C being born 15–20 years before the others), pointing to the occurrence of a universal physiological event. Certainly, for women A, C and E, the δ13C changes accompanying the initial δ15N reduction do not match isotopic patterns expected from either dietary or environmental changes (). Instead, δ15N variations are consistent with isotopic projections for the pubertal growth spurt (). Therefore, for these four women, we propose that the initial δ15N depression represents the pubertal growth spurt. We suspect that the subsequent smaller δ15N dips relate to pregnancies; although, for woman E, a 0.5‰ δ13C decrease matching the δ15N reduction is seen, and corresponds with severe floods and crop failure in 2007, suggesting a possible alternative interpretation as a wetter period with a transient decrease in trophic level ( and , Moszynski Citation2007).
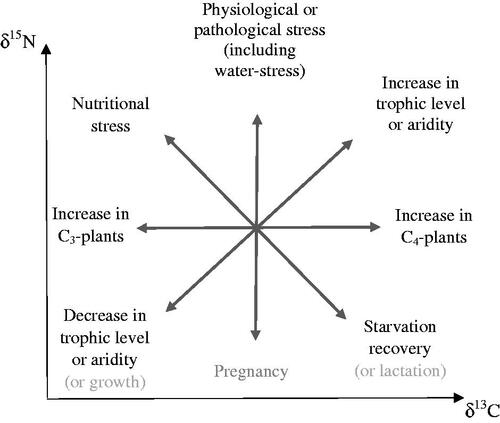
Figure 8. Projected δ15N and δ13C shifts linked with dietary, physiological or environmental events.
δ15N reductions which could be associated with pubertal growth are also observed in the isotopic profile of other individuals. Male J displays a 1.3‰ δ15N decline over 3.5 years from the estimated age of 10 years, with δ15N recovery starting from the age of about 16.5 years (). Female G also experiences a gradual and extensive δ15N reduction of 1.4‰ from about 11 years of age, while F experiences a sudden extensive decrease of 1.5‰ at about 9 years; although the subsequent δ15N recovery is limited for G and absent for F (). For male I, the δ15N decrease, which coincides with the start of M3 formation and seemingly continues for about 6 years, is interrupted by a catabolic event, while an uncertain δ15N recovery is suggested at about 23 years old (). A δ15N reduction of 0.5‰ is also seen at the start of tooth formation for female H (). However, the potential effect of the coinciding environmental changes on isotope ratios, combined with the missing data which corresponds with the presumed timing of puberty, means that the presence of isotopic pattern consistent with pubertal growth cannot be confirmed for H. The exception is for female D, for whom no initial δ15N reduction is seen, but instead, D displays a gradual 0.6‰ δ15N increase at the start of M3 formation ().
Thus, in this small group, the δ15N decrease, which we interpret as representing pubertal growth, ranges from 0.5 to 1.5‰ with a mean of 0.96 ± 0.42‰ (N = 10) (). The mean is reduced to 0.78 ± 0.29‰ (N = 6) when individuals who display major dietary or environmental changes or stress during this period are excluded. A mean of 0.7 ± 0.2‰ (N = 5) is indicated for women, while the mean for men cannot be calculated due to the limited amount of data. Overall δ13C values remain stable or display minimal changes; and no specific δ13C pattern is recognised in association with the δ15N dip which we propose represents pubertal growth. δ13C changes matching δ15N variations, in line with isotopic patterns seen in growing animals, are seen in only one isotopic profile (woman B) (, Warinner and Tuross Citation2010).
Subsequent to the isotopic signal interpreted as representing pubertal growth -and therefore the start of fertility-, δ15N patterns, which are consistent with pregnancy, are also recognised in the isotopic temporal sequences of four other women. Women D and F experience small 0.3‰ δ15N dips at the estimated ages of 14 years, while G displays a distinct 0.8‰ dip at about 15 years of age ( and ). For H, the outline of a δ15N dip comparable to that of A, is also apparent at about 14 years, although the δ15N reduction is small (0.3‰) and inconsistent (). Given the lower temporal resolution, the missing isotopic value, and the potential isotopic effect of two droughts (factors that make reliable interpretation of isotopic profiles in relation to short-term physiological events difficult), confirming the small δ15N variation seen in the H isotopic profile as a meaningful metabolic event is not possible. The start of a third δ15N reduction is also observed at about 21 years for women C and E, although instrumental influence cannot be ruled out for those two isotopic variations, since their occurrence at the end of M3 formation results in incomplete signals ().
In total, six δ15N dips which are consistent with pregnancies are suggested, with an overall δ15N decrease of 0.48‰ (0.3–0.8‰) (). δ13C patterns accompanying the δ15N changes interpreted as pregnancies -i.e. no overall changes- do not match dietary or environmental explanations, confirming a more likely physiological interpretation ().
Following the δ15N dips interpreted as pregnancies, a variety of isotopic patterns are observed (). With the exception of suspected pregnancies GA and GB, δ15N begins increasing towards isotopic pre-gestation baselines immediately or very soon after the proposed gestational events; an increase which is either gradual (e.g. GC) or very rapid (e.g. GD, GF and GG) ( and ). For women A and B, the lower δ15N values purported as pregnancies are sustained beyond the expected 9 months of gestation, before being gradually restored to (or above) pre-gestation values (). We suspect that the various post-gestational isotopic responses are linked to lactation and nutrition status of the mothers.
Discussion
Pubertal growth and δ15N
For women A-E, δ15N dips are noted at the beginning of M3 formation (). The uniformity of these depressions, including their timing around age 10 years and their amplitude ranging from 0.5 to 0.9‰, suggests that they likely represent analogous physiological events. The timing, duration and shape of these δ15N dips are also consistent with projected isotopic patterns for pubertal growth (). Interpreting the identified δ15N dip in terms of pubertal growth suggests growth onset at 9.7 ± 0.9 years (N = 4) and completion at 13.8 ± 0.9 years (N = 5); PHV is indicated to be reached by 11.7 ± 1.0 years (N = 5) and the acceleration phase to last 2.4 ± 1 years (N = 4). In women, sexual development is closely linked to growth, with puberty onset corresponding with growth spurt initiation, menarche occurring about one year after PHV, and full fertility being achieved by the end of the growth spurt (Shapland and Lewis Citation2013). Therefore, in this group of women, based on the assumption that the δ15N reductions represent pubertal growth, attainment of menarche at about 12.7 years and full fertility by 13.8 years is inferred. The proposed timing for menarche is consistent with the average of 13 years for European/North American populations; although, puberty onset is early relative to the average start of 11 years for European/North American populations (Rogol et al. Citation2002). Earlier puberty is documented in women of African descent, and the results are consistent with puberty onset at 8.8 years seen in Afro-Caribbean populations (Boyne et al. Citation2010).
A distinct δ15N depression is also seen in the isotopic profile of male J (). If this δ15N dip is interpreted in terms of pubertal growth, then growth acceleration is indicated to start at about 9.8 years, with accelerated growth lasting 6.7 years. PHV is reached at 13.1 years and growth is completed at 22 years. The proposed timing for the growth spurt onset, the longer acceleration phase and later PHV are all consistent with puberty patterns seen in male populations, including an average PHV of 14 years (Rogol et al. Citation2002). The δ15N profile is also reminiscent of isotopic variations seen in teeth from Seventeenth and Nineteenth century men, which also coincides with puberty (Beaumont and Montgomery Citation2016, ; Millard et al. Citation2020). Yet, the length of the δ15N depression proposed to represent pubertal growth diverges from projected patterns derived from height velocity curves; and growth completion is later than expected (, Rogol et al. Citation2002). Male J (like Seventeenth century Scottish soldiers PGL21 and PGL12) seems to experience a particularly prolonged growth spurt over more than 12 years, with δ15N still increasing at the end of M3 formation, despite J displaying an average adult height of 1.76 m (, ). If male J experienced malnutrition in earlier childhood, this extended δ15N depression could indicate catch-up growth into early adulthood (Golden Citation1994). Alternatively, we suspect that the discrepancy between projected and observed δ15N patterns results from the way exemplars for pubertal growth was developed. Indeed, projections are based on linear [height] growth, but δ15N changes have been found to be inversely correlated with weight gain, and linear growth differs from ponderal [weight] growth (Rogol et al. Citation2002; Fuller et al. Citation2004). During the male acceleration phase, weight gain matches height growth, and peak weight velocity (PWV) coincides with PHV; however, weight continues to increase significantly for several years after peak growth as musculature develops beyond age 19–20 years (Rogol et al. Citation2002). This is illustrated by peak velocity for thigh and arm circumference -which reflect soft tissue accretion- extending beyond PHV, with an increase in arm circumference continuing beyond the age of 19 years (Cole Citation2020). Based on patterns of soft tissue accretion in boys, reduced δ15N values can be expected to continue beyond the achievement of peak growth, as seen in male J.
In girls, weight gain also matches height gain during the growth spurt, although PWV is achieved 6 months after PHV, meaning that menarche occurs 6 months after PWV (Rogol et al. Citation2002). As for boys, weight gain in girls continues beyond peak growth but over a shorter duration, with adult muscle mass being achieved soon after puberty completion by 15–16 years old. Post-pubertal weight gain in girls also consists of a higher proportion of body fat than muscle, which is presumed to have a lesser impact on δ15N. Given this understanding of growth in girls, isotopic models for puberty created using ponderal growth are expected to be similar to projections established with height velocity, except for the timing for menarche. Based on the premise that δ15N reflects ponderal rather than linear growth, for women A-E, an earlier age of 12.2 years is indicated for menarche, which corresponds with the earlier menarche at age 12 years noted in Afro- Caribbean populations (Boyne et al. Citation2010). Completion of linear growth -and therefore fertility- may also be achieved before δ15N returns to its baseline level, although this conjecture cannot be verified without access to sexual development and growth histories.
References for the magnitude of the growth effect on δ15N are lacking in humans. However, peak growth during puberty (8–9kg per year) and recommended weight gain during pregnancy (5–18kg) occur on similar scales (Rogol et al. Citation2002; Institute of Medicine 2009). Given that δ15N is related to weight gain, δ15N reductions during puberty can be expected to be comparable to the decrease reported during pregnancy (Fuller et al. Citation2004). The observed δ15N reductions of 0.5 to 1.3‰ proposed to represent pubertal growth in our study match the range of isotopic variations of 0.3–1.3‰ observed in 13 pregnant women (Fuller et al. Citation2004; D'Ortenzio et al. Citation2015). Since peak growth during puberty is smaller in girls than in boys (8.3 kg and 9 kg per year, respectively), δ15N reductions linked to pubertal growth can also be expected to be less important in girls than in boys (Rogol et al. Citation2002). The proposed δ15N decrease linked to pubertal growth in our study, 0.7‰ (0.5–0.9‰) for five girls and 1.3‰ for one boy, is in line with such expectations.
Pregnancy, lactation and δ15N
Isotopic patterns interpreted as gestational events are identified in the isotopic profiles of women A-D, F and G ( and , ). The observed δ15N variations match expected changes created by pregnancy, including two events (GA and GB) with lengthy reduced δ15N, fitting projections for prolonged lactation, when intense lactogenesis is proposed to result in reduced δ15N values which gradually return to pre-gestation levels as milk production decreases during the weaning process (). After the other four proposed pregnancies, δ15N values return relatively rapidly to pre-gestation values, perhaps indicating short-term or absence of lactation. Indeed, in a study by Fuller et al. (Citation2006), an immediate and rapid δ15N increase after giving birth was displayed by a mother who did not breastfeed. However, given the drought which occurs after the proposed pregnancy GG, interpretation of the potential post-gestational isotopic data is unreliable for woman G. Certainly, when isotopic effects of droughts are accounted for, a more gradual δ15N increase is suggested.
The range of δ15N reductions (0.3–0.8‰) displayed during the six proposed pregnancies compares well with the range noted in 13 American and Canadian pregnant women (0.3–1.3‰) (Fuller et al. Citation2004; D'Ortenzio et al. Citation2015). If these isotopic signals are taken to represent pregnancies, an overall AFG of 14.6 ± 0.9 years is indicated for those six women (). This AFG is comparable to the AFG of 15.6 years (derived from obstetric histories) from five separate women who donated teeth to the same assemblage (Dean and Elamin Citation2014). The suggestion of prolonged breastfeeding after the proposed pregnancies of GA and GB is also in agreement with infant feeding practices in Sudan, where half of the children are breastfed beyond the age of 2 years (Tyler et al. Citation2014). While prolonged nursing for 2–3 years alongside food is common in Sudan, cessation of breastfeeding by the time the baby is 12 months also takes place, therefore the suggested shorter nursing duration after at least three of the other proposed pregnancies remains within conventional Sudanese infant feeding practices (Tyler et al. Citation2014). Shorter lactation would also be seen when a child does not survive, therefore the suggested brief periods of breastfeeding could also reflect high infant mortality (8%) in the region (UNICEF Citation2016). Still, given the lack of obstetric and infant feeding history, and the limited understanding of the effect of lactation on isotope values, reliable interpretation in terms of infant feeding practices is not possible. Indeed, diverse δ15N responses to lactation have been observed in humans: reduced maternal δ15N values resulting from gestation are occasionally maintained throughout lactation, yet some nursing mothers display progressive δ15N increase towards pre-gestation levels from birth (Fuller et al. Citation2006; Herrscher et al. Citation2017). Such a variety of isotopic patterns associated with breastfeeding could be linked to differing lactation intensity, maternal nutritional status or diet. Indeed, Habran et al. (Citation2010) observed that δ15N reductions usually observed in lactating seals were absent in fasting nursing animals, instead an insignificant upward tendency was noticed. Habran et al. (Citation2010) inferred that nursing individuals with limited food intake are faced with a dual metabolic challenge, and the increased δ15N resulting from protein catabolism cancels the δ15N reduction associated with the anabolic event.
Isotopic effect specificity – diet, climate or physiology?
Interpretation of sequential isotopic profiles can be relatively straightforward. δ15N depressions which are not easily explained by diet or climate (due to the absence of a simultaneous decrease in δ13C) but can be interpreted in relation to puberty, are readily identified in the isotopic profiles of women A, C and E (). Isotopic patterns which correspond with projected patterns for pregnancy (e.g. GC, GD, GF, GG), or pregnancy and prolonged lactation (e,g, GA and GB), and which are not easily accounted for by dietary or environmental factors, are also observed (). Nevertheless, extracting dietary, environmental and physiological information from δ15N and δ13C sequences can be complex since different factors influence isotopic values in similar ways (). For example, the δ15N dip of 0.3‰ displayed by woman E at the age of 18 years matches projected isotopic patterns for pregnancy. However, given the better temporal resolution of 9 months achieved for woman E, longer isotopic signals (relative to other isotopic profiles in this study) are anticipated; yet the identified δ15N reduction seems shorter than the six δ15N dips proposed as gestational events (, and ). Such a brief signal could be explained as a lost pregnancy or preterm birth; however, the identified δ13C reduction is unlike δ13C patterns in pregnancy reported by Fuller et al. (Citation2004). Instead, given the accompanying δ13C reduction of 0.5‰, the short isotopic shift and the known flood in 2007, an alternative interpretation as a seasonal wetter period with a short-term decrease in animal protein intake is indicated (, Moszynski Citation2007). For woman B, the δ15N dip at the age of 11 years is consistent with projected isotopic patterns for pubertal growth, and comparable to δ15N reductions interpreted as pubertal growth for women A, C and E ( and ). A δ13C reduction in agreement with isotopic patterns seen in growing animals is also observed (Warinner and Tuross Citation2010). Yet, dual δ15N and δ13C reductions are also produced by decreased aridity or trophic levels (Ambrose Citation1991; Tieszen Citation1991; Petzke et al. Citation2005,). Certainly, the isotopic dip can be linked with a period of food shortages after the 1996–1997 drought and could therefore represent a short-term decrease in animal protein intake (, Tambel et al. Citation2014). For woman D, isotopic variations evoking the end of a δ15N depression are also observed at the start of M3 formation at the age of 11 years (). Given that the timing of the isotopic shift is consistent with the chronology of puberty in girls, and that the scale of the δ15N shift (0.6‰) is comparable to the amplitudes noted for PA, PC and PE, this δ15N rise could represent a truncated pubertal isotopic signal, with growth onset starting before the initiation of M3 formation (Rogol et al. Citation2002, ). Alternatively, the δ15N increase could represent catabolism persisting for about 2 years. The absence of δ13C reduction points to either a pathological origin or moderate chronic malnutrition (Robertson et al. Citation2014; D'Ortenzio et al. Citation2015). Indeed, Robertson et al. (Citation2014) have shown that moderate chronic caloric restriction results in increased δ15N, but unlike severe acute nutritional stress from starvation, it does not affect the δ13C values of body proteins. Still, an isotopic signature indicating catabolic stress recovery is not obvious. The distinct δ15N dip seen in the isotopic profile for male J fits pubertal growth interpretation, and the associated δ13C increase is incongruent with either dietary or environmental explanations (). However, when the δ15N reduction aged 11 years and δ15N increase aged 17 years are considered as two separate events, a possible alternative interpretation for the δ15N dip emerges as a period between two episodes of nutritional stress. Indeed, the isotopic shifts between 11 and 13 years of age match patterns seen during post-starvation weight gain, while isotopic variations at age 17 years correspond with patterns seen during nutritional stress ().
Physiological isotopic signals and eventful life histories
Isotopic data for individuals A-E and J (as well as Seventeenth century Scottish soldiers and Nineteenth century Irish populations) provide compelling indications that δ15N variations may be useful to track pubertal growth and by association the progress of puberty (Beaumont and Montgomery Citation2016, and ; Millard et al. Citation2020). However, isotopic patterns suggestive of pubertal growth are not as obvious for individuals F-I ( and ). Isotopic shifts resulting from anabolic states are small in relation to the effect of other factors like diet. δ15N differences of 1.8‰ are seen between vegans and omnivores (Buchardt et al. Citation2007). Starvation results in an δ15N increase by up to 1.9‰ (Mekota et al. Citation2009). Yet, the most important δ15N reduction noted during pregnancy is 1.3‰; and during lactation, δ15N changes of 0.5‰ or less are displayed by five American women (Fuller et al. Citation2004; Citation2006; D'Ortenzio et al. Citation2015). In our study, the maximum δ15N reductions during the proposed pregnancies and pubertal growth are 0.8‰ and 1.3‰, respectively ( and ). For our small group of Sudanese individuals, the overall isotopic shifts of 0.48 ± 0.22‰ (0.3–0.8‰) and 0.78 ± 0.29‰ (0.5–1.3) suggested for pregnancy and puberty are also relatively small compared with the overall range of δ15N variations of 1.42 ± 0.68‰ (0.8–2.9‰) (). Isotopic effects arising from anabolic states could therefore easily be masked by starvation, dietary or climatic changes when physiological events coincide with such occurrences.
Incremental isotopic data for individuals F-I, supported by known demographic and anthropometric data and geo-political information, indicate that they most likely experienced metabolic stress, dietary and/or environmental changes linked to droughts and famines during adolescence. For example, isotopic shifts observed at the start of M3 formation for female F are associated with the end of a severe drought and proposed catabolic and dietary events; and may therefore conceal the onset of the pubertal growth spurt. Certainly, the extensive δ15N decrease accompanied by a much smaller δ13C reduction hints that the δ15N variations are not fully explained by diet and climate (). For woman G, the major isotopic variations resulting from the proposed simultaneous reduction in animal protein intake, climatic changes, and nutritional stress linked to the 1967–1973 severe drought and food shortage could also have masked the expected δ15N recovery from the concurrent growth-related anabolic event. The major environmental and nutritional isotopic shift identified for male I between the estimated ages of 13–16 years, corresponds with a period of expected growth acceleration, therefore increasing the complexity of isotopic interpretation in relation to developmental maturation. Still, as for male J, hints for a relatively late peak growth velocity and completion are perceived in the δ15N profile of male I (). Such suggested delayed growth could be linked to the nutritional stress male I experienced in early puberty (Soliman et al. Citation2014). The last downward isotopic shift linked to the 1993 drought could also mask a continued anabolic δ15N increase associated with growth completion.
Isotope analysis sensitivity: missing isotopic signals and ‘background noise’
For individuals F-I, concurrent diet, climate and catabolic events, therefore, appear to conceal the isotopic effect of pubertal growth. Yet, it is also possible that in those individuals, pubertal growth may not have had any visible effect on δ15N values. Indeed, physiological events do not show consistently with isotope analysis. Fuller et al. (Citation2005) noted that pregnant women experiencing mild nutritional stress in the form of morning sickness display smaller or even minimal δ15N reduction. Habran et al. (Citation2010) highlighted a comparable counteracting effect of malnutrition on anabolic δ15N responses in fasting lactating seals. A similar interaction between anabolic and catabolic states can be envisaged during the pubertal growth spurt. Given this suggested offsetting effect of malnutrition on anabolic δ15N shifts, as well as the increased risk of malnutrition during puberty, pregnancy and lactation due to increased nutritional requirements (Black et al. Citation2008), and the likely low protein intake during the time of M3 tooth formation suggested by bulk isotopic values in our study , some physiological events experienced by our study group could have been unobservable isotopically and therefore missed. Certainly, we suspect a relatively high incidence of missed gestational events. Indeed, based on data from women who took part in a large survey across Sudan, an IBI of 2.5 years is expected (Otor and Pandey Citation1998); or at the most an IBI of 3.5 years, based on data from the small group of separate women from Khartoum who donated teeth to the same assemblage (Dean and Elamin Citation2014). Based on the proposed AFG of 15.6 years, and projected IBI of 2.5–3.5 years, we would expect to observe the second set of isotopic variations suggestive of pregnancies around the ages of 18–19 years in at least some of the isotopic profiles. Yet only one possible second gestation is suggested [by an incomplete and therefore highly unreliable isotopic signal], for woman C at the age of 21 years ().
The issue of inconsistent isotopic effects of anabolic events may be compounded by the lower sensitivity of IDIA compared with hair analysis. Indeed, when teeth are sectioned horizontally, temporally distinct isotopic changes may be diluted by the temporal averaging that arises because of the mixing of dentine layers formed at different ages (Beaumont et al. Citation2013a, Henderson et al. Citation2014). Attenuated δ15N signals may also result from the lower temporal precision achieved with IDIA compared with the isotope analysis of hair. Indeed, Fuller et al. (Citation2004) and D'Ortenzio et al. (Citation2015) measured incremental δ15N values in hair, which provides a temporal resolution of about 1 month compared with the overall resolution of about 12 months obtained with IDIA in our study. δ15N shifts between conception and birth recorded by Fuller et al. (Citation2004) and D'Ortenzio et al. (Citation2015) were inconsistent: the reduced δ15N values were occasionally sustained over the entire 9 months, but more often δ15N reductions were limited to the last few months of gestation when the rate of protein synthesis and weight gain is highest. Given the uneven δ15N reductions during the course of pregnancy and the averaging of isotopic values over 9 months of gestation ensuing from the lower temporal resolution of IDIA, further dilution of isotopic variations resulting from pregnancies are therefore expected when measured in dentine rather than hair. Certainly, in our study, the amplitude of 0.48‰ (−0.3 to −0.8‰) for the six δ15N reductions suggested as possible pregnancies are lower than the average of 0.75‰ (−0.3 to −1.3‰) seen in 13 pregnancies in studies by Fuller et al. (Citation2004) and D'Ortenzio et al. (Citation2015). However, the calculated average δ15N decrease over 9 months of gestation based on the data from Fuller et al. (Citation2004) and D'Ortenzio et al. (Citation2015) is 0.45‰ (+0.2 to −1.0‰), a value with which the results of 0.48‰ suggested by our study compare relatively well.
The suggested attenuated δ15N variations created by IDIA imply an increased likelihood of isotopically unobservable events, but also isotopic signals being at the limit of the meaningful level and therefore difficult to distinguish from isotopic variations introduced by instrumental imprecision. Differentiating physiological events from ‘background noise’ is especially difficult for shorter events recorded over a single dentine-section (e.g. pregnancies without lactation, lost or preterm pregnancies), and the problem would be compounded when lower temporal resolutions are achieved (e.g woman H). In the studies by Fuller et al. (Citation2004) and D'Ortenzio et al. (Citation2015), δ15N reductions between conception and birth equal to or larger than the mean level [set at 0.3‰] were seen during all 13 pregnancies. Yet, when the calculated averaged δ15N shift (over the 9 months gestation) is considered, 29% of pregnancies display isotopic changes smaller than the mean level and would therefore be potentially imperceptible with IDIA. In our study, the magnitude of the isotopic signal associated with three of the six proposed gestations is at the limit of the accepted behaviourally meaningful level of 0.3‰ (). We deemed those small isotopic variations to represent actual events since δ15N reductions persist over two or more dentine samples, although some uncertainty of interpretation remains with such small isotopic shifts. Two short δ15N dips of 0.3‰, each over one dentine sample, seen in the isotopic profile for woman H, and two downward δ15N shifts of 0.3‰ observed over the last chronological dentine sample for women C and E, could not however be confirmed either as pregnancies or ‘background noise’ ( and ).
Physiological events and δ13C
The effect of anabolic states on δ15N values is relatively well-established (Fuller et al. Citation2004; Trueman et al. Citation2005; Reitsema and Muir Citation2015). However, there is a high degree of uncertainty regarding expected δ13C shifts in relation to physiology. Fuller et al. (Citation2004) reported insignificant δ13C variations in mothers between the time of conception and birth of 11 children. D'Ortenzio et al. (Citation2015) confirmed that gestational events result in smaller variability in δ13C than δ15N values (+0.4 to +0.6‰ and −1.0 to −1.3‰, respectively). By extension, anabolic events are assumed to have a negligible effect on δ13C values. Certainly, in relation to pregnancy, results from our study match these observations since no overall δ13C changes are seen in association with the six proposed pregnancies.
However, throughout the time of M3 tooth formation, two women (A and B) display a wider range of δ13C variations (1.4‰) compared with δ15N (0.8‰), when no dietary or climatic events are indicated (). The effect of anabolic events like growth or lactation on δ13C may therefore be more important than presumed. Indeed, a small, controlled study with well-nourished macaques eating the same diet has shown δ13C and δ15N variations of comparable magnitude during lactation, with a significant δ13C increase of 0.4‰ and δ15N decrease of 0.3‰ displayed by lactating females (Reitsema and Muir Citation2015). Based on the Reitsema and Muir (Citation2015) study, we expect to see increased δ13C alongside reduced δ15N during lactation (). Certainly, following proposed pregnancies GA and GB, δ13C increases of 0.4‰ and 0.9‰, respectively, are seen during the suggested prolonged lactation (). Yet, a diversity of δ13C responses to lactation have been observed in humans, suggesting that the interaction between lactation and δ13C may be more complex (Fuller et al. Citation2006; Herrscher et al. Citation2017). Indeed, in the studies by Fuller et al. (Citation2006) and Herrscher et al. (Citation2017), three women experienced δ13C elevations of about 0.6‰, while three displayed reductions of about 0.4‰. In our study, an eventual δ13C decrease of 0.9‰ is also seen after GB (). We suspect that such disparate δ13C responses could be linked to differing nutritional status. Indeed, the increase in δ13C values during lactation noted by Reitsema and Muir (Citation2015) was in well-nourished animals. However, when protein intake is lower than requirements for both maternal maintenance and milk production, lactating mothers mobilise available nutrients from body tissues, including adipose tissues, as a source of carbon for protein synthesis (Institute of Medicine (US) Committee on Nutritional Status during Pregnancy and Lactation 1991). A similar situation is seen during starvation when the observed reduced δ13C values are attributed to an increased reliance on 13C-depleted lipids as a source of carbon for protein synthesis (Neuberger et al. Citation2013).
Projected isotopic patterns for growth (decreased δ15N and δ13C) are based on one animal case study and are therefore highly conjectural (, Warinner and Tuross Citation2010). Extrapolating the results of animal studies to the interpretation of specific human situations is also complicated by their different size, physiology, metabolism and growth patterns. Generalising the results from Warinner and Tuross (Citation2010) to healthy populations with ‘normal’ growth patterns is especially unreliable since the study compares one undernourished pig displaying faltering growth with three pigs showing ‘normal’ weight gain. Rather than simply characterising slower weight gain, the δ13C shift seen in the slower-growing pig may therefore represent a complex interaction between growth, protein and energy deficiency. The multi-layered relationship between δ13C, anabolism and nutrition proposed for lactation can be envisaged during accelerated growth. Certainly, in our study, a variety of δ13C patterns are seen in association with the proposed pubertal growth spurt. Women B and C display a δ13C decrease of 0.6‰ consistent with projected δ13C patterns based on Warinner and Tuross (Citation2010) (). However, δ13C elevations by 0.7‰ and 0.9‰ are seen in women E and A, respectively; while the initial δ13C reduction of 0.6‰ displayed by male J is followed by a δ13C increase of 0.6‰ ( and ).
Limitations
We acknowledge that given the lack of known puberty and obstetric histories, the identification of physiological events cannot be verified, and therefore interpretation of the results from this pilot study remains informed reasoning, while assessment of the potential of IDIA to reconstruct reproductive histories is tentative. The speculative nature of the interpretation is compounded by the uncertainty of the proposed projected isotopic patterns, especially for δ13C, resulting from the paucity of data in humans for the effect of physiology on isotope values, especially in relation to growth and lactation. The ambiguity of interpretation is also accentuated by the occasional non-specificity of isotope signals, the lower sensitivity of IDIA (compared with hair analysis), and limited understanding of the interaction between physiology, malnutrition and isotope values. The complexity of interpretation in relation to anabolic events was compounded by the complex geo-political history of Sudan, and consequent seemingly complex life histories of at least individuals F-I, including multiple concurrent events like droughts, famines, diseases and migrations, and increased risk of malnutrition. Results for those four individuals may not, therefore, be representative of other populations. The difficulty with generalising the results is especially true given that the data from only 10 teeth were analysed as part of this pilot study, including only 2 males.
Given the variability of M3 formation and the lack of known extreme climatic events to aid in correcting the chronology for A, C and J, the reliability of absolute timings of physiological events for these three individuals is also poor (Mincer et al. Citation1993). Indeed, based on the identification of isotopic variations which can be linked to known droughts, delays by up to 3 years compared with the suggested onset at 8.5 years by AlQahtani (Citation2009), are indicated for the other seven individuals. For female A, inaccurate absolute age assignment may explain the inconsistent results linking stress and puberty timing. Indeed, undernutrition, including malnutrition in utero or during infancy, is normally associated with delayed fertility, while obesity can result in early sexual maturation (Cole Citation2000; Rogol et al. Citation2002; Soliman et al. Citation2014). Certainly, male I, who experienced nutritional stress during the acceleration phase, displays a relatively late PWV at about 18 years, or F who experienced catabolism towards the start of puberty, exhibits the latest puberty onset for the group. Yet, A achieved her various puberty stages at the average time for the group despite probably experiencing malnutrition in early childhood.
Conclusion
This pilot study provides compelling indications that physiological events like pubertal growth, pregnancy and lactation are recorded in developing dentine; and therefore, that not only short-term physiological events should be considered when interpreting isotope ratios chronologies, but also that IDIA can help identify some events linked to reproduction and has the potential to support the study of growth progression and sexual maturation in past populations. However, some pubertal events were not observable or difficult to discern, and it seems likely that some pregnancies were missed. Extracting diet, geography and physiology information based solely on the dual analysis of δ15N and δ13C was also challenging on occasions. Because of limitations linked to the sample (especially the lack of medical data), the results and their interpretation remain uncertain, and the potential (and limitations) of IDIA when identifying reproductive events could not be established with confidence. The study also highlights important gaps in knowledge regarding the relationship between δ15N, muscle mass accretion, linear and ponderal growth in humans, as well as the interaction between isotope ratios, lactation (or growth), diet and nutritional status. An improved understanding of the interactive influence of physiology and nutrition on isotope values would be invaluable to reconstructing life histories in archaeological populations.
Studies including medical, growth, obstetric and life history information are needed to assess the ability and reliability of IDIA when identifying short-term physiological events. Analysing teeth that start developing earlier in life, over a more consistent timeframe overlapping with M3 formation (e.g. canine or M1), alongside M3, would also help adjust the chronology and provide earlier isotope data when puberty starts before M3 formation. Larger cohorts would help evaluate the projected isotope models for puberty, pregnancy and lactation too. Analysis of multiple isotopes or combining isotope analysis with other methods, like dental parturition lines and linear enamel hypoplasia, can also help distinguish more clearly the different factors influencing isotope values (e.g. Huss-Ashmore et al. Citation1982; Bol et al. Citation2007; Dean and Elamin Citation2014).
Acknowledgements
The authors are grateful to the Khartoum Centre for Research and Medical training for kindly giving us access to the teeth and associated demographic and anthropometric data, the participants who donated their teeth and the professionals who carried out the dental treatment and collected the data. We particularly thank Dr Yousra Mirghani (University of Khartoum, Sudan), Dr Israa Osman, Dr Israa Salak and Dr Nihal Abd El Azeem (Khartoum Centre for Research and Medical Training, Sudan) for their help with aspects of this study. We would also like to thank Marise Gorton and Dr Jacqueline Towers from the Stable isotope laboratory at the University of Bradford for their help with the analysis of the teeth, and the two anonymous referees for their careful reading of the manuscript and helpful comments.
Disclosure statement
The authors alone are responsible for the content and writing of the paper. The authors report no conflict of interest.
References
- AlQahtani SJ. 2009. An atlas of tooth development and eruption. London: Queen Mary College University of London.
- Ambrose SH. 1991. Effects of diet, climate and physiology on nitrogen isotope abundances in terrestrial foodwebs. J Arch Sci. 18(3):293–317.
- Ambrose SH, Norr L. 1993. Experimental evidence for the relationship of the carbon ratio of whole diet and dietary protein to those of bone collagen and carbonate. In Lambert JB, Grupe G. Editors. Prehistoric human bone: archaeology at the molecular level. Berlin: Springer Verlag p. 1–37.
- Arnett JJ. 2007. Emerging adulthood: what is it, and what is it good for? Child Dev Persp. 1(2):68–73.
- Beaumont J. 2020. The whole tooth and nothing but the tooth: or why temporal resolution of bone collagen may be unreliable. Archaeometry e12544. 62(3):626–645.
- Beaumont J, Geber J, Powers N, Wilson A, Lee-Thorp J, Montgomery J. 2013b. Victims and survivors: stable isotopes used to identify migrants from the Great Irish Famine to 19th Century London. Am J Phys Anthropol. 150(1):87–98.
- Beaumont J, Gledhill A, Lee-Thorp J, Montgomery J. 2013a. Childhood diet: a closer examination of the evidence from dental tissues using stable isotope analysis of incremental human dentine. Archaeometry. 55(2):277–295.
- Beaumont J, Montgomery J. 2015. Oral histories: a simple method of assigning chronological age to isotopic values from human dentine collagen. Ann Hum Biol. 42(4): 407–414.
- Beaumont J, Montgomery J. 2016. The Great Irish Famine: identifying starvation in the tissues of victims using stable isotope analysis of bone and incremental dentine collagen. PLOS ONE. 11(8):e0160065.
- Beaumont J, Montgomery J, Buckberry J, Jay M. 2015. Infant mortality and isotopic complexity: new approaches to stress, maternal health, and weaning. Am J Phys Anthropol. 157(3):441–457.
- Beckett PR, Jakoor F, Copeland KC. 1997. The efficiency of dietary protein utilization is increased during puberty. J Clin Endocr Met. 82(8):2445–2449.
- Black RE, Allen LH, Bhutta ZA, Caulfield LE, de Onis M, Ezzati M, Mathers C, Rivera J. 2008. Maternal and child undernutrition: global and regional exposures and health consequences. Lancet. 371(9608):243–260.
- Bocherens H, Drucker D. 2003. Trophic level isotopic enrichment of carbon and nitrogen in bone collagen: case studies from recent and ancient terrestrial ecosystems. Int J Osteoarchaeol. 13(1–2):46–53.
- Boke MM, Yesuf A, Gutema BT. 2021. Prevalence of undernutrition and associated factors among lactating mothers of Angecha District, Kembala Tembaro Zone, Southern Ethiopia. J Nut Metab. 2021:1–8.
- Bol R, Marsh J, Heaton THE. 2007. Multiple stable isotope (18O, 13C, 15N and 34S) analysis of human hair to identify the recent migrants in a rural community in SW England. Rapid Commun Mass Spectrom. 21(18):2951–2954.
- Boyne MS, Thame M, Osmond C, Fraser RA, Gabay L, Reid M, Forrester TE. 2010. Growth, body composition, and the onset of puberty: longitudinal observations in Afro-Caribbean children. J Clin Endocr Met. 95(7):3194–3200.
- Braun A, Schneider S, Auerswald K, Bellof G, Schnyder H. 2013. Forward modelling of fluctuating dietary 13C signals to validate 13C turnover models of milk and milk components from a diet-switch experiment. PLOS ONE. 8(12):e285235.
- Britton K, Müldner G, Bell M. 2008. Stable isotope evidence for salt-marsh grazing in the Bronze Age Severn estuary, UK: implications for paleodietary analysis at coastal sites. J Arch Sc. 35(8):2111–2118.
- Buchardt B, Bunch V, Helin P. 2007. Fingernails and diet: stable isotope signatures of a marine hunting community from modern Uummannaq, North Greenland. Chem Geo. 244(1–2):316–329.
- Chisholm BS, Nelson DE, Schwarcz HP. 1982. Stable-carbon isotope ratios as a measure of marine versus terrestrial protein in ancient diets. Science. 216(4550):1131–1132.
- Cole TJ. 2000. Secular trends in growth. Proc Nutr Soc. 59(2):317–324.
- Cole TJ. 2020. Tanner’s tempo of growth in adolescence: recent SITAR insights with the Harpenden Growth Study and ALSPAC. Ann Hum Biol. 47(2):181–198.
- Cox M. 2000. Assessment of parturition. In Cox M, Mays S. Editors. Human osteology in archaeology and forensic science. London: Greenwich Medical Media. p. 131–142.
- D'Ortenzio L, Brickley M, Schwarcz H, Prowse T. 2015. You are not what you eat during physiological stress: isotopic evaluation of human hair. Am J Phys Anthropol. 157(3):374–388.
- de Luca A, Boisseau N, Tea I, Louvet I, Robins RJ, Forhan A, Charles M-A, Hankard R. 2012. δ15N and δ13C in hair from newborn infants and their mothers: a cohort study. Pediatr Res. 71(5):598–604.
- Dean C, Elamin F. 2014. Paturition lines in modern human wisdom roots: do they exist, can they be characterised and are they useful for the retrospective determination of age at first reproduction and/or inter-birth interval? Ann Hum Biol. 41(4):358–367.
- Delgado HL, Martorell R, Klein RE. 1982. Nutrition, lactation, and birth interval components in rural Guatemala. Am J Nut. 35(6):1468–1476.
- Dorn LD, Biro FM. 2011. Puberty and its measurement: a decade in review. J Res Adolesc. 21(1):180–195.
- Dupras TL, Tocheri MW. 2007. Reconstructing infant weaning histories at Roman period Kellis, Egypt using stable isotope analysis of dentition. Am J Phys Anthropol. 134(1):63–74.
- Eerkens JW, Bartelink EJ. 2013. Sex-biased weaning and early childhood diet among Middle Holocene hunter-gatherers in Central California. Am J Phys Anthropol. 152(4):471–483.
- Eerkens JW, Berget AG, Bartelink EJ. 2011. Estimating weaning and early childhood diet from serial micro-samples of dentin collagen. J Arch Sc. 38(11):3101–3111.
- Eerkens JW, Sullivan K, Greenwald AM. 2016. Stable isotope analysis of serial samples of third molars as insight into inter- and intra-individual variation in ancient diet. J Arch Sc: Reports. 5:656–663.
- English S, Wright I, Ashburn V, Ford G, Caramaschi D. 2020. Prenatal anxiety, breastfeeding and child growth and puberty: linking evolutionary models with human cohort studies. Ann Hum Biol. 47(2):106–115.
- Fernandes R, Nadeau MJ, Grootes PM. 2012. Macronutrient-based model for dietary carbon routing in bone collagen and bioapatite. Arch Anthr Sc. 30:1673–1684.
- Fildes V. 1986. Breasts, bottles and babies: a history of infant feeding. Edinburgh: Edinburgh University Press.
- Food and Agriculture Organisation of the United Nations (FAO) 2005. Sudan nutrition profile.
- Food and Agriculture Organisation of the United Nations (FAO). 2010. Nutrition and consumer protection: nutrition country profiles: Republic of the Sudan.
- Food and Agriculture Organisation of the United Nations (FAO) 2020. Fishery and aquaculture country profiles: Republic of the Sudan.
- Fuller BT. 2003. Isotopic investigations of pregnancy and breastfeeding in modern and archaeological populations. Oxford: University of Oxford: p. 211.
- Fuller BT, Fuller JL, Harris DA, Hedges REM. 2006. Detection of breastfeeding and weaning in modern human infants with carbon and nitrogen stable isotope ratios. Am J Phys Anthropol. 129(2):279–293.
- Fuller BT, Fuller JL, Sage NE, Harris DA, O'Connell TC, Hedges REM. 2004. Nitrogen balance and δ15N: why you’re not what you eat during pregnancy. Rapid Commun Mass Spectrom. 18(23):2889–2896.
- Fuller BT, Fuller JL, Sage NE, Harris DA, O'Connell TC, Hedges REM. 2005. Nitrogen balance and δ15N: why you’re not what you eat during nutritional stress. Rapid Commun Mass Spectrom. 19(18):2497–2506.
- Fuller BT, Müldner G, Van Neer W, Ervynck A, Richards MP. 2012. Carbon and nitrogen stable isotope ratio analysis of freshwater, brackish and marine fish from Belgian archaeological sites (1st and 2nd Millenium AD). J Anal at Spectrom. 27(5):807–820.
- Fuller BT, Richards MP, Mays SA. 2003. Stable carbon and nitrogen isotope variations in tooth dentine serial sections from Wharram Percy. J Arch Sc. 30(12):1673–1684.
- Golden MHN. 1994. Is complete catch up possible for stunted malnourished children? Eur J Clin Nut. 48:58s–70s.
- Grupe G, Heinrich D, Peters J. 2009. A brackish water aquatic foodweb: trophic levels and salinity gradients in the Schei Fjord, Northern Germany, in Viking and Medieval times. J Arch Sc. 36(10):2125–2144.
- Habran S, Debier C, Crocker DE, Houser DS, Lepoint G, Bouquegneau J-M, Das K. 2010. Assessment of gestation, lactation and fasting on stable isotope ratios in northern elephant seals (Mirounga angustirostris). Mar Mam Sc. 26(4):880–895.
- Harrison GG. 1997. Nutrition and child feeding patterns in the Sudan. Ahfad J. 9:4–22.
- Hedges R, Rush E, Aalbersberg W. 2009. Correspondence between human diet, body composition and stable isotopic composition of hair and breath in Fijian villagers. Iso Envir Health Stud. 45(1):1–17.
- Henderson RC, Lee-Thorp J, Loe L. 2014. Early life histories of the London poor using δ13C and δ15N stable isotope incremental dentine sampling. Am J Phys Anthropol. 154(4):585–593.
- Henderson CY, Padez C. 2017. Testing times: identifying puberty in an identified skeletal sample. Ann Hum Biol. 44(4):332–337.
- Herrscher E, Goude G, Metz L. 2017. Longitudinal study of stable isotope compositions of maternal milk and implications for the paleo-diet of infants. Bull Mém Soc Anthr Paris. 29:131–139.
- Hillson S. 1996. Dental anthropology. Cambridge: Cambridge University Press.
- Hobson KA, Alisauskas RT, Clark RG. 1993. Stable-nitrogen isotope enrichment in avian tissues due to fasting and nutritional stress: implications for isotopic analyses of diet. Condor. 95(2):388–394.
- Howcroft R, Eriksson G, Lidén K. 2012. Conformity in diversity? Isotopic investigations of infant feeding practices in two iron age populations from Southern Öland, Sweden. Am J Phys Anthropol. 149(2):217–230.
- Howcroft R, Eriksson G, Lidén K. 2014. Infant feeding practices at the Pitted Ware Culture site of Ajvide, Gotland. J Anthr Arch. 34:42–53.
- Huss-Ashmore R, Goodman AH, Armelagos GJ. 1982. Nutritional interference from pathology. In Schiffer MB (edt) Advances in archaeological method and theory. New York: Academic Press. Vol 5: p. 395–474.
- Hägg U, Taranger J. 1982. Maturation indicators and the pubertal growth spurt. Am J Orthod. 82(4):299–309.
- Iacumin P, di Matteo A, Usai D, Salvatori S, Venturelli G. 2016. Stable isotope study on ancient populations of Central Sudan: insights on their diet and environment. Am J Phys Anthropol. 160(3):498–518.
- Institute of Medicine (US) Committee on Nutritional Status during Pregnancy and Lactation 1991. Nutrition during lactation: meeting maternal nutrient needs during lactation. Washington DC: National Academies Press.
- Institute of Medicine 2009. Weight gain during pregnancy: reexamining the guidelines. Washington DC: National Academies Press.
- Jenkins SG, Partridge ST, Stephenson TR, Farley SD, Robbins CT. 2001. Nitrogen and carbon isotope fractionation between mothers, neonates and nursing offspring. Oecologia. 129(3):336–341.
- Kalhan SC. 2000. Protein metabolism in pregnancy. Am J Clin Nutr. 71(5 Suppl):1249s–1255s.
- Osman AK. 1985. Dietary practices and aversions during pregnancy and lactation among Sudanese women. J Trop Pediatr. 31(1):16–20.
- Kurle CM. 2002. Stable-isotope ratios of blood components from captive northern fur seals (Callorhinus ursinus) and their diets: applications for studying the foraging ecology of wild otarids. Can J Zool. 80(5):902–909.
- Lewis M, Shapland F, Watts R. 2016. On the threshold of adulthood: a new approach for the use of maturation indicators to assess puberty in adolescents from Medieval England. Am J Hum Biol. 28(1):48–56.
- Marchetta F, Sahn DE. 2015. The role of education and family background in marriage, childbearing and labor market participation in Senegal. IZA Institute of Labour Economics paper 8876.
- Marshall W, Tanner J. 1986. Puberty. In Falkner F, Tanner J. Editors. Human growth: a comprehensive treatise. New York: Plenum Press. p. 171–209.
- Martinez del Rio C, Wolf N, Carleton SA, Gannes LZ. 2009. Isotopic ecology ten years after a call for more laboratory experiments. Biol Rev Camb Philos Soc. 84(1):91–111.
- Mekota AM, Grupe G, Ufer S, Cuntz U. 2009. Identifying starvation episodes using stable isotopes in hair. Rechtsmedizin. 19(6):431–440.
- Millard AR, Annis RG, Caffell AC, Dodd LL, Fischer R, Gerrard CM, Graves CP, et al. 2020. Scottish soldiers from the Battle of Dunbar 1650: a prosopographical approach to a skeletal assemblage. PLOS One. 15(12):e0243369.
- Mincer HH, Harris EF, Berryman HE. 1993. The A.B.F.O. Study of third molar development and its use as an estimator of chronological age. J Sc. 38:379–390.
- Moszynski P. 2007. Flooding worsens in Sudan. BMJ. 335(7612):175.
- Nardoto GB, Murrieta RSS, Prates LEG, Adams C, Garavello MEPE, Schor T, De Moraes A, et al. 2011. Frozen chicken for wild fish: nutritional transition in the Brazillian Amazon region determined by carbon and nitrogen stable isotope ratios in fingernails. Am J Hum Biol. 23(5):642–650.
- Neuberger FM, Jopp E, Graw M, Püschel K, Grupe G. 2013. Signs of malnutrition and starvation – reconstruction of nutritional histories by serial isotopic analyses of hair. Forensic Sci Int. 226(1–3):22–32.
- Newsome SD, Clementz MT, Koch PL. 2010. Using stable isotope biogeochemistry to study marine mammal ecology. Mar Mam Sci. 26:509–572.
- Nitsch EK, Humphrey LT, Hedges REM. 2010. The effect of parity status on δ15N: looking for the ‘pregnancy effect’ in 18th and 19th century London. J Arch Sci. 37(12):3191–3199.
- Nyuar KB, Khalil AKH, Crawford MA. 2012. Dietary intake of Sudanese women: a comparative assessment of nutrient intake of displaced and non-displaced women. Nutr Health. 21(2):131–144.
- O’Connell TC, Hedges REM. 1999. Isotopic comparison of hair and bone: archaeological analyses. J Arch Sc. 26(6):661–665.
- O'Connell TC, Kneale CJ, Tasevska N, Kuhnle GGC. 2012. The diet-body offset in human nitrogen isotopic values: a controlled dietary study. Am J Phys Anthropol. 149(3):426–434.
- Otor SC, Pandey A. 1998. Puberty and the family formation process in Sudan: age-at-menarche differential fecundity hypothesis revisited. Soc Biol. 45(3–4):246–259.
- Oxfam & Ministry of Health (MoH). 1997. Food security and nutrition survey. Red Sea State, Sudan.
- Petzke KJ, Boeing H, Metges C. 2005. Choice of dietary protein of vegetarians and omnivores is reflected in their hair protein 13C and 15N abundance. Rapid Commun Mass Spectrom. 19(11):1392–1400.
- Phillips DL. 2012. Converting isotope values to diet composition: the use of mixing models. J Mammal. 93(2):342–352.
- Prentice AM, Spaaij CJK, Goldberg GR, Poppitt SD. 1996. Energy requirements of pregnant and lactating women. Eur J Clin Nut. 50:S82–S111.
- Reitsema LJ. 2012. Introducing fecal stable isotope analysis in primate weaning studies. Am J Primatol. 74(10):926–939.
- Reitsema LJ. 2013. Beyond diet reconstruction: stable isotope applications to human physiology, health and nutrition. Am J Hum Biol. 25(4):445–456.
- Reitsema LJ, Muir AB. 2015. Brief communication: growth velocity and weaning δ15N “dips” during ontogeny in Macaca mulatta. Am J Phys Anthropol. 157(2):347–357.
- Reynard LM, Tuross N. 2015. The known, the unknown and the unknowable: weaning times from archaeological bones using nitrogen isotope ratios. J Arch Sci. 53:618–625.
- Robertson KL, Rowland NE, Krigbaum J. 2014. The effects of caloric restriction on nitrogen and carbon stable isotope ratios in adult rat bone. Rapid Commun Mass Spectrom. 28(19):2065–2074.
- Rogers C, Earnest J. 2014. A cross-generational study of contraception and reproductive health among Sudanese and Eritrean women in Brisbane, Australia. Health Care Women Int. 35(3):334–356.
- Rogol AD, Roemmich JN, Clark PA. 2002. Growth and puberty. J Ado Health. 31(6):192–200s.
- Romek KM, Julien M, Frasquet-Darrieux M, Tea I, Antheaume I, Hankard R, Robins RJ. 2013. Human baby hair amino acid natural abundance 15N-isotope values are not related to the 15N-isotope values of amino acids in mother’s breastmilk protein. Amino Acids. 45(6):1365–1372.
- Sandberg PA, Sponheimer M, Lee-Thorp J, van Gerven D. 2014. Intra-tooth stable isotope analysis of dentine: a step towards addressing selective mortality in the reconstruction of life history in the archaeological record. Am J Phys Anthropol. 155(2):281–293.
- Schoeller DA. 1999. Isotope fractionation: why aren’t we what we eat? J Arch Sc. 26(6):667–673.
- Shapland F, Lewis ME. 2013. Brief communication: a proposed osteological method for the estimation of pubertal stage in human skeletal remains. Am J Phys Anthropol. 151(2):302–310.
- Jim S, Jones V, Ambrose SH, Evershed RP. 2006. Quantifying dietary macronutrient sources of carbon for bone collagen biosynthesis using natural abundance stable carbon isotope analysis. Br J Nutr. 95(6):1055–1062.
- Soliman A, De Sanctis V, Elalaily R. 2014. Nutrition and puberty development. Indian J Endocrinol Metab. 18(Suppl 1):S39–S47.
- Sperling S, Beyene Y. 1997. A pound of biology and a pinch of culture or a pinch of biology and a pound of culture? The necessity of integrating biology and culture in reproductive studies. In Hager LD. Editor. Women in human evolution. London: Routledge. p. 137–152.
- Tambel S, Mohamed HS, Mustafa S. 2014. Drought conditions and management strategies in Sudan. United Nations water – decade programme capacity development – network data management protocol country report.
- Teklu T, von Braun J, Zaki E. 1991. Drought and famine relationship in Sudan: policy implications. Washington, DC: International Food Policy Research Institute: Research Report 88.
- Tieszen LL. 1991. Natural variations in the carbon isotope values of plants: implications for archaeology, ecology and palaeoecology. J Arch Sc. 18(3):227–248.
- Tomé D, Bos C. 2000. Dietary protein and nitrogen utilization. J Nutr. 130(7):1868s–1873s.
- Trueman CN, McGill RAR, Guyard PH. 2005. The effect of growth rate on tissue-diet isotopic spacing in rapidly growing animals: an experimental study with Atlantic salmon (Salmo salar). Rapid Commun Mass Spectrom. 19(22):3239–3247.
- Tyler L, Kirby R, Rogers C. 2014. Infant feeding practices among Sudanese women now living in regional South East Queensland. Australia Breastfeeding Rev. 22:13–19.
- UNICEF 2016. The state of the world’s children.
- Van der Merwe N. 1982. Carbon isotopes, photosynthesis, and archaeology: different pathways of photosynthesis cause characteristic changes in carbon isotope ratios that made possible the study of prehistoric human diets. Am Scientist. 70:596–606.
- Van Klinken GJ. 1999. Bone collagen quality indicators for paleodietary and radiocarbon measurements. J Arch Sc. 26(6):687–695.
- Veldhuis JD, Roemmich JN, Richmond EJ, Rogol AD, Lovejoy JC, Sheffield-Moore M, Mauras N, Bowers CY. 2005. Endocrine control of body composition in infancy, childhood, and puberty. Endocr Rev. 26(1):114–146.
- Victora CG, Adair L, Fall C, Hallal PC, Martorell R, Richter L, Sachdev HS. 2008. Maternal and child undernutrition: consequences for adult health and human capital. Lancet. 371(9609):340–357.
- Viner R. 2008. Adolescent medicine. In McKintosch N, Helms P. Editors. Forfel and Arnell’s textbook of pediatrics. London: Churchill Livingstone.
- Warinner C, Tuross N. 2010. Brief communication: tissue isotopic enrichment associated with growth depression in a pig: implication for archaeology and ecology. Am J Phys Anthro. 141:486–493.
- Waters-Rist AL, Katzenberg MA. 2010. The effect of growth on stable isotope ratios in subadult bone collagen. Int J Osteoarch. 20:172–191.
- Webb EC, Stewart A, Miller B, Tarlton J, Evershed RP. 2016. Age effects and the influence of varying proportions of terrestrial and marine dietary protein on the stable nitrogen-isotope compositions of pig bone collagen and soft tissues from a controlled feeding experiment. STAR: Sci Tech Arch Res. 2(1):54–66.
- Webb EC, White CD, van Uum S, Longstaffe FJ. 2015. Integrating cortisol and isotopic analyses of archaeological hair: reconstructing individual experience of health and stress. Am J Phys Anthropol. 156(4):577–594.
- Wilson AS, Gilbert MTP. 2007. Hair and nail. In Thompson T, Black S. Editors. Forensic human identification: an introduction. London: Taylor and Francis. p. 147–172.
- World Health Organization (WHO), United Nations Children’s Found (UNICEF) 2003. Global strategy for infant and young child feeding.
- World Health Organization (WHO) 2011. Fact sheet No 351: family planning.
- World Health Organization (WHO). 2015. Sudan WHO statistical profile.
- Wright LE, Schwarcz HP. 1999. Correspondence between stable carbon, oxygen and nitrogen isotopes in human tooth enamel and dentine: infant diets at Kaminaljuyù. J Arch Sc. 26(9):1159–1170.