
Abstract
Background
Known for its rich history and culture, Qingdao is a typical symbol of Chinese maritime culture. Its unique genetic landscape has aroused interest among geneticists and forensic scientists. However, the genetic landscape of Qingdao has never been uncovered.
Aim
This investigation intends to provide light on Qingdao’s paternal genetic diversity and its evolutionary connections to other Han subgroups.
Subjects and methods
The genetic polymorphisms of 41 Y-chromosomal short tandem repeat (STR) loci in the Qingdao Han were investigated using SureID® PathFinder Plus Kit. Phylogenetic studies were performed using genotype data from 52 East Asian groups at 23 common Y-STR loci. A multidimensional scaling plot and cladogram were constructed. Linear Discriminant Analysis (LDA) was carried out for predicting categories among the Han people. The k-nearest neighbour (kNN) algorithm was utilised to designate Y-SNP haplogroups for each haplotype.
Results
The Qingdao Han were genetically far from the Tibeto-Burman populations and close with the Han people from northern China. LDA indicated a deep integration among the present-day Han people. By the kNN model, the predicted O2a2 and O2a1 were shown to be the predominant Y-SNP haplogroups.
Conclusions
This study would be helpful for reconstructing the patrilineal history in China and establishing a more comprehensive Y-STR database.
Introduction
There is a growing interest in shedding light on the human population’s history. In the last two decades, studies on the patrilineal diversity in various populations are receiving more and more attention. As the world’s fourth-busiest port, the coastal city of Qingdao is located in the south of the Shandong Peninsula and has developed into a metropolis of 10 million people (according to “Qingdao National Economic and Social Development Statistical Bulletin 2021”). Qingdao has many Neolithic culture sites nearby, such as Houli Culture (8500–7500 BP), Beixin Culture (7500–6100 BP), Dawenkou Culture (6300–4600 BP), and Longshan Culture (4600–4000 BP) (Shandong Province Institute of Cultural Relics and Archaeology, 2005) (Liu et al. Citation2021). Moreover, it was closely associated with Laizi and Yi kingdoms during the Pre-Qin Period. Therefore, Qingdao is a great place to study Chinese civilisation and human activities in ancient times. Due to its excellent strategic location, Qingdao consecutively became a colony of the British, Germans, and Japanese in modern Chinese history. Nowadays, Qingdao is highly urbanised. The Shandong peninsula’s significant demographic fluctuation (Wang et al. Citation2000) will make it challenging to build a credible forensic DNA database and to clarify a trustworthy history in East Asia. Although Y-chromosome short tandem repeats (Y-STRs) have been used to study the patrilineal diversity in Shandong Province (Zhang et al. Citation2019; Zhang et al. Citation2020), the genetic landscape of Han people in the city of Qingdao has not yet been revealed.
Subjects and methods
Study population
Buccal swabs were collected from 500 healthy, unrelated Han males in Qingdao (Supplementary Figure S1). The household registration certificates were identified to assure their national attributes. We confirmed that all the subjects were born in Qingdao and that their direct relations had been resident in Qingdao for at least three generations. This study was reviewed and approved by the Ethics Committee of the Affiliated Hospital of Shaoxing University (2021YAN005). Each volunteer participant read and signed an informed consent form. Additionally, raw genotyping data from 51 other Asian ethnic groups were also collected for comparison (Supplementary Table S1).
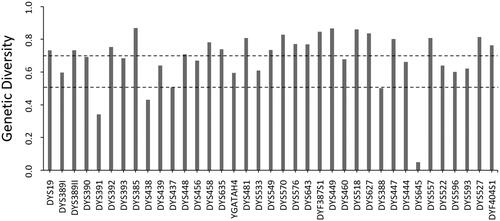
Figure 1. The genetic diversities of the 41 Y-STR loci in the populations of Qingdao Han (n = 500) genotyped using SureID® PathFinder Plus. Broken lines represent genetic diversity of 0.50 and 0.70.
PCR amplification and genotyping
According to the suggested parameters of the SureID® PathFinder Plus Kit (Fan et al. Citation2021), 41 Y-STR loci and 3 Y-InDel markers were directly co-amplified using the GeneAmp® PCR System 9700 Thermal Cycler (Applied Biosystems, CA). The amplicons were separated and identified using capillary electrophoresis on the ABI 3500 Genetic Analyser (Applied Biosystems). Allele designations for each locus were determined by comparisons with the allelic ladder included in the kit. Y-STR genotyping was conducted by GeneMapper® ID-X 1.5 (Applied Biosystems) following the ISO 17025 recommendations. The quality control of our laboratory is approved by the China National Accreditation Service for Conformity Assessment (CNAS). Each batch of the genotyping experiment was under a positive as well as a negative control.
Forensic parameters and population substructure reconstruction
Allele and haplotype frequencies of Y-STR loci were determined by direct counting. Genetic diversity (GD) and haplotype diversity (HD) were calculated using Nei’s method (Nei and Tajima Citation1981). The discrimination capacity (DC) was equal to the total distinct haplotypes divided by the total number of haplotypes. Based on raw genotype data from the Qingdao Han and 51 other ethnic groups (Supplementary Table S1), DA genetic distances were calculated using the “Genet.dist” package under the R statistical environment (Takezaki and Nei Citation1996). The distance matrix was further transformed into a heatmap using the “ComplexHeatmap” package under the R statistical environment (Gu et al. Citation2016). A multidimensional scaling (MDS) plot was constructed using the IBM SPSS® software (Young Citation1970; Hansen Citation2005). In addition, a well-established machine learning (ML) technique and classification method, Linear Discriminant Analysis (LDA), was utilised for predicting categories (Venables et al. Citation2002). Also, under the R statistical environment, the LDA plot was created via the “lda” package to visualise how well it can separate the 24 Han populations. The multi-copy loci were excluded from the LDA. To better exhibit the phylogenetic relationship in neighbor-joining (N-J) trees, the DA distance matrices were also used to create the “newick” file using the PHYLIP v3.6.95 (Reynolds et al. Citation1983; Retief Citation2000) and Evolview v3 (Subramanian et al. Citation2019).
Paternal haplogroup assignment
The k-nearest neighbour (kNN) is a non-parametric supervised learning method which is helpful for both regression and classification (Altman Citation1992). Many prior studies mentioned its potential for allocating each haplogroup based on the Y-STR haplotype (Song et al. Citation2019b; Yin et al. Citation2022). Its availability had already been validated by a recent study (Fan Citation2022). In order to further enhance the predictive performance of the kNN model, a substantial training dataset was adopted for analysis using the “knn” package under the statistical environment R (Zhang Citation2016). The developed kNN predictor includes 23 common Y-STR loci and corresponding Y haplogroups from 3,248 Han males (Lang et al. Citation2019; Song et al. Citation2019a; Yin et al. Citation2020, Citation2022; Zhang et al. Citation2020). The algorithms were implemented using the R script available on GitHub (https://github.com/fanyoyo1983/knn-Y-haplogroup.git). Meanwhile, multi-copy loci and copy number variation (CNV) were excluded in the ML. The specificity and sensitivity of the kNN predictor for each predicted haplogroup were measured and performance was also shown in a confusion matrix.
Results
Haplotype diversity
The haplotype distribution and frequencies are shown in Supplementary Table S2. A total of 498 unique haplotypes were identified from the 500 Qingdao Han males, with two haplotypes showing up twice. Allele frequencies and the GD values for the Y-STR loci are listed in Supplementary Table S3. The locus of DYS385 was identified as the locus with the highest GD, whereas DYS645 had the lowest (). The allelic combination distributions for the four multi-copy markers are presented in Supplementary Table S4. The copy number variants were only found at the loci of DYF387S1, DYS527, and DYF404S1 (Supplementary Table S5). The overall HD and DC were 0.999984 and 0.996, respectively.
Meta-population comparisons
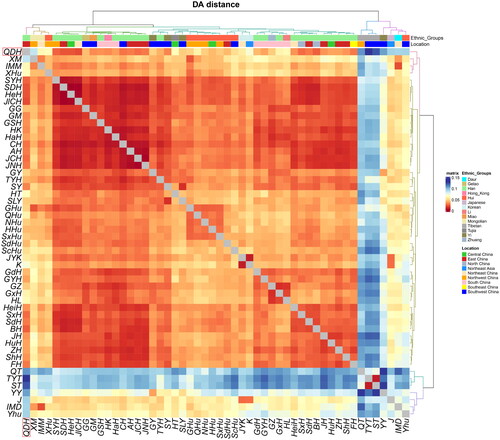
The pairwise DA distance and MDS analysis were conducted to uncover further genetic relationships among the 52 reference populations. The raw data of 23 overlapped Y-STR loci were utilised for this purpose (Supplementary Table S1). The DA distance matrix is listed in Supplementary Table S6. The Qingdao Han were genetically closer to the Han populations from Jilin Changchun (DA = 0.0214), Shandong Dezhou (DA = 0.0231), and Henan (DA = 0.0231). In contrast, the Qingdao Han were genetically far from the Tibetan ethnic groups inside the Tibetan-Yi corridor (DA = 0.1292) and Sichuan (DA = 0.1229). The genetic affinities among the Han populations are revealed in the heatmap (). Tibetan, Daur, Hui, Yi (Yunnan), Mongolian (Xinjiang), and Japanese were genetically far from the Qingdao Han.
Figure 2. The DA genetic distance analysis among Qingdao Han and other 51 reference populations.
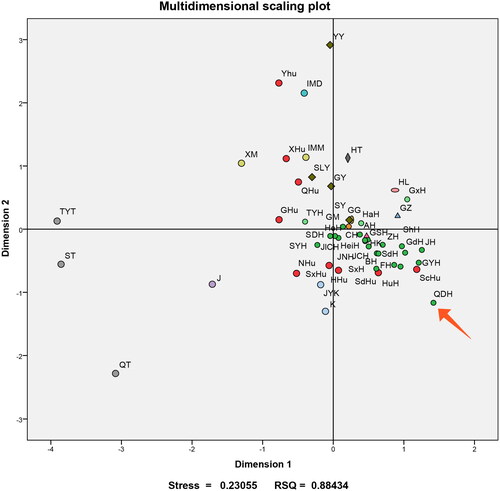
The MDS plot demonstrated that all the Han subgroups clustered tightly in the right part of the plot, whereas the groups of the Tibetan, Daur, Yi (Yunnan), and Hui (also in Yunnan) were far from the cluster (). In the lower right quadrant, the Qingdao Han didn’t tightly cluster with the other Han groups. Meanwhile, the Koreans were closer with the Han cluster than the Japanese.
Figure 3. Multidimensional scaling (MDS) analysis for the Qingdao Han population and another 51 reference populations based on DA values. The red arrow points at the Qingdao Han population, and the meaning of other abbreviations can be seen in Supplementary Table S1.
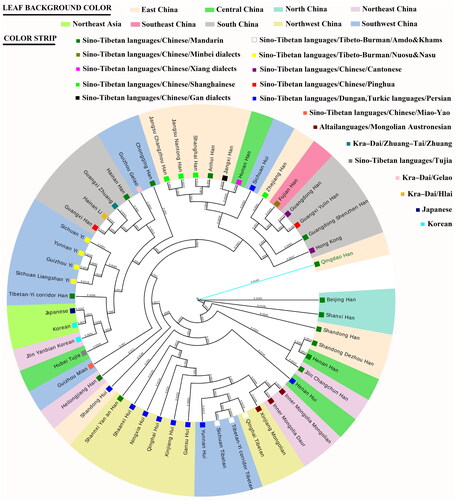
The DA genetic distance among the 52 Asian populations was used to build the NJ phylogenetic tree (). The Qingdao Han clustered closely with Han populations from Beijing, Shanxi, Jilin, Henan, Shandong, and Dezhou (a city in Shandong). The Sichuan Hui were close with the Han populations from East and South China. Nearly all the Hui populations fell into a large cluster with the Tibetans, Mongolians, and Daur. Moreover, the Japanese and Koreans were genetically closer to Hubei Tujia on the left of the cladogram.
Figure 4. Phylogenetic relationships reconstructed on the basis of pairwise DA genetic distances.
ML-based LDA and haplogroup prediction
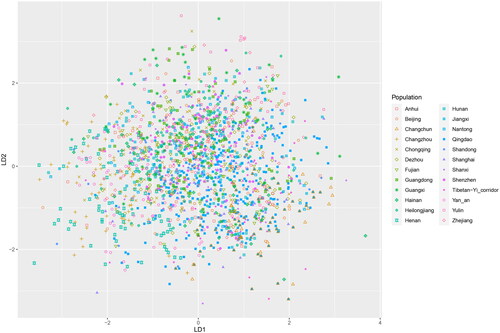
LDA was implemented among the 24 Han populations derived from the reference database. The result of LDA demonstrated how highly integrated the present-day Han people are (). The majority of the Qingdao Han individuals scattered on the right of the plot. In contrast, the Henan Han individuals are mainly found on the left. Moreover, the kNN model was used to predict eight unique haplogroups (C2b1, D1a1, N1a1, N1a2, O1a1, O2a1, O2a2, and R1a1) for the Qingdao Han. Before the prediction, the predictive performance of the kNN model was assessed using the training dataset (overall average accuracy: 97.86%). The confusion matrix showed that most predictions were correct (Supplementary Table S7). The accuracy scores of the predictor were satisfactory (Supplementary Table S8). All the predicted haplogroups are presented in Supplementary Table S2. The first two dominant haplogroups were O2a2 (253/500) and O2a1 (183/500) in the Qingdao Han population.
Figure 5. Population substructure reconstruction for the males of Qingdao Han and other populations and Han populations in China based on LDA method. All samples with null alleles were excluded for analysis.
Discussion
As the SureID® PathFinder Plus Kit possesses 41 Y-STR loci and an overall high value of HD, it was endowed with the potential to differentiate more paternally related males in the Qingdao Han. When the genotyping data were used to reveal the patrilineal genetic landscape, the minimal DA genetic distance was observed among the Han populations from Jilin (Changchun), Shandong (Dezhou), and Henan. This finding was in accordance with a previous study that suggested Han residents on the Shandong peninsula shared a significant connection with Han populations from Northeast China, such as Jilin Province (Zhou et al. Citation2021). Based on records of contemporary Chinese history, severe natural calamities compelled the Shandong Han to relocate continuously to Northeast China (Yao and Wang Citation2016). Meanwhile, millions of Han people from Shandong migrated to the west due to the flood, which can explain such genetic affinities between the Han populations from Qingdao and the Central Plains. In contrast, the Qingdao Han were genetically far from the Tibetans from the Tibetan-Yi corridor and Sichuan. Indeed, their obvious linguistic and cultural differences could be used to explain this finding. Besides, as Qingdao and Sichuan are far from each other, the geographical factor should also be considered. Similar results were found in the MDS plot. However, the Qingdao Han did not fall into the tight cluster of other Han groups. This hints at a distinctive genetic landscape for the maritime cultural city of Qingdao.
Several genetic distance measures can be used to investigate the evolutionary relationships of closely related populations using microsatellite DNA loci. Among them, Nei et al.’s DA distance generally shows correct topology (PC) values (Takezaki and Nei Citation1996). For this reason, the DA genetic distance was chosen to build the NJ phylogenetic tree for the 52 Asian populations (). On the cladogram, the Qingdao Han clustered together with other Han populations from Beijing, Shanxi, Jilin, Henan, and Shandong. They, without exception, come from northern China, which may give a more significant influence on the patrilineal profiles of the Qingdao Han. In general, the distribution of Han populations on the cladogram roughly followed their geographical location and dialect types. Despite this, Qingdao Han did not fall into any cluster. This demonstrates the distinctive nature of this population. Qingdao is a typical representative of Chinese maritime culture. Qingdao, one of the most important Chinese ports, has had frequent personnel exchanges with the world since ancient times. With the decline of China at the turn of the nineteenth century, Qingdao had become the colony of the British, German, and Japanese. Considering the geographic proximity and frequent personnel exchanges in history, Koreans and Japanese were also selected for genetic comparison in this study. However, on the left of the cladogram, both were genetically closer to Hubei Tujia rather than the Qingdao Han. The language of Tujia belongs to the Tibeto-Burman group. Due to a lack of written script, the history of Tujia is still far from uncovered. If we want to explain the affinities among the Tibeto-Burman populations, more population genetic studies and historical records are required. It will also help us to explain why the Tujia, Koreans, and Japanese presented these genetic affinities.
The LDA, a supervised classification technique, is considered a part of crafting competitive machine learning models. It can be used here to evaluate the preliminary performance of Y-STR haplotypes in classifying diverse Han populations. The LDA results indicated that the Qingdao Han deeply integrated into present-day Han people, and it’s tough to distinguish one Han population from another (). As one of the optimal approaches for haplogroup prediction based on Y-STR haplotypes (Yin et al. Citation2022), the kNN model was chosen for this purpose. The kNN predictor had a high level of overall average accuracy. Meanwhile, the sensitivity and specificity for each predicted haplogroup were also shown to be satisfactory in the confusion matrix table. Using the robust ML-based kNN predictor, O2a2 and O2a1 were the first two dominant haplogroups in the Qingdao Han population. These findings were consistent with a former report which suggested haplogroup O2 was more frequent than O1 in four other cities (Binzhou, Dezhou, Heze, and Weihai) of Shandong Province (Zhang et al. Citation2020).
In conclusion, the SureID® PathFinder Plus Kit has great potential application in differentiating more paternally related males, studying genealogy, and uncovering the male-specific history of Qingdao. The genetic affinities between the Han populations from Qingdao and northern China may hint at a frequent gene exchange in this region. Meanwhile, the dominant haplogroups were predicted to be O2a2 and O2a1 in the Qingdao Han populations, which follows the main distribution in northern China. Our study is expected to have a positive impact on the reconstruction of the local patrilineal history and the establishment of a more credible Y-STR database.
Ethical approval
Informed consent was obtained from all participating subjects, and this work was approved by the Ethics Committee of the Affiliated Hospital of Shaoxing University (No. 2021YAN005) and in accordance with the standards of the Declaration of Helsinki.
Supplemental Material
Download PDF (186.1 KB)Supplemental Material
Download MS Excel (152.6 KB)Disclosure statement
No potential conflict of interest was reported by the author(s).
Additional information
Funding
References
- Altman NS. 1992. An introduction to kernel and nearest-neighbor nonparametric regression. Am Stat. 46(3):175–185.
- Fan G, Pan L, Tang P, Zhou Y, Liu M, Luo X. 2021. Technical note: developmental validation of a novel 41-plex Y-STR system for the direct amplification of reference samples. Int J Legal Med. 135(2):409–419.
- Fan GY. 2022. Assessing the factors influencing the performance of machine learning for classifying haplogroups from Y-STR haplotypes. Forensic Sci Int. 340:111466.
- Gu Z, Eils R, Schlesner M. 2016. Complex heatmaps reveal patterns and correlations in multidimensional genomic data. Bioinformatics. 32(18):2847–2849.
- Hansen J. 2005. Using SPSS for Windows and Macintosh: analyzing and understanding data. Amer Stat. 59(1):113–113.
- Lang M, Liu H, Song F, Qiao X, Ye Y, Ren H, Li J, et al. 2019. Forensic characteristics and genetic analysis of both 27 Y-STRs and 143 Y-SNPs in Eastern Han Chinese population. Forensic Sci Int Genet. 42:e13–e20.
- Liu J, Zeng W, Sun B, Mao X, Zhao Y, Wang F, Li Z, et al. 2021. Maternal genetic structure in ancient Shandong between 9500 and 1800 years ago. Sci bull. 66(11):1129–1135.
- Nei M, Tajima F. 1981. DNA polymorphism detectable by restriction endonucleases. Genetics. 97(1):145–163.
- Retief JD. 2000. Phylogenetic analysis using PHYLIP. Methods Mol Biol. 132:243–258.
- Reynolds J, Weir BS, Cockerham CC. 1983. Estimation of the coancestry coefficient: basis for a short-term genetic distance. Genetics. 105(3):767–779.
- Song M, Wang Z, Zhang Y, Zhao C, Lang M, Xie M, Qian X, et al. 2019a. Forensic characteristics and phylogenetic analysis of both Y-STR and Y-SNP in the Li and Han ethnic groups from Hainan Island of China. Forensic Sci Int Genet. 39:e14–e20.
- Song M, Zhao C, Wang Z, Hou Y. 2019b. Applying machine learning algorithms to a real forensic case to predict Y-SNP haplogroup based on Y-STR haplotype. Forensic Sci Int Genet Suppl Ser. 7(1):637–638.
- Subramanian B, Gao S, Lercher MJ, Hu S, Chen WH. 2019. Evolview v3: a webserver for visualization, annotation, and management of phylogenetic trees. Nucleic Acids Res. 47(W1):270–275.
- Takezaki N, Nei M. 1996. Genetic distances and reconstruction of phylogenetic trees from Microsatellite DNA. Genetics. 144(1):389–399.
- Venables WN, Ripley BD, Fernández C. 2002. Modern Applied Statistics with S-PLUS. New Jersey: Blackwell Publishers. p. 302–303.
- Wang L, Oota H, Saitou N, Jin F, Matsushita T, Ueda S. 2000. Genetic structure of a 2,500-year-old human population in China and its spatiotemporal changes. Mol Biol Evol. 17(9):1396–1400.
- Yao J, Wang B. 2016. Genetic Variation of 25 Y-Chromosomal and 15 Autosomal STR Loci in the Han Chinese Population of Liaoning Province, Northeast China. Plos One. 11 (8):e160415.
- Yin C, He Z, Wang Y, He X, Zhang X, Xia M, Zhai D, et al. 2022. Improving the regional Y-STR haplotype resolution utilizing haplogroup-determining Y-SNPs and the application of machine learning in Y-SNP haplogroup prediction in a forensic Y-STR database: a pilot study on male Chinese Yunnan Zhaoyang Han population. Forensic Sci Int Genet. 57:102659–102659.
- Yin C, Su K, He Z, Zhai D, Guo K, Chen X, Jin L, Li S. 2020. Genetic reconstruction and forensic analysis of chinese shandong and yunnan han populations by co-analyzing Y chromosomal STRs and SNPs. Genes. 11(7):743.
- Young FW. 1970. Nonmetric multidimensional scaling: recovery of metric information. Psychometrika. 35(4):455–473.
- Zhang J, Tao R, Zhong J, Sun D, Qiao L, Shan S, Yang Z, et al. 2019. Genetic polymorphisms of 27 Y-STR loci in the Dezhou Han population from Shandong province, Eastern China. Forensic Sci Int Genet. 39:e26–e28.
- Zhang Y, Zhang R, Li M, Luo L, Zhang J, Ding J, Zhang S, et al. 2020. Genetic polymorphism of both 29 Y-STRs and 213 Y-SNPs in Han populations from Shandong Province, China. Leg Med (Tokyo)). 47:101738–101738.
- Zhang Z. 2016. Introduction to machine learning: k-nearest neighbors. Ann Transl Med. 4(11):218–218.
- Zhou Y, Huang L, Liu H, Liu M, Fan G. 2021. Population genetic characteristic for populations on the Shandong peninsula revealed by autosomal STR. Ann Hum Biol. 48(2):157–159.