
Abstract
Background
Alu insertions are bi-allelic and primate-specific, this makes them a useful marker for studying genetic variation, migration patterns, forensic analyses, paternity, and evolutionary heritage; however, specific population studies are limited.
Aim
The objective of this study is to document the level and extent of genetic variation at 39 different Alu loci in five populations (British, Indian Punjabi, Indian Gujarati, Pakistani, and Bangladeshi) from the East Midlands region of the UK. Genetic data on migrant populations is currently limited.
Subjects and Methods
DNA samples (n = 543) were analysed for 39 Alu insertion polymorphisms using specific primers and standard protocols. Data were analysed for population and forensic genetic parameters.
Results
All studied Alus were polymorphic in the British White population while South Asian migrant populations had a variable number of loci which were monomorphic. Highest heterozygosities and lowest match probabilities were observed in the British sample, while the Bangladeshi sample had the lowest heterozygosity and higher match probability.
Conclusion
The analysed Alus insertions (TPA25, Ya5NBC123, Ya5NBC182, Ya5NBC241, and Ya5NBC242) are highly polymorphic and variable among migrant populations. These loci could be useful for population genomic and differentiation studies.
Background
Alu insertion (characterised by the presence of AluI restriction site) DNA sequences of around 300 bp in length are highly abundant (> 1 million repeats) in the human genome, contributing to roughly 11% of the DNA sequence (Batzer and Deininger Citation1991; Batzer et al. Citation1994; Deininger Citation2011). Alu insertions are identical by descent and are members of a larger group of transposable elements called Short Interspersed Nuclear Elements (SINEs) and they randomly distribute themselves throughout the genome (Chadli et al. Citation2009). However, Alus lack removal mechanisms so, once they have been inserted, they propagate in the genome through generations. Alu insertions are stable, bi-allelic, and primate-specific, this makes them a useful marker for studying genetic variation, migration patterns, forensics, paternity, and evolutionary heritage (Stoneking et al. Citation1997; Batzer and Deininger Citation2002; Mastana et al. Citation2003; Watkins et al. Citation2003; Deininger Citation2011; Laybourn et al. Citation2016; Singh et al. Citation2016; Mastana et al. Citation2017). Indian populations often have endogamous marriages and strict religious and cultural traditions that restrict the diversity within native and migrant populations (Pemberton et al. Citation2012; Mastana Citation2014; Sankaran et al. Citation2017; Brearley et al. Citation2020). The purpose of this study is to investigate the levels of genetic variation in a sample of four migrant South Asian and one native White British/European population using a panel of selected Alu polymorphisms and investigate the usefulness of the Alus for genomic variation and genetic differentiation among populations.
Sample and methods
Genomic DNA samples from five different populations were collected to analyse the level of genetic variation. A native British population was analysed besides four South Asian populations; Indian Punjabi (Sikhs), Indian Gujarati, Bangladeshi, and Pakistani, occupying the East Midlands. According to the 2011 census, roughly 12% of the region’s non-white population were Indian, followed by Pakistani (4.4%) and Bangladeshi (3%) (England and Wales 2011 Census). Blood samples were collected from volunteered donations at various sites and local events in parallel with the genetic studies occurring in the East Midlands region at the time. The participants were between the ages of 18 and 60 and confirmed to be unrelated within three generations. Ethnic backgrounds were defined using a questionnaire concentrating on each of the participant’s four grandparents. The participants completed written consent before donating a blood sample. Institutional ethics and the NHS blood donation service approved the collection and analysis of the anonymous samples for genetic analyses. The final East Midlands Alu dataset contained samples from five different ethnic backgrounds; British White (n = 113), Indian Punjabi (n = 133), Indian Gujarati (n = 92), Bangladeshi (n = 100), and Pakistani (n = 105). We hypothesised that there would be a significant genetic variation at different Alu polymorphisms amongst the East Midlands populations based on different population and geographical origins, marriage, and migration patterns.
In this study, 39 different Alu loci were chosen for laboratory analysis based on their level and extent of genetic variation among different populations in previous studies (Watkins et al. Citation2003). DNA extraction was carried out using the salting-out method. The extracted DNA was amplified using specific Alu primers and PCR products were electrophoresed on 2% agarose gel. The gels were scored based on the presence of Insertion or Deletion bands and each locus had three genotypes (Insertion/Insertion, Deletion/Deletion, and Insertion/Deletion). All genotypes were scored by two independent researchers and any discrepancies were repeated. Ten percent of genotypes were repeated randomly to ensure that genotyping was consistent and repeatable. All data were collated in an Excel sheet for further analysis.
Data management and statistical analysis
The genotype data was used to carry out the population genetic analyses and forensic indices calculations. The genotype counts, allele frequencies, observed and expected heterozygosities, inbreeding coefficients, Nei’s genetic distance, and pairwise genetic identity were determined using the GenAlEx 6.5 Excel add-on (Peakall and Smouse Citation2012). A Multidimensional Scaling (MDS) plot of all 39 Alu loci was configured using the NtSys programme to show the observed distances and dissimilarity amongst the five populations (Rohlf Citation2018). Multiple software packages were used to cross-check the consistency in statistical analyses.
Results
presents the results from all the genetic parameters for the Pakistani, Indian Punjabi, Indian Gujarati, Bangladeshi, and British White populations. All the loci in the British population were found to be polymorphic, however, several loci in the migrant South Asian populations were not. Monomorphic loci were not included in further data analysis and comparisons. Bangladeshi and Indian Punjabi samples had seven and six monomorphic loci, respectively, for deletion alleles. Ya5NBC132 and Ya5NBC157 were monomorphic for deletion alleles in all South Asian groups. All Alu loci were polymorphic in the British population.
Table 1. Distribution of genotypes, allele frequencies and population genetic parameters.
Thirteen Alu loci presented a substantial departure from HWE with a significant chi-squared value (p < 0.05–0.001) but none of the loci were significant after Bonferroni correction (Corrected Bonferroni p-value = 0.0001). The highest chi-squared value was recorded at Ya5NBC157 and Ya5NBC241 in the British White population, followed by Ya5NBC45 in the Bangladeshi sample (). Observed (HO) and expected heterozygosity (HE) are displayed in . presents the mean observed and expected heterozygosities, which were highest in the British White population and smallest in the Bangladeshi sample. As expected, all South Asian populations have lower observed heterozygosities. Interestingly, contrary to expectations, the highest average level of inbreeding co-efficient estimate was seen in the British White sample and the smallest mean was measured in the Gujarati population.
Table 2. Averages and standard deviation in all five East Midlands populations.
As expected, the genotype and allele frequencies were variable between individual loci as well as between populations. Multiple pairwise chi-square tests were conducted to assess differences between the study populations. However as there are multiple loci (39) and populations, leading to multi-dimensional relationships between populations, the allele frequency data were used to work out Nei’s unbiased (using sample size) genetic distance matrix to evaluate population differences and affinities (). The British White sample had significant genetic distance from all other South Asian samples, with the highest distance with Bangladeshi and Pakistani samples (0.077), while Pakistani and Punjabi showed the smallest distance (0.002).The genetic distance tree diagram (not included here, but available) and independent multidimensional scaling analysis plot of the populations () confirmed the patterns observed in the distance matrix, with the British White population being distinct from other study populations, with Pakistani and Punjabi populations closely placed in the middle.
Figure 1. Multi-dimensional scaling plot of 39 Alu insertion elements in five populations.
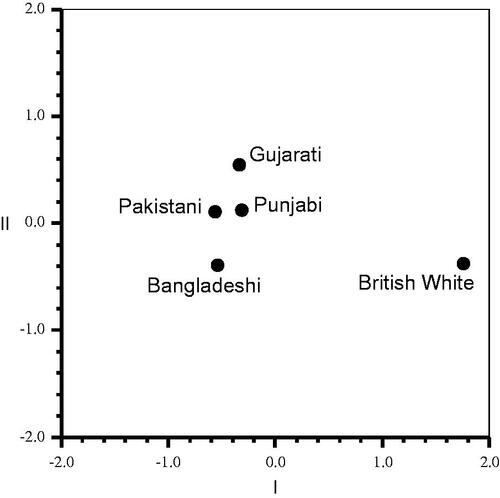
Table 3. Matrix of 39 Alu loci using Nei’s unbiased genetic distance method.
Comment
This is the first study to analyse a large battery of Alu polymorphisms (39) to assess genetic composition and population relationships among a British White and four migrant South Asian populations in the East Midlands region of the UK. Similarities in allele frequencies in migrant South Asian samples indicated a strong common genetic heritage, ancestry, and differing levels of endogamy. This investigation emphasised the importance of understanding population similarities and differences and the effect of different religious traditions on genetic composition (Laybourn et al. Citation2016). The results from this study supported those of other Alu and other genetic polymorphisms (STRs, SNPs), demonstrating the significant genetic variation between South Asian subpopulations and British samples. The process of South Asian groups migrating to Europe promotes genetic drift, which reduces the gene pool size and risks the possibility of certain Alus being lost (Wang et al. Citation1998). Analysed Alus had a high level of discrimination, therefore these could be effective loci in analysing the genetic variation among individuals and populations. Analysis of roughly 50 Alus has been shown to provide the most accurate genetic estimates (Watkins et al. Citation2003). Many of the loci included in this dataset are widely under-studied. Therefore, more research is needed to address the usefulness of Alus in population genomics.
In conclusion, Alu insertions are stable and easy to genotype genetic markers which could be used as an effective tool in population genomics and exploration of population relationships, migration patterns, and ancestry. The results of this study emphasised the genetic divergence between European and South Asian populations, based on geographical location, migration patterns, endogamy, and ancestral lineage.
Disclosure statement
No potential conflict of interest was reported by the author(s).
Data Availability statement
The collated genotype data will be available on request from the corresponding author.
Additional information
Funding
References
- Batzer MA, Deininger PL. 2002. Alu repeats and human genomic diversity. Nat Rev Genet. 3(5):370–379.
- Batzer MA, Deininger PL. 1991. A human-specific subfamily of Alu sequences. Genomics. 9(3):481–487.
- Batzer MA, Stoneking M, Alegria-Hartman M, Bazan H, Kass DH, Shaikh TH, Novick GE, Ioannou PA, et al. 1994. African origin of human-specific polymorphic Alu insertions. Proc Natl Acad Sci U S A. 91(25):12288–12292.
- Brearley EJ, Singh P, Bhatti JS, Mastana S. 2020. Genetic variation and differentiation among a native British and five migrant South Asian populations of the East Midlands (UK) based on CODIS forensic STR loci. Ann Hum Biol. 47(6):572–583.
- Chadli S, Wajih M, Izaabel H. 2009. Analysis of Alu insertion Polymorphisms in South Morocco (Souss): Use of Markers in Forensic Science. Morocco: Faculty of Sciences Ibn Zohr University.
- Deininger P. 2011. Alu elements: know the SINEs. Genome Biol. 12(12):236.
- Laybourn S, Akam E, Cox N, Singh P, Mastana S. 2016. Genetic analysis of novel Alu insertion polymorphisms in selected indian populations. Am J Hum Biol. 28(6):941–944.
- Mastana SS. 2014. Unity in diversity: an overview of the genomic anthropology of India. Ann Hum Biol. 41(4):287–299.
- Mastana SS, Bhatti JS, Singh P, Wiles A, Holland J. 2017. Genetic variation of MHC Class I polymorphic Alu insertions (POALINs) in three sub-populations of the East Midlands, UK. Ann Hum Biol. 44(6):562–567.
- Mastana S, Lee D, Singh P, Singh M. 2003. Molecular genetic variation in the East Midlands, England: analysis of VNTR, STR and Alu insertion/deletion polymorphisms. Ann Hum Biol. 30(5):538–550.
- Peakall R, Smouse PE. 2012. GenAlEx 6.5: genetic analysis in Excel. Population genetic software for teaching and research-an update. Bioinformatics. 28(19):2537–2539.
- Pemberton TJ, Li F-Y, Hanson EK, Mehta NU, Choi S, Ballantyne J, Belmont JW, Rosenberg NA, Tyler-Smith C, Patel PI, et. al. 2012. Impact of restricted marital practices on genetic variation in an endogamous Gujarati group. Am J Phys Anthropol. 149(1):92–103.
- Rohlf FJ. 2018. NTSYSpc: numerical taxonomy system. ver. 2.21w. Port Jefferson (NY): Applied Biostatistics.
- Sankaran S, Sekerdej M, Von Hecker U. 2017. The role of indian caste identity and caste inconsistent norms on status representation. Front Psychol. 8:487.
- Singh G, Talwar I, Sharma R, Matharoo K, Bhanwer AJ. 2016. Genetic differentiation and population structure of five ethnic groups of Punjab (North-West India). Mol Genet Genomics. 291(6):2055–2063.
- Stoneking M, Fontius JJ, Clifford SL, Soodyall H, Arcot SS, Saha N, Jenkins T, Tahir MA, Deininger PL, Batzer MA, et al. 1997. Alu insertion polymorphisms and human evolution: evidence for a larger population size in Africa. Genome Res. 7(11):1061–1071.
- Wang J, Caballero A, Hill W. 1998. The effect of linkage disequilibrium and deviation from Hardy-Weinberg proportions on the changed in genetic variance with bottlenecking. Heredity. 81(2):174–186.
- Watkins WS, Rogers AR, Ostler CT, Wooding S, Bamshad MJ, Brassington A-ME, Carroll ML, Nguyen SV, Walker JA, Prasad BVR, et al. 2003. Genetic variation among world populations: inferences from 100 Alu insertion polymorphisms. Genome Res. 13(7):1607–1618.