
Abstract
Background
Reference ranges for bone turnover markers (BTMs) are still lacking in the healthy Chinese population.
Aim
To establish reference intervals for BTMs and to investigate the correlations between BTMs and bone mineral density (BMD) in Chinese older adults.
Subjects and methods
A community-based cross-sectional study was conducted among 2511 Chinese subjects aged over 50 yrs residing in Zhenjiang, Southeast China. Reference intervals for BTMs (i.e. procollagen type I N-terminal propeptide, P1NP; β cross-linked C-terminal telopeptide of type I collagen, β-CTX) were calculated as the central 95% range of all measurements in Chinese older adults.
Results
The reference intervals of P1NP, β-CTX and P1NP/β-CTX were 15.8–119.9 ng/mL, 0.041–0.675 ng/mL and 49.9–1261.5 for females and 13.6–111.4 ng/mL, 0.038–0.627 ng/mL and 41.0–1269.1 for males, respectively. In the multiple linear regression analysis, only β-CTX was negatively associated with BMD after adjusting for age and body mass index (BMI) in both sex-stratified groups (all p < .05).
Conclusion
This study established age- and sex-specific reference intervals for BTMs in a large sample of healthy Chinese participants ≥ 50 and < 80 years of age and explored the correlations between BTMs and BMD, which provides an effective reference for the assessment of bone turnover in the clinical practice of osteoporosis.
Introduction
Bone remodelling is a dynamic process of spatiotemporal coupling that involves bone resorption mediated by osteoclasts and bone formation induced by osteoblasts. Bone turnover markers (BTMs) are intermediates produced in the catabolic and anabolic processes of bone tissue in osteoblasts and osteoclasts (Garnero Citation2014). They can be measured in serum or urine samples and can effectively reflect rates of bone resorption and bone formation. In the past 20 years, some studies have made substantial progresses in targeting potential bone reconstruction markers and their variability (Liu et al. Citation2020), and biochemical indicators of bone transformation with high sensitivity and specificity have been suggested for clinical use (Vasikaran, Eastell, et al. Citation2011). As early as 2011, serum procollagen type I N-terminal propeptide (P1NP) and serum cross-linked C-terminal telopeptide of type I collagen (β-CTX) levels measured by standardised assay have been suggested by the International Osteoporosis Foundation (IOF) and the International Federation of Clinical Chemistry and Laboratory Medicine (IFCC) as “reference” BTMs in observational and interventional studies (Vasikaran, Cooper, et al. Citation2011). The β-CTX is a degradation product of type I collagen during bone resorption, while P1NP is an intermediate product of type I procollagen metabolism to collagen in bone formation, which can reflect the activity of osteoclasts and osteoblasts, respectively (Vasikaran, Eastell, et al. Citation2011). Notably, studies have shown that the ratio of P1NP to β-CTX has recently been shown to be important for assessing bone status in older adults compared with a single bone turnover marker (Fisher et al. Citation2017; Fisher et al. Citation2018). Accordingly, we are the first study to establish a reference interval for the P1NP/β-CTX ratio, aiming to mine and provide a more stable indicator of bone turnover.
BTMs have now been widely used in clinical practice for evaluating the efficacy of anti-osteoporosis treatment (Vasikaran SD Citation2008), indicating possible secondary causes of osteoporosis (OP), and improving osteoporotic fracture risk assessment (Ivaska et al. Citation2010). In osteoporotic patients, the early effects of anti-osteoporosis treatment can be monitored by assaying BTMs (Szulc Citation2018); for example, after two or three months of starting oral bisphosphate treatment, the processes of bone formation and bone resorption can be dynamically assessed by detecting the levels of BTMs in body fluids. A recent study has reported that PINP and β-CTX screening can be used to detect a lack of adherence to oral bisphosphonate therapy (Kanis et al. Citation2019). Some studies have found independent contributions of BTM measurements to the prediction of fracture risk, with lower levels of BTMs being associated with a reduction in fracture risk (Tian et al. Citation2019).
A long list of factors that have effects on the BTMs lead to low intra-subject and inter-laboratory reproducibility of BTMs (Szulc et al. Citation2017). These factors include age, sex (Rauchenzauner et al. Citation2007), ethnicity (Shetty et al. Citation2016), taking medicine, chronic comorbidities such as diabetes and hypertension (Starup-Linde et al. Citation2014; Vlot et al. Citation2018), etc. Therefore, the levels of BTM in normal health conditions can be used as an important reference. The development of reference intervals for healthy subjects is the first step towards the clinical utilisation of BTMs in the management of bone-related diseases (Szulc Citation2012). Currently, the lack of widely acceptable standards for bone resorption and formation assessment has limited the clinical employment of BTMs. There is an urgent need to establish precise and accurate standard reference ranges for BTMs in normal health conditions or in some disease conditions.
To date, several studies have established reference standards for BTMs, mainly in European populations (de Papp et al. Citation2007; Adami et al. Citation2008) but rarely in Asian populations. Currently, in China, there are only two such cross-sectional studies with reference interval establishment based on gender and age stratification, one in individuals aged 35 to 45 yrs (Hu et al. Citation2013) (subjects over the age of 45 were excluded) and the other in large age stratification groups (per 10 yrs) with a wider range of age (15–>80 yrs) (Li et al. Citation2014). There is an urgent need to establish specific, applicable, and accurate reference intervals for BTMs in healthy populations predisposed to OP, mainly in postmenopausal females and/or older males, which may be further exploited for the prevention, detection and treatment of OP.
To determine reference intervals for P1NP, β-CTX, and P1NP/β-CTX in healthy Chinese middle-aged and older adults, we measured the plasma P1NP and β-CTX levels among 2511 healthy Chinese individuals (>50 yrs), calculated BTM reference ranges for all subjects based on age and sex, and evaluated the trend of BTMs with age. Furthermore, this study further investigated the correlations between BTMs and OP. These findings will provide an initial step towards establishing internationally recognised standards for BTMs in OP prevention and treatment strategies in China.
Subjects and methods
Subjects
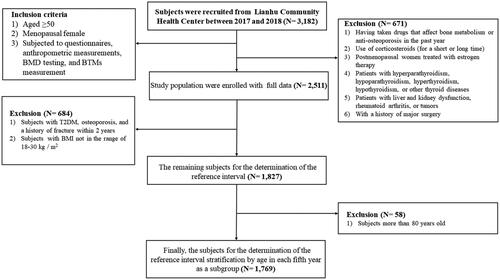
A total of 3182 subjects aged 50 yrs or older were recruited from the Lianhu Community Health Centre in Danyang, Jiangsu Province, Southeast China. Subjects included in the study were (1) aged ≥50 yrs, (2) if female, menopausal, and (3) subjected to questionnaires, anthropometric measurements, BMD testing, and BTM measurement. We also adopted the following string exclusion criteria to select the healthy subjects: (1) had taken drugs that affect bone metabolism or anti-osteoporosis in the past year; (2) had used corticosteroids for short-term (less than 5 mg/d, less than three months) or long-term (5 mg/d, more than three months); (3) postmenopausal females receiving oestrogen therapy; (4) suffered from hyperparathyroidism, hypoparathyroidism, hyperthyroidism, hypothyroidism or other thyroid diseases; (5) suffered from liver and kidney dysfunction, rheumatoid arthritis or tumours; and (6) had a history of major surgery. Each subject provided written informed consent. The study was approved by the Institutional Research Ethics Committee of Soochow University. Finally, 1827 subjects were eventually included in the further analysis ().
Figure 1. Flowchart of the subject selection. BMD: bone mineral density; BTMs: bone turnover markers; BMI: body mass index; T2DM: type 2 diabetes.
Investigation of basic information
The subjects were invited to the community health centre for a face-to-face interview by using a uniform questionnaire. The trained medical personnel collected relevant data, including basic personal information (sex, age, female menopausal status) and physician-confirmed diseases (hypertension, hyperlipidaemia, T2DM, history of fractures, etc.). Anthropometric parameters, including height and weight, were measured, and body mass index (BMI) was calculated.
BMD measurements
BMD (g/cm2) was measured by dual-energy X-ray absorptiometry densitometers (Prodigy, USA) at three skeletal sites: the lumbar spine (LS, vertebrae L1-L4), femoral neck (FN), and total hip (TH). The instrument was operated by professionally trained radiology medical staff, and quality control was strictly carried out by using the lumbar prosthesis provided by the manufacturer before daily measurement. T-scores were automatically calculated by software as the number of standard deviations below the average for young adults at peak bone density (World Health Organization Citation2003). OP (T ≤ −2.5), osteopenia (−1 < T value < −2.5), and normal BMD (T value ≥ − 1) were defined according to the WHO recommendations (Kanis and Kanis Citation1994). Both OP and osteopenia were defined as the abnormal bone mass in this study.
BTM measurement
All blood samples were taken between 8:00 and 10:00 am. Under the fasting state of subjects, 5 mL of venous blood was collected into a glass tube containing sodium citrate as an anticoagulant from each subject by professional medical personnel. The plasma was separated by low-speed centrifugation (500 × g for 15 min) and stored at −80 °C.
We used enzyme-linked immunosorbent assay (ELISA) to detect and measure BTM levels by using the corresponding P1NP and β-CTX test kits (PHICON Biotech, Guangzhou, China), which have been approved by the State Food and Drug Administration of China for clinical diagnosis (registration No: 20152400980 and 20142400412, respectively). The kit for measuring P1NP has high specificity and less than 5% cross-reactivity with human PIINP and PIIINP homologous sequences. In addition, there is a high sensitivity with a detection range between 5 and 780 ng/mL, and it is not limited by food intake and has good reproducibility. The kit for measuring β-CTX has good detection limits of 0.025 ng/mL–3.380 ng/mL with good reproducibility, which ensures the reliability and accuracy of the measurement results. The intra- and inter-assay coefficients of variation were both under 10%. The detection of BTMs in each batch was accomplished simultaneously by the same technician using the same kit according to the operating process provided by the manufacturer and special laboratory quality control procedures. Plasma samples were diluted 1:2000 for strict duplicate testing. Absorbance was measured at 450 nm within half an hour after the colour reaction was stopped by adding tetramethylbenzidine (TMB) using an ELISA plate reader.
Statistical analysis
The quantitative data were described by the mean ± standard deviation (SD) or median (P25, P75), while the qualitative data were described by numbers and percentage values. When comparing the differences in general characteristics between male and female groups, the t-test was used for the quantitative data with a normal distribution; the Kruskal–Wallis test was used for the quantitative data with non-normal distributions and χ2 test was used for categorical data. P1NP and β-CTX showed normal distributions after square root transformation. In studying the potential impact of underlying diseases on BTMs, the t-test was used to compare the differences between the two groups. Spearman correlation analysis was used to study the correlation between BTMs and BMD. The reference interval was defined as the 95% reference value range of all observations (percentile 2.5–97.5). The study also analysed the independent associations between P1NP, β-CTX, and P1NP/β-CTX and the BMD of the three parts in males and females through multiple linear regression models. All tests were two-sided, and a p value <.05 was considered statistically significant.
Smoothed centile curves of the level of BTMs against age were constructed with the Lambda-Mu-Sigma (LMS) method. In addition, we used scatter plots and local weighted regression curves (LOWESS curves) with 95% confidence intervals to observe the trend of BTMs with age. We also investigated the shape of the relationship between BTMs with BMD by restricted cubic spline (RCS) function with three knots. Covariates included in RCS models were age and BMI to control for their potential confounding effects.
All statistical analyses were performed using SPSS (version 22.0) software and R program (version 3.6.1), and p values < .05 were considered as significant statistical difference.
Results
Basic characteristics of the participants and sex-stratified analysis
After subject exclusion, a total of 2511 older Chinese people aged over 50 years were enrolled in this study, including 1110 males (44.2%) and 1401 females (55.8%). The median age of the participants was 65 yrs, and the mean BMI was 24.9 kg/m2. The basic characteristics of the study population, including demographics, underlying disorders, and plasma concentrations of BTMs for the sex-specific group, are presented in Supplementary Table 1. All the basic characteristics were significantly different between the male and female samples (p < .05). In addition, females exhibited higher P1NP and β-CTX levels than males, while P1NP/β-CTX levels were lower than males (Table S1). Therefore, the following analyses were conducted in sex-stratified subgroups.
BTMs levels and related diseases
We further investigated the influence of related diseases on the levels of BTMs, as shown in Table S2. The study subjects were divided into two groups: normal and osteoporosis. Overall, there were also some significant differences in BTM levels between males and females with varying BMD status at the three sites, where individuals with a lower BMD appear to have a higher level of bone turnover. Afterwards, the study subjects were divided into two groups according to the presence of a history of fracture. Higher levels of P1NP were detected in males with a history of fracture than in those without (p < .05), while there was no difference between the two groups in females. In addition, the results based on sex stratification showed no significant differences in β-CTX levels between the two groups (Table S2). Both female and male participants with T2DM had lower levels of P1NP than controls without T2DM, while β-CTX was only lower in females with T2DM (p < .05). When the levels of BTMs were compared between individuals with and without hypertension and hyperlipidaemia, there was no statistical difference in the levels of P1NP and β-CTX in either male or female samples (p > .05) (Table S2).
Establishing reference intervals of P1NP, β-CTX and P1NP/β-CTX
According to the above findings that T2DM, OP, and a history of fracture within 2 yrs have effects on bone metabolism, participants with such disease conditions were excluded. Considering BMI as another known determinant affecting BTMs, participants whose measurements were not between 18 and 30 kg/m2 were also excluded. Accordingly, the remaining 1,827 older adults, including 946 males and 881 females, were used to establish the reference intervals. The reference intervals of the BTMs were obtained by defining the central 95% range of all measurement results (percentile 2.5–97.5). In older males, the reference intervals were 13.6–111.4 ng/mL for P1NP, 0.038–0.627 ng/mL for β-CTX and 41.0–1269.1 for P1NP/β-CTX, respectively. In older females, the reference intervals were 15.8–119.9 ng/mL for P1NP, 0.041–0.675 ng/mL for β-CTX and 49.9–1261.5 for P1NP/β-CTX, respectively ().
Table 1. Reference intervals of P1NP, β-CTX and P1NP/β-CTX for the older adults.
Due to the complex effects of age and menopausal status on bone metabolism, we further subdivided the age at each 5-year interval for male and female participants to establish reference intervals for different age subgroups. In addition, older adults aged over 80 years were not included in the study due to their extremely small sample size. shows the established reference intervals for the BTM levels in the remaining 1769 older adults. intuitively shows the 95% reference range and median of the observed values. The Kruskal–Wallis test found that the levels of P1NP and β-CTX were statistically different between males and females in some age-stratified groups, e.g. 50–54, 60–64, 65–69, and 70–74 yrs for P1NP; 50–54, 60–64, 70–74, 75–79 yrs for β-CTX. However, no significant differences for P1NP/β-CTX between males and females were detected in any of the subgroups (p > .05) ().
Figure 2. Reference intervals of P1NP, β-CTX and P1NP/β-CTX in different age groups of the older adults. (a) Male P1NP; (b) Female P1NP; (c) Male β-CTX; (d) Female β-CTX; (e) Male P1NP/β-CTX; (f) Female P1NP/β-CTX.
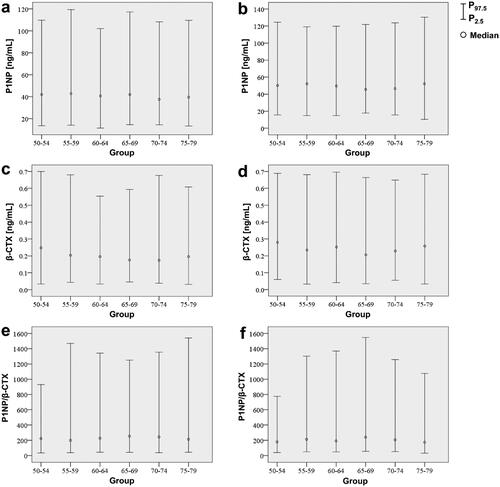
Table 2. Establishment and comparison of reference values for BTMs between older men and postmenopausal women after stratification by 5 yr increments in the older adults.
Scatter plots and LOWESS curves of age-dependent BTMs levels in older adults
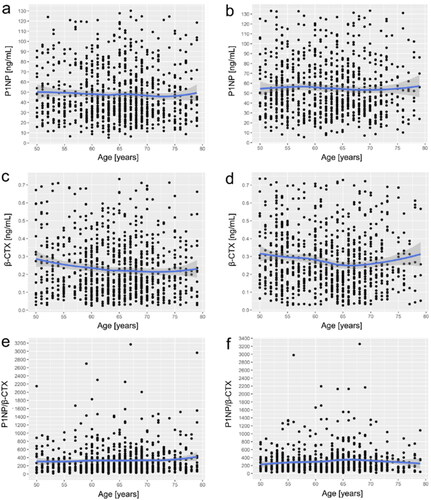
A series of scatterplots with LOWESS curves showed the trends in plasma BTMs levels with age in older men and postmenopausal females (). On the one hand, for plasma P1NP, the LOWESS curve showed that P1NP levels barely changed with age in both sex-stratified groups; however, relative to males, P1NP level was slightly higher in females, which started with a slight lift from 50 to 55 yrs and followed a stepwise decline (). On the other hand, for plasma β-CTX, the LOWESS curve for males indicated that individuals aged 50–65 yrs had concentrations of β-CTX that decreased with age and was almost at a plateau during the latter age period (). The LOWESS curve for females suggested that among postmenopausal females aged 50–65 yrs, the trend in β-CTX with age was similar to that of males in the same age group, except that the magnitude of change may be slightly greater than that in males. Notably, β-CTX concentrations in postmenopausal females showed a trend of slowly elevating with age after 65 yrs (). In addition, we investigated the trend of P1NP/β-CTX with age, neither of which revealed large fluctuations, and the trend of P1NP/β-CTX levels was almost flat throughout the old age period (50–79 yrs), as shown in .
Figure 3. Scatter plots and LOWESS curves of age-dependent BTM levels in older men and postmenopausal women. (a) Male P1NP; (b) Female P1NP; (c) Male β-CTX; d) Female β-CTX; (e) Male P1NP/β-CTX; (f) Female P1NP/β-CTX. The single values (black dots) and the trend lines (blue lines) with 95% confidence intervals (shaded in light blue) shown in the figure were obtained by the LOWESS regression model. BTM-bone turnover markers; LOWESS curve-local weighted regression curves.
Smoothed centile curves of BTMs level against age
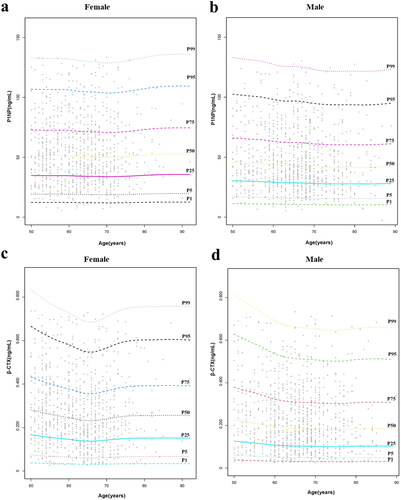
The continuous centile curves for the BTMs level against age are displayed in . Similar to the trend shown in LOWESS curves, the level of P1NP hardly changed with age in both male and female groups (). For β-CTX, levels slowly decreased with age from 50 to 65 years in both sexes. Of note, in postmenopausal women, there is a transient elevation of β-CTX levels between the ages of 65 and 70 years, followed by a flat trend, as in men. Similarly, overall levels of β-CTX were higher in women than in men.
Figure 4. Scattered diagram and centile curves of BTM levels against age in older men and postmenopausal women. (a) Female P1NP; (b) Male P1NP; (c) Female β-CTX; (d) Male β-CTX. The 1rd, 5th, 25th, 50th, 75th, 95th and 99th centile curves are shown respectively. BTM-bone turnover markers.
Correlation analysis of BTMs and BMD in different bone sites
In 1827 subjects, the relationship between BTMs and BMD is given in . The results showed that P1NP was positively correlated with β-CTX in both older males and postmenopausal females (r = 0.142 in males; r = 0.174 in females; both p < .001). For older males, P1NP and β-CTX were both negatively correlated with LS-, FN- and TH-BMD, respectively; whereas P1NP/β-CTX was positively correlated with BMD at the three sites (all p < .05), of which only the correlation coefficient between β-CTX and BMD at each site was relatively large (absolute value of r > 0.1). Subsequently, in postmenopausal females, the β-CTX level was similarly observed to be negatively correlated with BMD at all three sites, but the absolute values of the correlation coefficients were smaller than those in males (all p < .05). We detected no correlation between P1NP and BMD at any of the three sites. Likewise, except for the other two sites, P1NP/β-CTX was positively correlated with LS-BMD (p < .05) ().
Table 3. Correlations between BTMs and BMD at different skeletal sites.
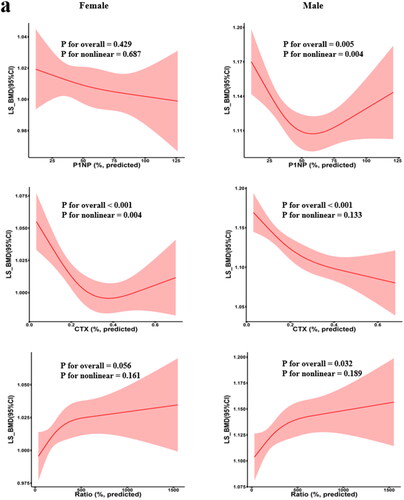
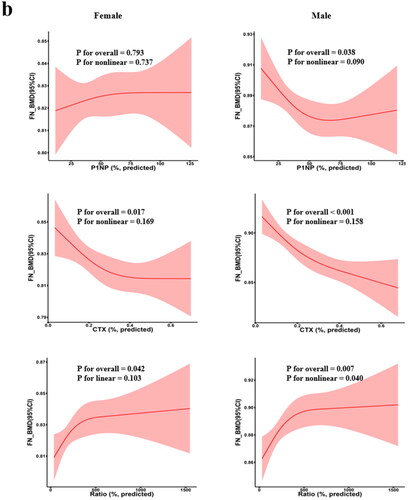
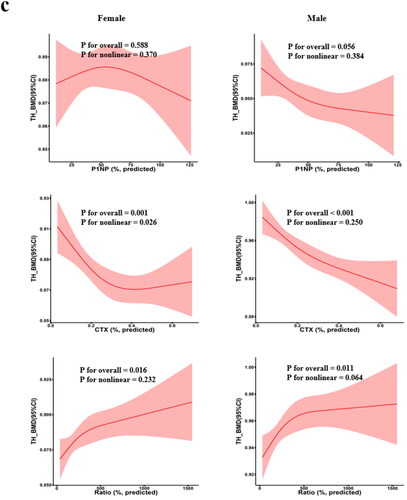
RCS was used to determine whether a non-linear association exists between BTMs and BMD (). For example, in females, we found non-linear associations between β-CTX with LS-BMD and TH-BMD (p for overall <.05, p for nonlinear <.05) . In addition, we found a negative linear relationship between β-CTX and FN-BMD (p for overall <.05, p for nonlinear >.05). In males, the results showed a negative linear association between β-CTX and BMD at all three sites (p for overall <.05, p for nonlinear >.05). However, the results also revealed that the relations between PINP and BMD at any sites in females were neither linear nor non-linear.
Figure 5. Restricted cubic spline regression between BTM levels and BMD. Adjusted for age AND BMI. The shaded area represents the 95% confidence intervals. (a) LS-BMD; (b) FN-BMD; (c) TH-BMD; BMD: bone mineral density; BMI: body mass index.
Multiple linear regression analysis with BMD as the dependent variable
LS-, FN- and TH-BMD were used as dependent variables, P1NP, β-CTX, and P1NP/β-CTX were utilised as independent variables, and age and BMI were regarded as cooperative variables to analyse the independent association between BTMs and BMD through multiple linear regression models in males and females, respectively. The results showed that after adjusting for age and BMI, β-CTX in both males and females still showed an association with BMD at all three sites, while P1NP and P1NP/β-CTX were no longer associated with BMD ().
Table 4. Multiple linear regression analyses between BMD and other covariates.
Discussion
Recently, the measurement of BTMs has been easy, quick, and less invasive and has been used as an additional tool to assess anti-osteoporotic efficacy, predict fracture risk, and explore OP pathogenesis. To properly assess bone turnover based on these markers in subjects of different ages and health conditions, it is important to establish reference intervals for BTMs from a representative sample of the healthy adult population. In this large cross-sectional analysis of healthy Chinese middle-aged and older people, we rigorously screened the included subjects to reduce the confounding influence for the establishment of reference intervals and excluded patients with T2DM, OP, and a history of fracture/bone fissure within 2 yrs.
Our study separately compared the levels of BTMs between participants with different bone mass in three segments of the LS, FN, and TH, respectively. Consistent with our findings, previous studies (Shou et al. Citation2017; Nguyen et al. Citation2018) have reported that older people with abnormal bone mass have higher bone turnover levels than those with normal bone mass, both in terms of P1NP and β-CTX levels. Notably, we observed a significant positive and linear correlation between PINP and β-CTX levels, suggesting that individuals with abnormal bone mass are accompanied by hyperactive bone turnover, a process in which bone resorption and bone formation are coupled.
As previously reported, we focussed on the possible impact of common chronic comorbidities in older adults on their BTMs levels. In an exploration of the relationship between common metabolic diseases and BTMs levels in older adults, neither P1NP nor β-CTX was associated with hypertension or hyperlipidaemia in males and females, which was consistent with the findings of another study (Shou et al. Citation2017) conducted among Chinese older adults. Of note, patients with T2DM in both females and males showed lower levels of P1NP than nondiabetic individuals, and the same trend was observed for β-CTX levels in females, which is consistent with previous findings that very old Chinese males with T2DM exhibited lower serum P1NP, β-CTX and OC levels (Shou et al. Citation2017). Recently, data from a cross-sectional study in Han Chinese males aged over 50 yrs also showed that BTMs such as P1NP and β-CTX were negatively correlated with the presence of abnormal glycometabolism (Liu et al. Citation2019). Similar results were reported in postmenopausal females (Farr et al. Citation2014) and in a systematic review (Hygum et al. Citation2017).
Accumulating evidence from experimental studies (Picke et al. Citation2019; Liu R et al. Citation2020) has shown that T2DM represents a condition of low bone turnover with suppressed bone resorption and, to a greater extent, bone formation, which is often accompanied by insulin resistance, impaired bone cell function, secretion of inflammatory factors, damaged collagen formation and changes in bone marrow fat content (Eller-Vainicher et al. Citation2020). Overall, these findings suggested that both male and female T2DM patients exhibit a lower bone turnover status and that disturbances in glucose metabolism may affect bone formation through different complex pathways. Given that BMD may underestimate the fracture risk in T2DM patients, BTMs serve as a class of promising markers to gain further insight into the pathogenesis of low bone turnover associated with T2DM, which may help to improve the detection and monitoring of treatment for T2DM patients with an enhanced risk of fracture.
We compared the established reference intervals with those from two other studies performed in Chinese (Hu et al. Citation2013; Li et al. Citation2014). Due to large differences in study designs, the results across these studies are limited in how comparable they are. However, it should be noted that significantly higher levels of PINP and β-CTX were consistently detected in postmenopausal females than in males between 50 and 64 yrs, suggesting that the increased bone remodelling in postmenopausal females is partly related to the rapid decrease in oestrogen (Hoshino et al. Citation2000; Seifert-Klauss et al. Citation2012). Generally, our measured reference values for P1NP were similar to those previously reported, but the reference values for β-CTX levels we examined were lower than those previously reported. These different results from the same country may be due to age stratification intervals, test method, lifestyle habits, circadian rhythm, menstrual changes, seasonal influence, food intake, environment, physical activity or other factors that affect BTMs levels.
Some studies have shown that in older adults, the use of P1NP/β-CTX allows a better assessment of the bone turnover status than the use of a bone turnover marker alone (Fisher et al. Citation2018). Therefore, our study also determined the reference intervals for P1NP/β-CTX in older adults. We found that females had a smaller P1NP/β-CTX ratio than males in almost all age-stratified subgroups except for the 55–59 group. This reflects an imbalance between total bone formation and resorption in favour of the latter. To the best of our knowledge, no study has established a reference interval for P1NP/β-CTX. It has been shown that P1NP/β-CTX in older adults better provides an assessment of the bone state and predicts osteoporotic fractures than using a single marker alone (Fisher et al. Citation2017; Muller et al. Citation2019). Our study fills the gap in the reference interval of P1NP/β-CTX, which may help clinicians better evaluate the bone status of older adults aged over 50 years in China through BTMs, providing a basis for developing appropriate disease prevention strategies and assessing the risk of osteoporotic fractures.
Our LOWESS curves and smoothed centile curves assessed the trend of BTMs levels with age. We found that the trend of P1NP level with age was relatively stable in both females and males. These findings were similar to those in Germans (Michelsen et al. Citation2013) and in Vietnamese (Nguyen et al. Citation2018). On the other hand, there were some differences in the age trend of β-CTX among Chinese and German older males (Michelsen et al. Citation2013). The β-CTX of German males decreased with age from 25 to 55 yrs and then reached a plateau, while our study only targeted people aged over 50 yrs and found that the decline of β-CTX in Chinese males continued to 65 yrs and then gradually entered a plateau period. In addition, the levels of β-CTX differed in the age trend of females compared to our study. Overall, after comparing the trends of P1NP and β-CTX with age for Chinese, German, and Vietnamese people of the same age group, there were indeed some differences in bone turnover phenotypes across different countries and ethnicities, which further confirmed the existence of ethnic and geographic differences in BTMs reported in some previous studies (Fares et al. Citation2003; VäLimäKi et al. Citation2004; Nguyen et al. Citation2018). In addition, our study revealed a relative plateau in P1NP/β-CTX from age 50 to 75 in both older males and postmenopausal females. However, the curve showed a small decrease after 65 years in postmenopausal females, reflecting that the balance between bone formation and resorption is more skewed towards bone resorption. As soon as bone homeostasis is broken, it is suggested that we should pay careful attention to the occurrence of osteoporosis and bone fracture (Fisher et al. Citation2018).
A previous study (Shou et al. Citation2017) considered that there was a correlation between P1NP and β-CTX in older males, and they were both negatively correlated with BMD in the LS, FN, or TH area, which was consistent with our findings. In addition, we found that P1NP/β-CTX was positively correlated with BMD at the three sites in males. In females, β-CTX was negatively correlated with BMD at each site, P1NP/β-CTX was also positively correlated with LS BMD, while P1NP had no significant association with either BMD. The abovementioned study in Vietnamese males and females (Nguyen et al. Citation2018) had similar findings for the analysis of the association between BMD and BTMs, except that it did not examine variables such as TH-BMD and P1NP/β-CTX. Conversely, significant positive correlations between P1NP level and BMD were described in premenopausal females with systemic lupus erythematosus (SLE) (Seguro et al. Citation2015). Alexander Fisher et al. provided a possible explanation for the contradictory relationship between P1NP and BMD (Fisher et al. Citation2018). They suggested that higher P1NP would only become a risk factor for fracture in the presence of higher β-CTX and lower P1NP/β-CTX. The increase or decrease in P1NP may be related to positive or negative effects on BMD, respectively, depending on the levels of β-CTX and P1NP/β-CTX; therefore, separate explanations are not recommended (Fisher et al. Citation2018). These observations also strongly suggest that compared to using each BTM alone, P1NP/β-CTX is of great significance in assessing bone state, and a well-balanced formation/resorption process appears to be protective against OP (Fisher et al. Citation2018), echoing the findings of a positive association between P1NP/β-CTX and BMD in our study. In addition, we visualised the relationship between BTM and BMD. In general, in addition to the consistent negative linear correlation between β-CTX and BMD in males, other significant associations show more complex patterns.
In summary, our study established reliable reference intervals for P1NP, β-CTX, and P1NP/β-CTX in Chinese older males and postmenopausal females aged over 50 years and found that in either males or females, β-CTX was always negatively correlated with BMD in LS, FN, and TH sites after adjusting for age and BMI. We further explored the trends of plasma P1NP, β-CTX, and P1NP/β-CTX levels with age in Chinese older adults. As we expected, the reference ranges for BTMs were variable depending on factors such as sex, age, comorbid diseases, disease duration, and physiological status. The possible impact of other uncontrollable factors must also be considered when interpreting abnormal results with reference intervals in practical applications. Certain limitations of this study should also be acknowledged. First, since this study was a cross-sectional study, it was not possible to dynamically assess the changes in bone metabolism during biologic variation. Second, because older adults and those with poor health do not volunteer, the relatively small sample size of much older adults, aged over 80 yrs, limited the applicability of the reference intervals established in this subgroup. Third, there are certain differences in detection efficiency between different commercial kits, especially for CTX, which may lead to inter-assay variability of detection values between different studies. However, our study was community-based with full population recruitment, guaranteeing the stability and randomness of sample sources, as well as the representativeness of detection data. These limitations did not affect the reference intervals of the BTMs we established.
Therefore, we developed and provided a good reference standard for BTMs in healthy older males and postmenopausal females in China based on age and sex stratification, which may potentially provide a basis for the early diagnosis of OP in clinical practice as well as for monitoring the treatment of OP. In addition, most middle-aged and older adults suffer from chronic diseases such as diabetes, hypertension, and hyperlipidaemia, which may affect the levels of BTMs to a greater or lesser extent. In fact, these confounding factors inevitably make it difficult to effectively use BTMs to monitor the onset, treatment, and prognosis of OP.
Authorship contributions
Authors SFL, LLS, and FYD designed the study. Authors LLS and SFL prepared the first draft of the paper. Authors RRC, JDW, and GLZ contributed to the experimental work. Authors JDW, GLZ, and FYD obtained the data. Authors LLS and RRC were responsible for the statistical analysis of the data. All authors revised the paper critically for intellectual content and approved the final version. All authors agree to be accountable for the work and to ensure that any questions relating to the accuracy and integrity of the paper are investigated and properly resolved.
Supplemental Material
Download PDF (441.4 KB)Acknowledgements
The study was supported by the Natural Science Foundation of China (81872681, 82173529, 82173598, and 82103922), the Science and Technology Project of Suzhou (SS202050, SYS2019024), the QingLan Research Project of Jiangsu Province, the project from Lianhu Community Health Service Center of Danyang, and a Project of the Priority Academic Program Development of Jiangsu Higher Education Institutions.
Disclosure statement
LLS, RRC, JDW, GLZ, FYD and SFL declare that they have no conflicts of interest.
Additional information
Funding
References
- Adami S, Bianchi G, Brandi ML, Giannini S, Ortolani S, DiMunno O, Frediani B, Rossini M. 2008. Determinants of bone turnover markers in healthy premenopausal women. Calcif Tissue Int. 82(5):341–347.
- de Papp AE, Bone HG, Caulfield MP, Kagan R, Buinewicz A, Chen E, Rosenberg E, Reitz RE. 2007. A cross-sectional study of bone turnover markers in healthy premenopausal women. Bone. 40(5):1222–1230.
- Eller-Vainicher C, Cairoli E, Grassi G, Grassi F, Catalano A, Merlotti D, Falchetti A, Gaudio A, Chiodini I, Gennari L. 2020. Pathophysiology and management of type 2 diabetes mellitus bone fragility. J Diabetes Res. 2020:7608964.
- Fares JE, Choucair M, Nabulsi M, Salamoun M, Shahine CH, Fuleihan GE-H. 2003. Effect of gender, puberty, and vitamin D status on biochemical markers of bone remodedeling. Bone. 33(2):242–247.
- Farr JN, Drake MT, Amin S, Melton LJIII, McCready LK, Khosla S. 2014. In vivo assessment of bone quality in postmenopausal women with type 2 diabetes. J Bone Miner Res. 29(4):787–795.
- Fisher A, Fisher L, Srikusalanukul W, Smith PN. 2018. Bone turnover status: classification model and clinical implications. Int J Med Sci. 15(4):323–338.
- Fisher A, Srikusalanukul W, Fisher L, Smith PN. 2017. Lower serum P1NP/betaCTX ratio and hypoalbuminemia are independently associated with osteoporotic nonvertebral fractures in older adults. Clin Interv Aging. 12:1131–1140.
- Garnero P. 2014. New developments in biological markers of bone metabolism in osteoporosis. Bone. 66:46–55.
- Hoshino H, Kushida K, Takahashi M, Yamazaki K, Denda M, Atsumi K, Oikawa M, Toyoyama O, Kawana K, Inoue T. 2000. Changes in levels of biochemical markers and ultrasound indices of Os calcis across the menopausal transition. Osteoporos Int. 11(2):128–133.
- Hu WW, Zhang Z, He JW, Fu WZ, Wang C, Zhang H, Yue H, Gu JM, Zhang ZL. 2013. Establishing reference intervals for bone turnover markers in the healthy shanghai population and the relationship with bone mineral density in postmenopausal women. Int J Endocrinol. 2013:1–7.
- Hygum K, Starup-Linde J, Harslof T, Vestergaard P, Langdahl BL. 2017. MECHANISMS IN ENDOCRINOLOGY: diabetes mellitus, a state of low bone turnover – a systematic review and meta-analysis. Eur J Endocrinol. 176(3):R137–R157.
- Ivaska KK, Gerdhem P, Vaananen HK, Akesson K, Obrant KJ. 2010. Bone turnover markers and prediction of fracture: a prospective follow-up study of 1040 elderly women for a mean of 9 years. J Bone Miner Res. 25(2):393–403.
- Kanis JA, Kanis JA. 1994. Assessment of fracture risk and its application to screening for postmenopausal osteoporosis: synopsis of a WHO report. Osteoporosis Int. 4(6):368–381.
- Kanis JA, Cooper C, Rizzoli R, Reginster JY. 2019. European guidance for the diagnosis and management of osteoporosis in postmenopausal women. Osteoporos Int. 30(1):3–44.
- Li M, Li Y, Deng W, Zhang Z, Deng Z, Hu Y, Xia W, Xu L. 2014. Chinese bone turnover marker study: reference ranges for C-terminal telopeptide of type I collagen and procollagen I N-terminal peptide by age and gender. PLOS One. 9(8):e103841.
- Liu M, Lu Y, Cheng X, Ma L, Miao X, Li N, Sun B, Yan S, Li J, Li C. 2019. Relationship between abnormal glucose metabolism and osteoporosis in Han Chinese men over the age of 50 years. Clin Interv Aging. 14:445–451.
- Liu R, Wang Y, Li J, Han H, Xia Z, Liu F, Wu K, Yang L, Liu X, Zhu C. 2020. Decreased T cell populations contribute to the increased severity of COVID-19. Clin Chim Acta. 508:110–114.
- Liu XX, Jiang L, Liu Q, Zhang J, Niu W, Liu J, Zhang Q. 2020. Low bone turnover markers in young and middle-aged male patients with type 2 diabetes mellitus. J Diabetes Res. 2020:1–8.
- Michelsen J, Wallaschofski H, Friedrich N, Spielhagen C, Rettig R, Ittermann T, Nauck M, Hannemann A. 2013. Reference intervals for serum concentrations of three bone turnover markers for men and women. Bone. 57(2):399–404.
- Muller MK, Gero D, Reitnauer D, Vetter D, Eshmuminov D, Hornemann T, Bueter M. 2019. The impact of Roux-en-Y gastric bypass on bone remodeling expressed by the P1NP/betaCTX ratio: a single-center prospective cohort study. Obes Surg. 29(4):1185–1194.
- Nguyen LT, Nguyen UDT, Nguyen TDT, Ho-Pham LT, Nguyen TV. 2018. Contribution of bone turnover markers to the variation in bone mineral density: a study in Vietnamese men and women. Osteoporos Int. 29(12):2739–2744.
- Picke AK, Campbell G, Napoli N, Hofbauer LC, Rauner M. 2019. Update on the impact of type 2 diabetes mellitus on bone metabolism and material properties. Endocr Connect. 8(3):R55–R70.
- Rauchenzauner M, Schmid A, Heinz-Erian P, Kapelari K, Falkensammer G, Griesmacher A, Finkenstedt G, Hogler W. 2007. Sex- and age-specific reference curves for serum markers of bone turnover in healthy children from 2 months to 18 years. J Clin Endocrinol Metab. 92(2):443–449.
- Seguro LP, Casella CB, Caparbo VF, Oliveira RM, Bonfa A, Bonfa E, Pereira RM. 2015. Lower P1NP serum levels: a predictive marker of bone loss after 1 year follow-up in premenopausal systemic lupus erythematosus patients. Osteoporos Int. 26(2):459–467.
- Seifert-Klauss V, Fillenberg S, Schneider H, Luppa P, Mueller D, Kiechle M. 2012. Bone loss in premenopausal, perimenopausal and postmenopausal women: results of a prospective observational study over 9 years. Climacteric. 15(5):433–440.
- Shetty S, Kapoor N, Bondu JD, Thomas N, Paul TV. 2016. Bone turnover markers: emerging tool in the management of osteoporosis. Indian J Endocrinol Metab. 20(6):846–852.
- Shou Z, Jin X, Bian P, Li X, Chen J. 2017. Reference intervals of beta-C-terminal telopeptide of type I collagen, procollagen type I N-terminal propeptide and osteocalcin for very elderly Chinese men. Geriatr Gerontol Int. 17(5):773–778.
- Starup-Linde J, Eriksen SA, Lykkeboe S, Handberg A, Vestergaard P. 2014. Biochemical markers of bone turnover in diabetes patients–a meta-analysis, and a methodological study on the effects of glucose on bone markers. Osteoporos Int. 25(6):1697–1708.
- Szulc P. 2012. The role of bone turnover markers in monitoring treatment in postmenopausal osteoporosis. Clin Biochem. 45(12):907–919.
- Szulc P. 2018. Bone turnover: biology and assessment tools. Best Pract Res Clin Endocrinol Metab. 32(5):725–738.
- Szulc P, Naylor K, Hoyle NR, Eastell R, Leary ET, National BHAB, Turnover Marker P. 2017. Use of CTX-I and PINP as bone turnover markers: national bone health alliance recommendations to standardize sample handling and patient preparation to reduce pre-analytical variability. Osteoporos Int. 28(9):2541–2556.
- Tian A, Ma J, Feng K, Liu Z, Chen L, Jia H, Ma X. 2019. Reference markers of bone turnover for prediction of fracture: a meta-analysis. J Orthop Surg Res. 14(1):68.
- VäLimäKi V-V, Alfthan H, Ivaska KK, LöYttyniemi E, Pettersson K, Stenman U-H, VäLimäKi MJ, 2004. Serum estradiol, testosterone, and sex hormone-binding globulin as regulators of peak bone mass and bone turnover rate in young Finnish men. J Clin Endocrinol Metab. 89(8):3785–3789.
- Vasikaran S, Cooper C, Eastell R, Griesmacher A, Morris HA, Trenti T, Kanis JA. 2011. International osteoporosis foundation and international federation of clinical chemistry and laboratory medicine position on bone marker standards in osteoporosis. Clin Chem Lab Med. 49(8):1271–1274.
- Vasikaran S, Eastell R, Bruyère O, Foldes AJ, Garnero P, Griesmacher A, McClung M, Morris HA, Silverman S, Trenti T, et al. 2011. Markers of bone turnover for the prediction of fracture risk and monitoring of osteoporosis treatment: a need for international reference standards. Osteoporos Int. 22(2):391–420.
- Vasikaran SD. 2008. Utility of biochemical markers of bone turnover and bone mineral density in management of osteoporosis. Crit Rev Clin Lab Sci. 45(2):221–258.
- Vlot MC, den Heijer M, de Jongh RT, Vervloet MG, Lems WF, de Jonge R, Obermayer-Pietsch B, Heijboer AC. 2018. Clinical utility of bone markers in various diseases. Bone. 114:215–225.
- World Health Organization. 2003. Prevention and management of osteoporosis. World Health Organ Tech Rep Ser. 921:1–164, bsckcover.