
 ?Mathematical formulae have been encoded as MathML and are displayed in this HTML version using MathJax in order to improve their display. Uncheck the box to turn MathJax off. This feature requires Javascript. Click on a formula to zoom.
Abstract
Background
Motor performances of youth are related to growth and maturity status, among other factors.
Aim
To estimate the contribution of skeletal maturity status per se to the motor performances of female athletes aged 10–15 years and the mediation effects of growth status on the relationships.
Subjects and methods
Skeletal age (TW3 RUS SA), body size, proportions, estimated fat-free mass (FFM), motor performances, training history and participation motivation were assessed in 80 non-skeletally mature female participants in several sports. Hierarchical and regression-based statistical mediation analyses were used.
Results
SA per se explained a maximum of 1.8% and 5.8% of the variance in motor performances of athletes aged 10–12 and 13–15 years, respectively, over and above that explained by covariates. Body size, proportions, and hours per week of training and participation motivation explained, respectively, a maximum of 40.7%, 18.8%, and 22.6% of the variance in performances. Mediation analysis indicated specific indirect effects of SA through stature and body mass, alone or in conjunction with FFM on performances.
Conclusion
SA per se accounted for small and non-significant amounts of variance in several motor performances of female youth athletes; rather, SA influenced performances indirectly through effects on stature, body mass and estimated FFM.
Introduction
Interest in relationships between skeletal maturity status expressed as skeletal age (SA) and the strength and motor performances of children and adolescents has a long tradition in the physical activity and sport sciences (Malina et al. Citation2004). The focus is on skeletal maturity as it can be evaluated across childhood and adolescence, whereas indicators of pubertal status are limited to the adolescent years. Given the increasing number of females training and competing in sports at relatively young ages, and the earlier maturation of females compared to males, relationships between maturity status and performances of female youth participants in different sports merit attention (Malina et al. Citation2015, Citation2021).
Early studies of primary school boys and girls noted low to moderate correlations between SA and several motor tasks (Seils Citation1951; Rarick and Oyster Citation1964), while multiple regression analyses indicated negligible relationships between SA and performances on several fitness tests (Rajic et al. Citation1979) and a serial tapping task (Kerr Citation1975). Among adolescents, correlations between skeletal maturity status and motor performances were low among girls (Espenschade Citation1940) and moderate among boys (Jones Citation1949); partial correlations, statistically controlling for chronological age (CA), were reduced more among girls than boys.
The preceding studies were largely based on correlation and largely focused on CA, SA, height, and weight as independent variables. Subsequent studies focused on interactions among SA, CA, stature, and weight to address the unique contribution of skeletal maturity status to performances. Among boys and girls aged 7–12 years, for example, the effects of SA on several motor performances were expressed mainly through body size, and SA per se influenced motor tasks more than static muscular strength (Katzmarzyk et al. Citation1997). Among adolescent boys aged 12–19 years, SA and CA alone, or in combination with stature and body mass, explained 0–17% of the variation in several motor tasks (Beunen et al. Citation1981), while among girls aged 6–16 years, CA, SA, stature, body mass and their first-, second- and third-order interactions explained <10% of the variation in performances on a variety of motor tests (Beunen et al. Citation1997). The study of Katzmarzyk et al. (Citation1997) used standardised residuals of SA on CA (SAsr) to represent the effects of SA independent of CA, while Beunen et al. (Citation1981, Citation1997) entered SA and CA separately or the SA × CA interaction as independent variables. Both studies used stepwise regression in which the order of entry of the independent variables was based solely on statistical criteria; the meaning or interpretation of the variables was not relevant (Tabachnick and Fidell Citation2013).
More recently and based on hierarchical regression, SA alone or interacting with body size had a relatively small influence on fundamental movement skills and motor coordination among children aged 3–6 and 7–10 years (Freitas et al. Citation2015, Citation2018), while SA explained a maximum of 8.1% and 2.8% of the variance in performances on four motor coordination tasks in, respectively, boys and girls aged 11–14 years after controlling for stature, body mass and interactions with stature and body mass (Freitas et al. Citation2016). Although these studies had the advantage of entering the independent variables in an order specified by the researcher and each set of variables was assessed in terms of what they added to the equation at its own point of entry (Tabachnick and Fidell Citation2013), they included only biological characteristics as independent variables in the hierarchical regression models.
Corresponding studies of the contribution of maturity status to motor performances of youth athletes, primarily males, vary in design, methods of analysis and results. Among basketball players aged 14–16 years, for example, SA, weight and estimated leg length were significant predictors of maximal sprint speed and short-term power output (Carvalho et al. Citation2013). Stage of pubic hair was a significant predictor of jumping and strength among basketball players aged 12–13 years, and of only jumping performance among players aged 14–15 years (Coelho-e-Silva et al. Citation2008, Citation2010). SA was a significant predictor of functional capacities and soccer-specific skills among soccer players aged 11–12 and 13–14 years (Figueiredo et al. Citation2011), while stage of pubic hair and height were significant predictors of functional capacities and soccer-specific skills among players 13–15 years of age (Malina et al. Citation2004, Citation2007). In addition, a series of cross-sectional and longitudinal analyses using allometry and multilevel modelling of relationships among SA, body size, estimated body composition and training with a variety of performance tasks (sprinting, agility, etc.) in adolescent soccer players noted variable relationships between maturity status, body size and several specific performances (Valente-dos-Santos, Coelho-e-Silva, Duarte, et al. Citation2014; Coelho-e-Silva, Vaz, et al. Citation2014, Valente-dos-Santos; Valente-dos-Santos, Coelho-e-Silva, Severino, et al. Citation2012; Valente-dos-Santos, Coelho-e-Silva, Simões, et al. Citation2012).
Similar studies of female athletes are limited. Maturity status based on age at menarche was a significant predictor of the counter movement jump among basketball players aged 11–15 years but was not among predictors of short-term maximal running speed and the yo-yo intermittent endurance run (Leonardi et al. Citation2018). Among elite female and male tennis players aged 9–16 years, partial correlations (controlling for CA) between the SA/CA ratio and several performance tests were significant but moderate only for tests of agility and overhead power among female players and tests of forehand, backhand, and overhead power among male players (Myburgh et al. Citation2016). Players advanced in skeletal maturity status performed better than their less mature peers.
In contrast to the preceding studies which used SA, pubertal status and age at menarche as the indicators of maturity status, many recent studies of youth athletes increasingly rely on two predicted estimates of maturity status – percentage of predicted adult height attained at the time of observation (Roche et al. Citation1983), and of maturity timing – predicted maturity offset defined as time before or after peak height velocity (Mirwald et al. Citation2002; Moore et al. Citation2015). Several studies applying predicted estimates of maturity status among athletes and the limitations of the predicted indicators are considered in the Discussion. Of relevance, several of the studies used bands to classify athletes as early, on-time and late maturing. This practice is increasingly discouraged in sports and in other fields, as categorical variables do not provide the same amount of statistical information as continuous variables (Harrell Citation2015; Lolli et al. Citation2022; Ruf et al. Citation2023).
Studies of female athletes that consider the variance associated with SA per se from that attributed to growth status and behavioural variables upon motor performance are apparently not available. Moreover, research has not considered the indirect effects of SA on motor performance through body size and composition. In the context of the preceding, this study initially explores the contribution of SA per se to performances on tests of balance, flexibility, strength, speed, and muscular and cardiovascular endurance of youth female athletes beyond that afforded by differences in body size, proportions, training history and participation motivation. It then considers the mediation effects of stature, body mass and estimated FFM on relationships between SA and the respective performances. It was hypothesised that (i) skeletal maturity status per se has a negligible influence on motor performance over and above that explained by covariates, and (ii) that the influence of SA on motor performance is mediated through its effect on stature and body mass, alone or in conjunction with FFM.
By exploring variance on motor performance through biological and behavioural variables, the present study attempts to obtain a clearer picture of the above relationships. The results should be of practical interest to (i) coaches in improving sport experiences of youth, (ii) athletes in understanding their own performances, and (iii) parents in supporting their children in sport activities.
Subjects and methods
The athletes were part of the “Madeira Youth Athlete Study,” a cross-sectional study of 533 Portuguese athletes 6–20 years of age; 285 males and 248 females. The athletes were recruited from seven sport associations and 27 affiliated clubs, and trained for and participated in regional, national, and international competitions. Of 114 athletes 10–15 years of age within this CA range, 80 met two inclusion criteria: (i) formal training in a sport for at least 3 consecutive years and (ii) not skeletally mature at the time of observation (see below). Participants in seven sports are represented in the sample: rhythmic gymnastics (n = 25), swimming (n = 18), athletics (n = 14), speed skating (n = 12), tennis (n = 4), table tennis (n = 4) and karate (n = 3). At the time of the study, there were no programs for artistic gymnastics, and the number of girls <10 years of age systematically participating in sport was small.
The final sample of 80 non-skeletally mature athletes was divided into two CA groups approximating, respectively, early and late adolescence: 10–12 years (10.00–12.99 years, n = 42) and 13–15 years (13.00–15.99 years, n = 38). The remaining 34 athletes (29.8%; 13–15 years; CA 14.3 ± 0.6 years) were skeletally mature, i.e. had a TW3 RUS maturity score of 1000 points, and were not included in the analysis as an SA is not assigned. Nevertheless, descriptive statistics for the subsample of skeletally mature athletes were reported. The aim was to highlight a potential limitation of the TW3 RUS method, especially among those approaching skeletal maturity but who were not yet mature (considered in more detail in the Discussion).
The study was approved by the Scientific Board of the University of Madeira and by the Regional Directorate of Sports for the Autonomous Region of Madeira, Portugal. Written informed consent was received from all parents or legal guardians and verbal assent was provided by each athlete. Participation in the study was voluntary.
All participants were measured and tested at the university laboratory during a single visit between December 2013 and January 2015. Chronological age (CA, decimal years) was calculated as date of observation minus date of birth. Radiographs of the left hand-wrist were taken at a local hospital. Skeletal maturity was assessed with the TW3 radius, ulna, short bone method (TW3 RUS) which requires the assessment of 13 bones relative to specific criteria. The stage of each bone was assigned, and its associated numerical score was recorded; the scores of the 13 bones were summed into a “maturity score” which was converted to a TW3 RUS SA using the sex-specific table of maturity scores and equivalent SAs in units of 0.1 year (Tanner et al. Citation2001). Linear interpolations were done as necessary. All radiographs were evaluated by an experienced assessor for whom intra- and inter-observer reliabilities were high (Freitas et al. Citation2016).
Based on the difference of SA minus CA, the skeletal maturity status of each athlete was classified as late (delayed), SA younger than CA by >1.0 year; on time (average), SA within ±1.0 year of CA; or early (advanced), SA older than CA by >1.0 year.
Stature, body mass, sitting height, skeletal diameters and skinfolds were measured following a standardised protocol (Claessens et al. Citation1990). The athletes were measured while wearing a two-piece bathing suit, with shoes and other accessories removed. All measurements were taken by three experienced individuals, who were assisted by undergraduate and postgraduate students. Stature was measured to the nearest mm using a Harpenden wall mounted stadiometer (Holtain Ltd, Crosswell, UK), while body mass was measured on a balance-beam scale accurate to 0.5 kg (Seca Optima 760, Hamburg, Germany). Sitting height was measured to the nearest mm with the Harpenden sitting height table (Holtain Ltd, Crosswell, UK); bicristal and biacromial diameters were measured to the nearest mm using a spreading calliper with rounded ends (DKSH Management Ltd, Zurich, Switzerland); and the triceps and subscapular skinfolds were measured on the left side of the body to the nearest 0.2 mm with a skinfold calliper (DKSH Management Ltd, Zurich, Switzerland). The ratios of sitting height/stature and bicristal diameter/biacromial diameter are indicators of, respectively, relative leg length and shoulder-hip proportions. Fat as a percentage of body mass (% Fat) was predicted from the triceps and subscapular skinfolds using the recommended equations of Slaughter et al. (Citation1988) for girls 8–18 years:
In a pilot study, 11 female and 9 male athletes aged 10–17 years were measured on two occasions separated by 8 days. Technical errors of measurement (TEM) were 0.31 cm for stature, 0.56 kg for body mass, 0.51 cm for sitting height, 0.31 cm for bicristal diameter, 0.44 cm for biacromial diameter, 0.95 mm for the triceps skinfold and 1.15 mm for the subscapular skinfold. The relative TEMs were 10.2% or lower for skinfolds and 2% or lower for body size and skeletal diameters, consistent with proposed guidelines (Norton and Olds Citation1996). Intra-class correlations assessed via two-way ANOVA were within 0.96 and 1.00.
Eleven tests of motor performance were administered. Eight tests were from the EUROFIT battery (Council of Europe Citation1993): balance – flamingo stand, balancing on one leg on a beam of fixed dimensions; speed – plate tapping, rapid tapping of 2 plates alternately with the preferred hand; speed and agility – 10 × 5 m shuttle run, running and turning at maximum speed; flexibility – sit and reach, reaching forward as far as possible from a seated position; strength – standing long jump (explosive power), jumping for distance from a standing position, and hand grip (static strength), arm and hand force with a dynamometer; muscular endurance – sit-ups (trunk strength and endurance), maximum number of sit-ups in 30 s, and flexed arm hang (functional strength), maintaining the bent arm position while hanging from a bar. All tests were administered following the instructions of the Committee of Experts (Council of Europe Citation1993). Three other tests were also administered: 50-metre dash (running speed) and 12-min endurance run (cardiovascular endurance) (AAHPERD Citation1976), and the counter movement jump (explosive power) (Bosco et al. Citation1983). Stopwatches (Seiko Digital S140, Japan), tape measures and grip dynamometers (Takei, Japan) were used for specific tests, while the counter movement jump was assessed with an ergo jump (Globus Ergo Tester, Italy). Intra-class correlations in the pilot study indicated good reliability and ranged from 0.76 (shuttle run) to 0.99 (grip strength).
During the visit to the laboratory, menarcheal status of each athlete, i.e. whether menarche has occurred (post-menarcheal) or has not occurred (pre-menarcheal), was assessed by interview with a member of the research team. In several cases, the information was provided by mothers who accompanied their daughters.
The athletes, assisted by their coaches, also completed a brief questionnaire on training history (“years of training” and “training hours a week”). Reported “years of training” were cross-checked with the respective local sport Associations or Federations. A “Participation Motivation Questionnaire” (PMQ) (Gill et al. Citation1983) for Portuguese youth (Serpa Citation1992) was administered by interview. Although the Portuguese version of the PMQ included a list of 30 possible reasons for participating in sports that addressed seven factors: “achievement/status,” “fun,” “group activity,” “contextual,” “physical fitness,” “improvement,” and “influence of family and friends,” only “group activity” was used in the present analysis. It was the only factor that was associated with strength and motor performance of the athletes and entered the hierarchical regression analyses. “Group activity” included 5 items: “I like the teamwork,” “I want to learn new skills,” “I like the action,” “I like the team spirit,” and “I like being on a team.” All items were coded on a 5-point scale, ranging from 1 (not at all important) to 5 (very important); scores were averaged. Cronbach’s alpha for “group activity” was 0.68 in the validation study (Serpa Citation1992).
The data were initially scanned for potential entry errors, followed by comparison and correction. The data were also checked for outliers and normality was assessed via the Kolmogorov–Smirnov test, histograms, and Q-Q plots. Body mass, flamingo balance, sit-ups, bent arm hang, counter movement jump, years of training and training hours a week were skewed; the variables were adjusted with square-root, cubic or 1/square-root, or base 10 log transformations before the regression and mediation analyses. Means and standard deviations were calculated for all variables in the two age-groups, and for all variables except SA in the sample of skeletally mature athletes. Independent-samples t-tests were used to compare the means of non-skeletally mature athletes in the two age-groups (10–12 years and 13–15 years), and the means of non-skeletally mature (13–15 years) and skeletally mature athletes. The magnitude of the differences between groups was calculated with Cohen’s d. To interpret the effect size, the guidelines proposed by Cohen (Citation1988) were followed, i.e. 0.20 (small), 0.50 (medium), and 0.80 (large).
Information on menarcheal status was available for all except one athlete. Menarcheal status is a categorical variable and is thus of limited utility as many girls in the sample were pre-menarcheal. Probit analysis was used to estimate ages at menarche (median, 95% CI) for the total sample and for the sample of non-skeletally mature athletes.
SA is a continuous variable that is commonly expressed relative to CA at the time of observation and was used as the maturity indicator in the subsequent analysis. SA was regressed on CA, and the standardised residual of SA on CA (SAsr) was used as the indicator of maturity status in the subsequent analyses. A four-step hierarchical multiple regression analysis was used to estimate the contribution of SA alone (i.e. SAsr) to the unique variance in motor performance, over and above that explained by several covariates. The covariates or independent variables included in the analysis were based on the literature and a preliminary correlational analysis. In the first step (model 1), stature and body mass were entered; in model 2, the sitting height/stature and bicristal/biacromial ratios were added; and in model 3, training hours per week and participation motivation were added. In the fourth and final step (model 4), SAsr was added, thus controlling for body size, proportions, training hours a week and participation motivation. Overall, 4 (steps) × 2 (age-groups) × 11 (motor tests) resulted in 88 regression models that were tested. The change in R2 (ΔR2) across steps and their statistical significance were calculated to estimate the relative contribution of each set of variables. To minimise adverse effects of interrelationships among variables and to prevent large standard errors, all independent variables were standardised. There were no indications of multicollinearity; variance inflation factor (VIF) values ranged between 1.05 and 4.28 and tolerance values between 0.23 and 0.95. VIF values of 10 or higher and tolerance values of 0.10 or less are indicative of multicollinearity (Cohen et al. Citation2003).
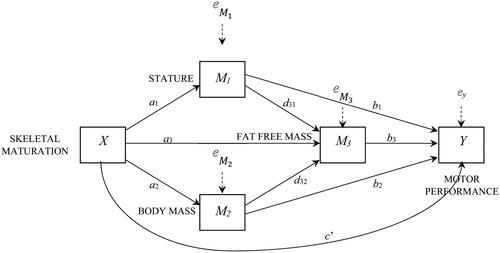
The analysis also considered whether relationships between SAsr and motor performances were mediated by stature, body mass and estimated FMM, which varies with body size, using PROCESS macro for SPSS, model 80 (Hayes Citation2018). The model was selected as the partial correlations between stature and body mass (r = 0.597), stature and FFM (r = 0.762) and body mass and FFM (r = 0.882), controlling for SAsr, were moderate to high. The literature also suggests that a blend of parallel and serial mediation processes should be used (Hayes Citation2018). With the three mediators in the model, there were thus six pathways by which SAsr (X) can influence motor performance (Y): (i) a specific indirect path that runs from SAsr to motor performance through stature (M1) only (a1b1), (ii) a specific indirect path that runs through body mass (M2) only (a2b2), (iii) a specific indirect path that runs from SAsr to motor performance through FFM (M3) only (a3b3), (iv) a specific indirect path that passes through both stature (M1) and FFM (M3) in serial, with stature affecting FFM (a1d31b3), (v) a specific indirect path that passes through both body mass (M2) and FFM (M3) in serial, with body mass affecting FFM (a2d32b3), and (vi) a direct effect of SAsr on motor performance without passing through either stature, body mass or FFM (c’) (see ). Years of training and training hours per week were entered as covariates and the k PROCESS commands were run substituting one motor test (Y) for another at each run, as recommended by Hayes (Citation2018). Thus, the model was tested 11 times, once for each motor test. To generate 95% confidence intervals (CI) for indirect effects, the number of bootstrap samples was set at 5000. Statistical significance was observed as a 95% CI that did not include zero. Pairwise comparisons were used to test whether one indirect effect was statistically different from another. If the point estimates for the two specific indirect effects being compared were of the same sign, it was interpreted as a significant contrast, i.e. one effect being larger than the other in an absolute sense (Hayes Citation2018). For the mediation analysis, the non-skeletally mature athletes were combined into a single group (10–15 years). Analyses were conducted using IBM SPSS 26.0 (IBMCorp. Citation2019) and STATA 16 (StataCorp. Citation2019). Statistical significance was set at p < 0.05.
Figure 1. Estimated mediating effect of stature, body mass and estimated fat-free mass on the relationship between the standardised residuals of skeletal age on chronological age and performances of female athletes. Analysis based on model 80 (Hayes Citation2018).
Results
Descriptive statistics for the two CA groups of non-skeletally mature athletes, for the sample of skeletally mature athletes, and for the total sample of non-skeletally mature athletes are summarised in . Based on independent-samples t-tests, the older subsample of non-skeletally mature athletes is, on average, significantly taller (d = 0.613, medium, p = 0.008) and heavier (d = 0.490, small, p = 0.032) with a larger FFM (d = 0.623, medium, p = 0.007) than their younger non-skeletally mature peers. The older athletes also perform, on average, significantly better than their younger peers on flamingo balance (d = 0.631, medium, p = 0.006), plate tapping (d = 0.688, medium, p = 0.003), sit and reach (d = 0.599, medium, p = 0.009), standing long jump (d = 0.875, large, p < 0.001), handgrip (d = 0.850, large, p < 0.001), sit ups (d = 0.529, medium, p = 0.021), bent arm hang (d = 0.602, medium, p = 0.009), 50-metre dash (d = 0.712, medium, p = 0.002), and training volume per week (d = 0.484, small, p = 0.034. In contrast, the two subsamples of female athletes do not differ in years of sport-specific training and motivation for participation in sport.
Table 1. Descriptive statistics (means ± standard deviations) for chronological age, skeletal age, body size, proportions and composition, motor performance, training history and participation motivation for non-skeletally mature athletes in the two age groups, for all variables except skeletal age among the sample of skeletally mature athletes, and for all variables in the total sample of non-skeletally mature athletes.
Although tangential to the primary purpose of the paper, non-skeletally mature and skeletally mature players aged 13–15 years differ only in CA (d = 1.219, large, p < 0.001). Body size, proportions and estimated composition, motor performance, training history and participation motivation do not differ, on average, between the respective groups.
In the total sample of non-skeletally mature athletes aged 10–15 years, 67 (83.7%) are “on time” or average in skeletal maturity status based on the difference of SA minus CA, while 7 (8.7%) are early-maturing and 6 (7.5%) are late-maturing. The median age at menarche for the sample of non-skeletally mature athletes is 12.71 years (95% CI 12.24–13.11 years) and is essentially equivalent with the estimated median for the total sample of skeletally mature and non-skeletally mature athletes, 12.65 years (95% CI 12.17–13.02 years).
Results of the hierarchical multiple regression analyses with the performances of non-skeletally mature female athletes as dependent variables and the four blocks of independent variables are summarised in . Among athletes aged 10–12 years, the first block (stature and body mass) explains 20.5% of the variance in the flamingo balance [F (2, 38) = 4.90, p = 0.01)], 40.7% in handgrip strength [F (2, 38) = 13.05, p < 0.001)], 15.1% in bent arm hang [F (2, 38) = 3.39, p = 0.04)] and 16.6% in the 12-min run [F (2, 38) = 3.79, p = 0.03)]. In the second block, body proportions account for an additional 15.7% of variance in the bent arm hang, after controlling for stature and body mass [F change (2, 36) = 4.09, p = 0.025], while in the third block adding training hours per week and participation motivation, the maximum variance explained is 12.3% for the 12-min run, but the increase in R2 is not significant. In the fourth block, SAsr explains only 0.0% to 1.8% of the incremental variance beyond that due to body size, proportions, training hours a week and participation motivation.
Table 2. Summary of the percentages of variance explained by body size (step 1), proportions (step 2), training hours per week and participation motivation (step 3), and standardised residuals of skeletal age on chronological age (step 4) in each of the motor performances of female athletes 10–12 years and 13–15 years.
Among athletes aged 13–15 years, the variance accounted for by stature and body mass (block 1) is 20.8% for handgrip strength [F (2, 32) = 4.20, p = 0.024], 18.9% for sit ups [F (2, 32) = 3.72, p = 0.035], 23.1% for the bent arm hang [F (2, 32) = 4.82, p = 0.015], 24.6% for the shuttle run [F (2, 32) = 5.21, p = 0.011], 33.8% for the 12-min run [F (2, 32) = 8.18, p = 0.001] and 22.0% for the 50-metre dash [F (2, 32) = 4.51, p = 0.019]. Thus, stature and body mass explain a significant proportion of variance in these motor performances. An additional 17.2% of variance in the bent arm hang [F change (2, 30) = 4.32, p = 0.022] and 18.8% of variance in the 50-metre dash [F change (2, 30) = 4.77, p = 0.016] is explained by the introduction of the second block of independent variables. The additional variance accounted for by training hours a week and participation motivation in the third block is 22.6% for sit ups [F change (2, 28) = 6.31, p = 0.005]. With SAsr by itself in the fourth block, the model explains 0.0% to 5.8% of the variance, and does not add significantly to the variance accounted for by block 3 ().
The regression coefficients and 95% bootstrap confidence intervals for specific indirect and direct effects on the relationship between SAsr and performances on the total sample of non-skeletally mature female athletes 10–15 years of age (n = 76) on each motor item, controlling for years of training and training hours a week are summarised in .
Table 3. Summary of parallel and serial mediation effects of stature, body mass and estimated fat-free mass on the relationship between the respective standardised residuals of skeletal age on chronological age and motor performances in the total sample of female athletes 10–15 years (n = 76), controlling for years of training and training hours per week.
The first specific indirect effect (a1b1) is statistically significant for the sit and reach and the counter movement jump, i.e. advanced skeletal maturation (SAsr) is associated with taller heights (a1 = 0.371, p = 0.001), which in turn negatively influenced the sit and reach (b1 = −5.156, p = 0.002) and the counter movement jump (b1 = −0.303, p = 0.063).
The second specific indirect significant effect (a2b2) is apparent for the standing long jump, bent arm hang, shuttle run, 12-min run, 50-metre dash and counter movement jump. Athletes who are advanced in skeletal maturation (SAsr) are heavier (a2 = 0.674, p < 0.001), which negatively influences performances in the standing long jump (b2 = −14.535, p = 0.020), bent arm hang (b2 = −2.148, p < 0.001), 12-min run (b2 = −312.041, p < 0.001) and counter movement jump (b2 = −0.850, p = 0.003). Similarly, heavier athletes also show higher scores (poorer performances) in the shuttle run (b2 = 1.424, p = 0.005) and 50-metre dash (b2 = 0.891, p = 0.001).
The third specific indirect effect (a3b3), though not statistically different, suggests that estimated FFM by itself does not mediate the relationship between skeletal maturation (SAsr) and performances of the athletes. However, the fourth specific indirect effect (a1d31b3) reflects a specific effect of SAsr on motor performance through stature and estimated FFM, i.e. stature was modelled as affecting FFM, which in turn influences motor performance. This specific indirect effect is significantly different from zero for several of the motor tests. Athletes who are advanced in skeletal maturity status (SAsr) are taller (a1 is positive) and have a larger FFM (d31 = 0.313, p < 0.001), which translates into better performances in the standing long jump (b3 = 20.520, p = 0.005), handgrip strength (b3 = 4.074, p = 0.002), sit ups (b3 = 3742.456, p = 0.036), bent arm hang (b3 = 1.987, p < 0.001), shuttle run (b3 = −1.283, p = 0.029), 12-min run (b3 = 222.875, p = 0.022), 50-metre dash (b3 = −0.968, p = 0.002) and counter movement jump (b3 = 0.958, p = 0.004).
The serial mediation also suggested a fifth specific indirect effect (a2d32b3). Athletes who are advanced in skeletal maturity status (SAsr) are also heavier, which is reflected in a larger FFM (d32 = 0.706, p < 0.001); FFM is, in turn, associated with better performance in the standing long jump, handgrip strength, sit ups, bent arm hang, shuttle run, 12-min run, 50-metre dash and counter movement jump. The a3 and b3 coefficients are equal to the previous specific indirect effects, and the direct effect (c’) is not statistically different from zero for all motor tests.
Pairwise comparisons of specific indirect effects of SAsr, height, body mass and FFM on motor performances are summarised in supplemental online material 1 (Table S1). No specific indirect effect is statistically different from others in the flamingo balance and plate tapping. The difference between the specific indirect effects 3 (a3b3) and 4 (a1d31b3) (contrast 8) is also not significant for all motor tests. On the other hand, many statistically significant differences are apparent in contrasts 1 (a1b1 – a2b2), 5 (a2b2 – a3b3), 6 (a2b2 – a1d31b3), 7 (a2b2 – a2d32b3), 9 (a3b3 – a2d32b3) and 10 (a1d31b3 – a2d32b3).
For the bent arm hang, the point estimate of the difference between the indirect effect of SAsr through stature (a1b1 = −0.119) and the specific indirect effect through body mass (a2b2 = −1.448) is 1.330 (95% confidence interval, 0.807 to 1.969). The specific indirect effects are different from each other and the indirect effect through body mass is larger than the specific indirect effect through stature. A similar trend is evident in the counter movement jump (contrast 1).
Pairwise comparisons between the specific indirect effect through FFM (a3b3) and the specific indirect effect through body mass and FFM (a2d32b3) (contrast 9) are also statistically different. The specific indirect effect through body mass and FFM is stronger than the specific indirect effect through FFM for the standing long jump, handgrip strength, sit ups, bent arm hang, shuttle run (10 × 5 m), 12-min run, 50-metre dash and counter movement jump. Similar results are apparent in comparisons of the specific indirect effect through stature and FFM (a1d31b3) and the specific indirect effect through body mass and FFM (a2d32b3) (contrast 10), with larger effects of the path that runs through body mass and FFM (a2d32b3).
Discussion
The female athletes comprising the sample for the present study included regional, national, and international participants in several individual sports. Mean SAs approximated mean CAs in the two subsamples of non-skeletally mature athletes, thus indicating average maturity status.
Although significantly younger than the subsample of skeletally mature athletes aged 13–15 years, the body size, proportions and estimated composition and the motor performances of the non-skeletally mature and skeletally mature athletes did not differ significantly (). The latter likely reflects reduced variability as the rate of growth declines after PHV in girls, which occurs, on average, ∼12.0 years of age in European girls, and the catch-up of later and average maturing girls. A potentially confounding factor is the final stage (i.e. mature state) of maturation of the distal radius and ulna with the TW3 RUS method which is simply defined as “…fusion of the epiphysis and metaphysis has begun” (Tanner et al. Citation2001). The interval between the onset of fusion and complete union of the respective epiphyses and metaphyses is not considered. On re-examining the radiographs of the 34 girls classified as skeletally mature, fusion began in the radius and ulna in 20 girls, was complete in one of the two bones in 7 girls, and was complete in both the radius and ulna in 7 girls. The latter included 3 rhythmic gymnasts, 3 swimmers, and a karate participant. By inference, some of the girls classified as skeletally mature were still in the process of maturing. This is a limitation of the TW3 RUS method. Note, in the Greulich-Pyle and Fels methods for assessing SA, complete fusion of the distal radius and ulna ephiphyses defines the mature state of each bone (Malina et al. Citation2004).
Estimated median ages at menarche based on probit analysis for the total sample of non-skeletally mature athletes (12.71 years) and for the total sample including the skeletally mature athletes, (12.65 years) did not differ, and were similar to the probit estimate for the general population of girls in the Madeira Growth Study, 12.56 years (Freitas et al. Citation2002). The mean ages were also within the range of probit estimates of ages at menarche among youth athletes in several sports (about 12.6–13.1 years), but earlier than estimates for divers, figure skaters and artistic gymnasts (Malina et al. Citation2004).
Estimated percentages of variance in several motor tasks attributed to skeletal maturity status expressed as the standardised residual of SA on CA (SAsr) were relatively small in both early adolescent (0–1.8%) and mid-adolescent (0–5.8%) athletes (), while relationships between SAsr and motor performances were mediated by stature and body mass, separately or together with estimated FFM. Corresponding analyses of relationships among skeletal maturity status, body size, proportions, and composition, and motor performances of youth females are limited and used different analytical approaches. Among elementary school girls 11–12 years of age, the standardised residuals of SA (TW2 20 bone) on CA (partial R2) based on stepwise regression explained 2–9% of the variance in grip strength, the 35-yard dash and standing long jump (Katzmarzyk et al. Citation1997). The explained variance was higher than that attributed to the standardised residuals of SA on CA among athletes aged 10–12 years in the present study, 0.0–1.8% (). Although the results are not directly comparable as the present study included other variables and used hierarchical multiple regression analysis, the standardised residuals of SA on CA appeared to influence strength and performance tasks in the sample of athletes to a lesser extent than in non-athletes. Interrelationships among CA, SA (TW2 20 bone) and body size with several indicators of fitness were also considered among Belgian girls aged 6–16 years (Beunen et al. Citation1997). SA alone explained only 1.0–4.0% of the variance in the tests of health- and performance-related fitness. The range was slightly larger than noted among athletes aged 10–12 years (0.0–1.8%) but overlapped the range among athletes aged 13–15 years (0.0–5.8%).
Among female athletes 13–15 years of age (, ΔR24 [step 4]), a relatively small increase in the percentage of variance explained by SAsr was noted for plate tapping (5.8%), bent arm hang (2.8%), counter movement jump (2.8%), shuttle run (1.3%) and 50-metre dash (1.3%). Although it may be speculated that the small increments in explained variance may be related to the growth spurt in height, mean ages at PHV in samples of European girls range from 11.4 to 12.6 years with standard deviations of about one year (Malina et al. Citation2004). On the other hand, limited longitudinal data for girls suggest, on average, peak gains in shoulder strength and the standing long jump after PHV, while estimates of peak gains in other motor tasks relative to age at PHV in girls vary considerably among samples and tests (Malina et al. Citation2004). Of potential relevance, maturity scores with the TW3 RUS method increase rapidly after PHV among girls and approach the mature state shortly after 14.0 years although maturity is not attained until 15.0 years (Tanner et al. Citation2001).
In contrast, results of the present analysis indicated that a relatively large percentage of the variance in motor performances was explained by stature and body mass among adolescent athletes (, step 1). Aside from order of entry of the independent variables, positive beta-coefficients for stature suggested better performances among taller athletes, especially for the 12-min run in both age groups, and the standing long jump at 13–15 years, while negative beta-coefficients suggested better performances among taller athletes for the 50-metre dash and 10 × 5 m shuttle run at 13–15 years; note that lower times indicate better performances in the dash and shuttle run. The beta-coefficient for body mass was positive for handgrip strength at 10–12 years, but negative for the 12-min run at 13–15 years. Taller and heavier female athletes were stronger and performed better than shorter and lighter athletes, except for the 12-min run (endurance) in which lighter athletes performed better. The results highlight the need for caution in generalisations about the influence of body size on the motor performances of female youth athletes.
In the second step of the analysis, body proportions added significantly to stature and body mass in explaining the variance in the bent arm hang in both age groups and 50-metre dash at 13–15 years (, step 2). When the contribution of individual predictors was considered in the final models ( step 4), the ratio of bicristal/biacromial breadths was also a significant predictor of the bent arm hang in both age groups and of handgrip strength, sit ups and the 50-metre dash at 13–15 years.
Training hours per week and participation motivation significantly contributed to the regression model for sit ups at 13–15 years (, step 3), but was significant only for participation motivation in step 4. The regression coefficient was negative suggesting an association of poorer performance with a higher score for “group activity.” The association may reflect individual differences in motivation and perhaps more importantly in the interpretation of an “all-out effort” for performances on fitness tests. One may speculate on a need for incentives among athletes to give “all-out efforts” on tests of performance outside the context of specific competitions. The need for incentives was also noted in surveys of the general population of youth (AAHPERD Citation1976; Council of Europe Citation1993).
The mediation analysis clarified several of the associations noted in the preceding discussion. Athletes advanced in skeletal maturity status were taller and heavier than CA group peers. However, increased stature had a negative influence on flexibility and explosive power, while increased body mass was associated in reduced explosive power, functional strength, running speed, and cardio-respiratory endurance. The latter was consistent with the literature which suggests that body mass has a negative effect in performance tasks in which the body is projected as in jumps, moved through space as in sprints, raised as in pull-ups, or supported off the ground as in the flexed arm hang (Malina et al. Citation2004).
With several exceptions, observations of the present study paralleled those of earlier (Beunen et al. Citation1997; Katzmarzyk et al. Citation1997) and more recent (Freitas et al. Citation2015, Citation2016, Citation2018) studies of the general population of girls. The results highlighted the interactions of the standardised residuals of SA with stature and body mass in explaining the variance for several fundamental motor skills, motor coordination and motor performances among children and adolescents of both sexes. The entry of FFM in the serial mediation expanded the specific indirect effects as advanced skeletal maturity status was positively associated with stature, body mass and FFM in contributing to motor proficiency.
As noted in the Introduction, studies of maturity-associated variation in growth status and performances of youth athletes increasingly use predicted estimates of maturity status. Several recent applications with youth female athletes are briefly considered. Female tennis players 10–13 years, for example, were grouped as “latest” and “earliest” maturing based on percentage of predicted adult height attained at the time of observation; as expected, a maturity-related gradient in stature and body mass similar to that in the present study was noted (Söğüt et al. Citation2019). The “earliest” maturing girls were older, taller, heavier, and stronger, but did not differ from the “latest” maturing girls in agility. Age, height, weight, and components of jumping performance of female artistic gymnasts 5–14 years also systematically differed among three maturity groups defined by percentage of predicted adult height at the time of observation as early pre-pubertal, late pre-pubertal and pubertal (Moeskops et al. Citation2020).
Predicted maturity offset, defined as time before or after PHV, was used to classify elite female athletes 8–18 years in several sport disciplines as pre-pubertal (< −1 year before PHV), pubertal (±1 year of PHV) and post-pubertal (>1 year after PHV); of interest, only 4 girls were classified as pre-pubertal, while 54 girls were pubertal and 216 girls were post-pubertal based on predicted maturity offset (Lesinski et al. Citation2020). The latter were significantly older, taller, and heavier than pubertal girls, while differences in performance were inconsistent. In a study of U10 through U16 female soccer players, characteristics of players in six “maturity groups” defined by predicted maturity offset were compared (Emmonds et al. Citation2020). As expected, CA, height, weight, and performances in speed, change of direction, the counter movement jump, and aerobic capacity systematically increased from the least to the most mature groups. In combined samples of under-13 and under-15 tennis players, predicted maturity offset was used to classify girls as around-PHV or post-PHV and boys as pre-PHV or around-PHV. The maturity groups of girls did not differ in tests of jumping, dynamic balance, isometric strength, and hip range of motion, while two groups of boys differed only in jumping task (Lopez-Valenciano et al. Citation2023).
Results of the preceding studies and others using predicted estimates of maturity status are not directly comparable with observations in the present study based on SA. Although the trends were generally consistent in showing a gradient in maturity effects on body size and motor performances, the predicted estimates have major limitations, especially in samples of youth spanning relatively broad CA ranges and among early and late maturing youth (Malina et al. Citation2017, Citation2023).
Based on the commonly used band of ±1.0 year to define maturity status based on SA, 2 (6%), 21 (68%) and 8 (26%) tennis players 9–16 years of age were classified as, respectively, late, average, and early maturing (Myburgh et al. Citation2019). However, when grouped by percentage of predicted adult height at the time of observation or by predicted age at PHV, most of the female players were classified as average in maturity status, respectively, 28 of 31 (90%) and 29 of 31 (94%). Similar trends were also noted among male tennis players of the same age range (Myburgh et al. Citation2019) and among male soccer players in 11–12- and 13–14-year competitive age groups (Malina et al. Citation2012).
Predicted maturity offset and age at PHV have reduced variation compared to observed variation in single year CA groups in both girls and boys. Ages at PHV based on predicted maturity offset (CA minus offset) also increase with CA at prediction and are later than observed age at PHV in early maturing and earlier than observed age at PHV in late maturing youth of both sexes (Malina et al. Citation2016; Kozieł and Malina, Citation2018; Malina et al. Citation2021). Similar results have been noted in female artistic gymnasts (Malina et al. Citation2006).
The present study is not without limitations. The sample was heterogeneous in terms of sports represented and level of participation (regional to international). The majority (69 of 80) was involved in rhythmic gymnastics, swimming, athletics, and speed skating; participants in karate, tennis and table tennis were under-represented. At these early adolescent ages, participants in athletics are primarily runners in sprints and middle distances (Malina Citation2006). The variation in the distribution of athletes by and within sports thus limits the generalisability of the findings. Future research would benefit from larger and more balanced samples of female athletes in specific sports.
The present study was also cross-sectional so that causal inferences between skeletal maturity status expressed as SAsr and motor performance are not warranted. Mediation analysis may also generate biased estimates in cross-sectional data (Maxwell and Cole Citation2007). By inference, longitudinal research is needed. The lack of measures of the fit of the statistical model to the data, e.g. root mean square error of approximation (Hayes Citation2018), is also a limitation. The mediation was done with path analysis using ordinary least squares regression, a user-friendly modelling system, in contrast to structural equation modelling. Nevertheless, results with both approaches are substantially similar (Hayes Citation2018).
In addition, FFM was predicted from two skinfold thicknesses, and “participation motivation” was self-reported. Future studies would benefit from a more direct measure of body composition, such as Dual-Energy X-ray Absorptiometry (DEXA), and a more refined protocol to estimate motivation among the athletes.
On the other hand, the use of SAsr, i.e. the standardised residual of regression of SA on CA, as the indicator of maturity status and the comprehensive motor test battery are major strengths of the study. The present study also included body size and proportions, training history and participation motivation among variables considered in a single hierarchical regression model. The parallel and serial mediation analyses also provided a more accurate assessment of mediation effects (Hayes Citation2018). Results of the present study should not be confused with studies that compare performances of youth athletes classified as late, average, or early maturing on the basis of the difference of SA minus CA in specific competitive CA groups (Malina et al. Citation2015).
Conclusion
Skeletal maturity status expressed as SAsr accounted for relatively small amounts of the explained variance in several motor performances of female participants in several sports 10–15 years of age. Rather, SAsr influenced performance indirectly through its effect on stature, body mass and estimated FFM. The results emphasised the indirect effects of stature and body mass, alone or in conjunction with FFM, on the relationship between skeletal maturity status and motor performances of the youth athletes. Overall, the study highlights the complexity of estimating the influence of skeletal maturity status per se on the motor performance of youth female athletes and emphasises the role of interactions between maturity status and body size and composition in motor performance. The relatively small and statistically non-significant influence of skeletal maturity status per se on the motor performances of female athletes implies a role for other factors. Results of the present study highlight the role of body size, proportions, training hours per week and motivation. In concert with genotypic effects, specific instruction and practice, skills learned through free play and physical education classes, and other psychosocial factors also contribute to variation in the motor performances of youth athletes. The preceding considerations are of importance for coaches, teachers and sport professionals working with youth athletes specifically in the context of training and specialisation of youth athletes, and also in the decision-making process, i.e. retention and selection.
Supplemental Material
Download PDF (138.6 KB)Acknowledgments
This work was supported by the “Governo Regional da Madeira,” through the “Secretaria Regional de Educação, Ciência e Tecnologia” and the “Direção Regional de Desporto,” Portugal. The authors thank the athletes, parents, coaches, clubs, and sport associations for their participation in the “Madeira Youth Athlete Study.” We are grateful to the undergraduate and postgraduate students of Physical Education and Sports for assisting with data collection. We also thank Dr. António Rodrigues and Dr. Celso Silva for their assistance with the radiographs and medical supervision of the fieldwork. Special thanks to the late Professor Doctor Emeritus Gaston Beunen, Department of Movement Sciences, Faculty of Movement and Rehabilitation Sciences, KU Leuven, Belgium, who played a key role in designing this study.
Disclosure statement
No potential conflict of interest was reported by the author(s).
Data availability statement
The data that support the findings of this study are available from the “Madeira Youth Athlete Study,” but restrictions apply to the availability of these data, which were used under licence for the current study, and thus are not publicly available. Data are, however, available from the authors upon reasonable request and with permission of Duarte Freitas ([email protected]), the PI of the “Madeira Youth Athlete Study.” Complete tables are also available on request from the corresponding author.
Additional information
Funding
References
- AAHPERD. 1976. AAHPERD youth fitness test manual. Revised 1976 ed. Baltimore (MD): American Alliance for Health, Physical Education, and Recreation.
- Beunen G, Ostyn M, Simons J, Renson R, Van Gerven D. 1981. Chronological and biological age as related to physical fitness in boys 12 to 19 years. Ann Hum Biol. 8(4):1–12. doi: 10.1080/03014468100005121.
- Beunen GP, Malina RM, Lefevre J, Claessens AL, Renson R, Kanden Eynde B, Vanreusel B, Simons J. 1997. Skeletal maturation, somatic growth and physical fitness in girls 6-16 years of age. Int J Sports Med. 18(6):413–419. doi: 10.1055/s-2007-972657.
- Bosco C, Luhtanen P, Komi PV. 1983. A simple method for measurement of mechanical power in jumping. Eur J Appl Physiol Occup Physiol. 50(2):273–282. doi: 10.1007/BF00422166.
- Carvalho HM, Coelho-e-Silva MJ, Eisenmann JC, Malina RM. 2013. Aerobic fitness, maturation, and training experience in youth basketball. Int J Sports Physiol Perform. 8(4):428–434. doi: 10.1123/ijspp.8.4.428.
- Claessens A, Vanden Eynde B, Renson R, Van Gerven D. 1990. The description of tests and measurements. In: Simons J, Beunen G, Renson R, Claessens A, Vanreusel B, Lefevre J, editors. Growth and fitness of flemish Girls: the Leuven growth study. New York: Human Kinetics.
- Coelho-e-Silva MJ, Carvalho HM, Gonçalves CE, Figueiredo AJ, Elferink-Gemser MT, Philippaerts RM, Malina RM. 2010. Growth, maturation, functional capacities and sport-specific skills in 12-13 year-old basketball players. J Sports Med Phys Fit. 50(2):174–181.
- Coelho-e-Silva MJ, Figueiredo AJ, Carvalho HM, Malina RM. 2008. Functional capacities and sport-specific skills of 14- to 15-year-old male basketball players: size and maturity effects. Eur J Sport Sci. 8(5):277–285. doi: 10.1080/17461390802117177.
- Cohen J. 1988. Statistical power analysis for the behavioral sciences. 2nd ed. Mahwah (NJ): Lawrence Erlbaum Associates.
- Cohen J, Cohen P, West SG, Aiken LS. 2003. Applied multiple regression/correlation analysis for the behavioral sciences. 3rd ed. Mahwah (NJ): Lawrence Erlbaum Associates Publishers.
- Council of Europe. 1993. EUROFIT: handbook for the EUROFIT tests of physical fitness. 2nd ed. Strasbourg: Sports Division Strasbourg, Council of Europe Publishing and Documentation Service.
- Emmonds S, Scantlebury S, Murray E, Turner L, Robsinon C, Jones B. 2020. Physical characteristics of elite youth female soccer players characterized by maturity status. J Strength Cond Res. 34(8):2321–2328. doi: 10.1519/JSC.0000000000002795.
- Espenschade A. 1940. Motor performance in adolescence including the study of relationships with measures of physical growth and maturity. Monogr Soc Res Child Dev. 5(1):i. doi: 10.2307/1165475.
- Figueiredo AJ, Coelho e Silva MJ, Malina RM. 2011. Predictors of functional capacity and skill in youth soccer players. Scand J Med Sci Sports. 21(3):446–454. doi: 10.1111/j.1600-0838.2009.01056.x.
- Freitas DL, Lausen B, Maia JA, Lefevre J, Gouveia ER, Thomis M, Antunes AM, Claessens AL, Beunen G, Malina RM. 2015. Skeletal maturation, fundamental motor skills and motor coordination in children 7-10 years. J Sports Sci. 33(9):924–934. doi: 10.1080/02640414.2014.977935.
- Freitas DL, Lausen B, Maia JA, Gouveia ER, Antunes AM, Thomis M, Lefevre J, Malina RM. 2018. Skeletal maturation, fundamental motor skills, and motor performance in preschool children. Scand J Med Sci Sports. 28(11):2358–2368. doi: 10.1111/sms.13233.
- Freitas DL, Lausen B, Maia JA, Gouveia ER, Thomis M, Lefevre J, Silva RD, Malina RM. 2016. Skeletal maturation, body size, and motor coordination in youth 11-14 years. Med Sci Sports Exerc. 48(6):1129–1135. doi: 10.1249/MSS.0000000000000873.
- Freitas DL, Maia JA, Beunen GP, Lefevre JA, Claessens AL, Marques AT, Rodrigues AL, Silva CA, Crespo MT. 2002. Crescimento Somático, Maturação Biológica, Aptidão Física, Atividade Física e Estatuto Socioeconómico de Crianças e Adolescentes Madeirenses. O Estudo de Crescimento da Madeira. Madeira: Universidade da Madeira.
- Gill DL, Gross JB, Huddleston S. 1983. Participation motivation in youth sports. Int J Sport Psychol. 14(1):1–14.
- Harrell FE.Jr. 2015. Regression modeling strategies: with applications to linear models, logistic regression, and survival analysis. Cham: Springer.
- Hayes AF. 2018. Introduction to mediation, moderation and conditional process analysis: a regression-based approach. 2nd ed. New York: Guilford Press.
- IBMCorp. 2019. IBM SPSS Statistics for Windows: released version 26.0. Chicago (IL): IBM Corp.
- Jones HE. 1949. Motor performance and growth. Berkeley (CA): University of California Press.
- Katzmarzyk PT, Malina RM, Beunen GP. 1997. The contribution of biological maturation to the strength and motor fitness of children. Ann Hum Biol. 24(6):493–505. doi: 10.1080/03014469700005262.
- Kerr R. 1975. Movement control and maturation in elementary-grade children. Percept Mot Skills. 41(1):151–154. doi: 10.2466/pms.1975.41.1.151.
- Kozieł SM, Malina RM. 2018. Modified maturity offset prediction equations: validation in independent longitudinal samples of boys and girls. Sports Med. 48(1):221–236. doi: 10.1007/s40279-017-0750-y.
- Leonardi TJ, Paes RR, Breder L, Foster C, Gonçalves CE, Carvalho HM. 2018. Biological maturation, training experience, body size and functional capacity of adolescent female basketball players: a Bayesian analysis. Int J Sports Sci Coach. 13(5):713–722. doi: 10.1177/1747954118772489.
- Lesinski M, Schmelcher A, Herz M, Puta C, Gabriel H, Arampatzis A, Laube G, Büsch D, Granacher U. 2020. Maturation-, age-, and sex-specific anthropometric and physical fitness percentiles of German elite young athletes. PLoS One. 15(8):e0237423. doi: 10.1371/journal.pone.0237423.
- Lolli L, Johnson A, Monaco M, Di Salvo V, Gregson W. 2022. Relative skeletal maturity and performance test outcomes in Elite Youth Middle Eastern Soccer players. Med Sci Sports Exerc. 54 (8):1326–1334. doi: 10.1249/MSS.0000000000002912.
- Lopez-Valenciano A, Ayala F, De Ste Croix MBA, Barbado D, Moreno-Perez V, Sanz-Rivas D, Fernandez-Fernandez J. 2023. The association between chronological age and maturity status on lower body clinical measurements and asymmetries in elite youth tennis players. Sports Health. 15(2):250–259. doi: 10.1177/19417381221083319.
- Malina RM. 2006. Growth and maturation of child and adolescent track and field athletes. Rome, Italy: Centro Studi e Ricerche, Federazione Italiana di Atletica Leggera.
- Malina RM, Rogol AD, Cumming SP, Coelho-e-Silva MJ, Figueiredo AJ. 2015. Biological maturation of youth athletes: assessment and implications. Br J Sports Med. 49(13):852–859. doi: 10.1136/bjsports-2015-094623.
- Malina RM, Bouchard C, Bar-Or O. 2004. Growth, maturation, and physical activity. 2nd ed. New York: Human Kinetics Publishers.
- Malina RM, Chamorro M, Serratosa L, Morate F. 2007. TW3 and Fels skeletal ages in elite youth soccer players. Ann Hum Biol. 34(2):265–272. doi: 10.1080/03014460701207601.
- Malina RM, Choh AC, Czerwinski SA, Chumlea WC. 2016. Validation of maturity offset in the Fels longitudinal study. Pediatr Exerc Sci. 28(3):439–455. doi: 10.1123/pes.2015-0090.
- Malina RM, Claessens AL, Van Aken K, Thomis M, Lefevre J, Philippaerts R, Beunen GP. 2006. Maturity offset in gymnasts: application of a prediction equation. Med Sci Sports Exerc. 38(7):1342–1347. doi: 10.1249/01.mss.0000227321.61964.09.
- Malina RM, Coelho-e-Silva MJ, Figueiredo AJ, Carling C, Beunen GP. 2012. Interrelationships among invasive and non-invasive indicators of biological maturation in adolescent male soccer players. J Sports Sci. 30(15):1705–1717. doi: 10.1080/02640414.2011.639382.
- Malina RM, Cumming S, Coelho-e-Silva MJ. 2023. Bio-banding in youth sport. In Armstrong N, Mechelen WV, editors. Oxford textbook of children’s sport and exercise medicine. 4th ed. Oxford: Oxford University Press; p. 411–421.
- Malina RM, Figueiredo AJ, Coelho-e-Silva MJ. 2017. Body size of male youth soccer players: 1978-2015. Sports Med. 47(10):1983–1992. doi: 10.1007/s40279-017-0743-x.
- Malina RM, Kozieł SM, Králik M, Chrzanowska M, Suder A. 2021b. Prediction of maturity offset and age at peak height velocity in a longitudinal series of boys and girls. Am J Hum Biol. 33(6):e23551. doi: 10.1002/ajhb.23551.
- Malina RM, Martinho DV, Valente-dos-Santos J, Coelho-e-Silva MJ, Kozieł SM. 2021. Growth and maturity status of female soccer players: a narrative review. IJERPH. 18(4):1448. doi: 10.3390/ijerph18041448.
- Maxwell SE, Cole DA. 2007. Bias in cross-sectional analyses of longitudinal mediation. Psychol Methods. 12(1):23–44. doi: 10.1037/1082-989X.12.1.23.
- Mirwald RL, Baxter-Jones AD, Bailey DA, Beunen GP. 2002. An assessment of maturity from anthropometric measurements. Med Sci Sports Exerc. 34(4):689–694. doi: 10.1097/00005768-200204000-00020.
- Moeskops S, Oliver JL, Read PJ, Cronin JB, Myer GD, Haff GG, Moore IS, Lloyd RS. 2020. The influence of biological maturity on dynamic force–time variables and vaulting performance in young female gymnasts. J Sci Sport Exercise. 2(4):319–329. doi: 10.1007/s42978-020-00068-z.
- Moore SA, McKay HA, Macdonald H, Nettlefold L, Baxter-Jones AD, Cameron N, Brasher PM. 2015. Enhancing a somatic maturity prediction model. Med Sci Sports Exerc. 47(8):1755–1764. doi: 10.1249/MSS.0000000000000588.
- Myburgh GK, Cumming SP, Malina RM. 2019. Cross-sectional analysis investigating the concordance of maturity status classifications in elite caucasian youth tennis players. Sports Med - Open. 5(1):27. doi: 10.1186/s40798-019-0198-8.
- Myburgh GK, Cumming SP, Coelho-e-Silva MC, Cooke K, Malina RM. 2016. Maturity-associated variation in functional characteristics of elite youth tennis players. Pediatr Exerc Sci. 28(4):542–552. doi: 10.1123/pes.2016-0035.
- Norton K, Olds T. 1996. Anthropometrica: a textbook of body measurement for sports and health courses. Randwick: UNSW Press.
- Rajic MK, Brisson GR, Shephard RJ, Lavallée H, Jéquier JC, Massé R, Jéquier S, Lussier T, Labarre R. 1979. Maturité osseuse et performance physique. Can J Appl Sport Sci. 4(3):223–225.
- Rarick GL, Oyster N. 1964. Physical maturity, muscular strength, and motor performance of young school-age boys. Res Q. 35(4):523–531. doi: 10.1080/10671188.1964.10613349.
- Roche A, Tyleshevski F, Rogers E. 1983. Non-invasive measurements of physical maturity in children. Res Q Exerc Sport. 54(4):364–371. doi: 10.1080/02701367.1983.10605321.
- Ruf L, Altmann S, Kloss C, Härtel S. 2023. Soccer coaches vs. sport science and medicine staff: who can more accurately predict the skeletal age of high-level youth soccer players? Sci Med Footb. 7 (3):253–262. doi: 10.1080/24733938.2022.2100461.
- Seils LG. 1951. The relationship between measures of physical growth and gross motor performance of primary-grade school children. Res Q Am Assoc Health Phys Educ. 22(2):244–260. doi: 10.1080/10671188.1951.10761945.
- Serpa S. 1992. Motivação para a prática desportiva: validação preliminar do questionário de motivação para as actividades desportivas (QMAD). In Sobral F, Marques A, editors. FACDEX: desenvolvimento somato-motor e factores de excelência desportiva na população escolar portuguesa. Vol. 2. Lisboa: Ministério de Educação; p. 89–97.
- Slaughter MH, Lohman TG, Boileau RA, Horswill CA, Stillman RJ, Van Loan MD, Bemben DA. 1988. Skinfold equations for estimation of body fatness in children and youth. Hum Biol. 60(5):709–723.
- Söğüt M, Luz LGO, Kaya ÖB, Altunsoy K, Doğan AA, Kirazci S, Clemente FM, Nikolaidis PT, Rosemann T, Knechtle B. 2019. Age- and maturity-related variations in morphology, body composition, and motor fitness among young female tennis players. Int J Environ Res Public Health. 16(13):2412. doi: 10.3390/ijerph16132412.
- StataCorp. 2019. Stata statistical software: released 16. College Station (TX): StataCorp LLC.
- Tabachnick BG, Fidell LS. 2013. A practical approach to using multivariate analyses. 6h ed. London: Pearson.
- Tanner JM, Healy MJ, Goldstein H, Cameron N. 2001. Assessment of skeletal maturity and prediction of adult height (TW3 method). 3rd ed. Amsterdam: Elsevier Health Sciences.
- Valente-dos-Santos J, Coelho-e-Silva MJ, Duarte J, Pereira J, Rebelo-Gonçalves R, Figueiredo A, Mazzuco MA, Sherar LB, Elferink-Gemser MT, Malina RM. 2014. Allometric multilevel modelling of agility and dribbling speed by skeletal age and playing position in youth soccer players. Int J Sports Med. 35(9):762–771. doi: 10.1055/s-0033-1358469.
- Valente-dos-Santos J, Coelho-e-Silva MJ, Severino V, Duarte J, Martins RS, Figueiredo AJ, Seabra AY, Philippaerts RM, Cumming SP, Elferink-Gemser M, et al. 2012. Longitudinal study of repeated sprint performance in youth soccer players of contrasting skeletal maturity status. J Sports Sci Med. 11(3):371–379.
- Valente-dos-Santos J, Coelho-e-Silva MJ, Simões F, Figueiredo AJ, Leite N, Elferink-Gemser MT, Malina RM, Sherar L. 2012. Modeling developmental changes in functional capacities and soccer-specific skills in male players aged 11-17 years. Pediatr Exerc Sci. 24(4):603–621. doi: 10.1123/pes.24.4.603.
- Valente-dos-Santos J, Coelho-e-Silva MJ, Vaz V, Figueiredo AJ, Capranica L, Sherar LB, Elferink-Gemser MT, Malina RM. 2014. Maturity-associated variation in change of direction and dribbling speed in early pubertal years and 5-year developmental changes in young soccer players. J Sports Med Phys Fitness. 54(3):307–316.