
Abstract
Background
Cuproptosis, a type of cell death involving copper ion accumulation and oxidative stress, has been implicated in the development of Alzheimer’s disease (AD).
Aim
This study aimed to explore the potential mechanisms and roles of cuproptosis-related genes (CRGs), long non-coding RNAs (lncRNAs), and immune cells in the development of cuproptosis in AD.
Subjects and methods
Gene expression profiles of AD were acquired from the Gene Expression Omnibus (GEO) database, and differential analysis was conducted to identify CRGs. Random Forest (RF) modelling was employed to select the most crucial CRGs, which were subsequently validated in the test set. A nomogram model was created to predict AD risk and categorise AD subtypes based on the identified CRGs. A lncRNA-related ceRNA network was built, and immune cell infiltration analysis was conducted.
Results
Twelve differentially expressed CRGs were identified in the AD dataset. The RF model pinpointed the five most critical CRGs, which were validated in the test set with an AUC of 0.90. A lncRNA-related ceRNA network was developed, and immune cell infiltration analysis revealed high levels of M1 macrophages and mast cells, along with low levels of memory B cells in AD samples. Correlation analysis unveiled associations between CRGs, lncRNAs, and differentially infiltrating immune cells.
Conclusion
This research offers insights into the potential mechanisms and roles of CRGs, lncRNAs, and immune cells in the development of cuproptosis in AD. The identified CRGs and lncRNAs may serve as potential therapeutic targets for AD, and the nomogram model may assist in early AD diagnosis and subtyping.
1. Introduction
Alzheimer’s disease (AD) is a prevalent chronic condition among the elderly, characterised by significant cognitive decline (Knopman et al. Citation2021). Currently, over 25 million people worldwide suffer from dementia, with the majority affected by AD. AD has a profound impact on individuals, caregivers, and societies in both developed and developing countries (Qiu et al. Citation2009). Various theories exist regarding AD’s pathogenesis, with one crucial theory suggesting that the formation of extracellular amyloid-β (Aβ) plaques in the cerebral cortex contributes to AD’s development. AD’s pathological features include the accumulation of extracellular Aβ plaques in the cerebral cortex and neurofibrillary tangles containing tau protein, which sequentially occur in related cortical regions such as the entorhinal cortex, hippocampus, amygdala, temporal lobe, and basal forebrain (Torok et al. Citation2018). Other hypotheses for AD include cell cycle dysregulation, oxidative stress, inflammatory mechanisms, and mitochondrial dysfunction. Despite advances in understanding AD’s pathophysiology, no disease-modifying therapy has demonstrated therapeutic potential for AD. Therefore, ongoing discoveries regarding AD’s pathogenesis continue to inform the development of new therapeutic strategies.
Cuproptosis, first described in 2018, is a copper toxicity mechanism distinct from other known cell-mediated deaths. This previously unidentified cell death mechanism, cuproptosis, occurs when copper ionophores induce a unique form of regulated cell death (Tsvetkov et al. Citation2022). Prior research has shown high concentrations of the trace metal copper in Aβ plaques (Miller et al. Citation2006). Another study found that Cu2+ ions enhance fibril formation at various concentrations, with copper ion binding to Aβ significantly increasing its cytotoxicity (Dai et al. Citation2006). Specifically, Cu2+ ions bind to the Aβ peptide with high affinity, promoting β folding and α-helix structures in the amyloid peptide, which ultimately results in Aβ peptide aggregation (Atwood et al. Citation2000; Sarell et al. Citation2010). These findings imply a connection between cuproptosis and AD’s pathogenesis. The presence of numerous AD pathological features overlapping with cuproptosis elements highlights cuproptosis’s possible role in AD’s development. However, no studies have yet reported on cuproptosis’s pathological role in AD.
Non-coding RNAs (ncRNAs) do not encode proteins. Technological advancements have led to increased attention towards ncRNAs, particularly long ncRNAs (lncRNAs), over the past two decades (Hudson et al. Citation2019). Growing evidence suggests that ncRNAs play a crucial role in AD’s pathophysiology, as they can be found in the plasma, central nervous system, and cerebrospinal fluid of AD patients (Idda et al. Citation2018; Wang et al. Citation2019). These highly conserved ncRNAs are now understood to be key regulators of gene expression, Aβ plaque formation, tau hyperphosphorylation, neuronal survival, synaptic plasticity, and neuroinflammation, all considered AD features (Wang et al. Citation2019). Notably, several lncRNAs compete and isolate shared microRNAs (miRNAs) by competing for endogenous RNAs (ceRNAs) to participate in the post-transcriptional cross-regulation of mRNA stability (Marchese et al. Citation2017). Cuproptosis, the recently discovered cell death mechanism, is currently under-researched in the context of lncRNAs. Moreover, the potential co-regulatory role of cuproptosis and lncRNAs in AD warrants further exploration. Thus, investigating the involvement of lncRNAs in cuproptosis’s physiopathology in AD is crucial. Examining the regulatory network of AD in cuproptosis is essential for understanding AD’s pathogenesis and promoting advanced targeted therapy strategies.
Moreover, neuroinflammation is believed to contribute to AD’s pathogenesis. One study suggested that Aβ plaque formation might be related to microglia-induced neuroinflammation (Yin et al. Citation2017). Increasing evidence points to microglia accumulating around senile plaques in AD (Kitazawa et al. Citation2004; Mammana et al. Citation2018). Additionally, previous research showed a connection between extracellular Aβ plaque formation and copper ions in the cerebral cortex of AD. Therefore, we hypothesised that cuproptosis might be associated with Aβ plaque formation and inflammation in AD’s pathogenesis. Consequently, this study, for the first time, analysed the roles of cuproptosis-related genes (CRGs), lncRNAs, and immune cells in cuproptosis’s pathogenesis in AD using bioinformatics. This research may provide direction for subsequent investigations into cuproptosis and neuroinflammation leading to Aβ plaque formation.
2. Methods & materials
2.1. Microarray data downloading and processing
We obtained the GSE5281 and GSE29378 data set from the GEO (Gene Expression Omnibus) database (http://www.ncbi.nlm.nih.gov/geo) (Liu et al. Citation2017). The GSE5281 dataset comprised brain tissue samples from 87 AD patients and 74 healthy controls based on the GPL570 platform (Liang et al. Citation2007). While the GSE29378 dataset included 32 patients with AD and 31 normal brain tissue samples and is based on the GPL6947 platform (Miller et al. Citation2013). Firstly, to explore the effects of these variables on the differential expression results, we corrected for their effects using a linear regression model. In this process, we set brain region, gender, age as independent variables or covariates, and the gene expression level as the dependent variable. The residual derived from the linear regression value represents the expression value that corrects the effect of these variables. To identify the CRGs and lncRNAs in AD, we analysed the GSE5281 samples. Subsequently, we used the GSE29378 dataset as an external validation set to validate CRGs in the constructed model.
2.2. Identification of CRGs
We identified 17 CRGs from a previous study published in Science (Tsvetkov et al. Citation2022). We extracted the expression profiles of these 17 CRGs from the GSE5281 dataset for further analysis. We then used the avereps() function of the "limma" package to reduce data complexity and noise due to the presence of multiple probes for a single gene, thus providing a more reliable and manageable dataset for further downstream analysis such as differential gene expression analysis.
2.3. Identification of DECRGs between AD and control groups
Using the "ggpur" software, we conducted a Wilcoxon rank-sum test on the 17 CRGs between AD and control groups. Genes with a P value < 0.05 between the AD and control groups were defined as differentially expressed cuproptosis-related genes (DECRGs).
2.4. Functional enrichment analysis and gene correlation analysis
We performed a functional enrichment analysis of the DEGs between the AD and control groups to better understand the functions and pathways of the DECRGs. The "clusterProfiler" package(v4.6.2) was used for KEGG pathway enrichment analysis and Gene Ontology Term Enrichment analysis (Yu et al. Citation2012), and the "enrichplot" package for visualisation. The function cor() in R software was used to analyse the correlation among the 12 DECRGs (Yu et al. Citation2012), and "ggplot2" was employed to create a heatmap for the visualisation of the correlation.
2.5. Construction of machine learning models
In this study, a random forest model was trained on gene expression data from 12 genes to predict clinical outcomes for patients with Alzheimer’s disease (Dai et al. Citation2021). Random Forest (RF) is a supervised learning approach and can be considered an extension of decision trees. First, we randomly divided GSE5281 into training and test sets at a 70% and 30% ratio, respectively. Then, we constructed the RF model using the "RandomForest" software package. In our study, Ntrees were set to 500. The model assessed the importance of the 12 DECRGs by Mean Decrease Accuracy. We then evaluated the model’s performance through ROC curves generated by the "PROC" package. We assessed the model’s performance on both training and test sets separately. Finally, we chose the five most critical CRGs in the RF model for further analysis.
2.6. Molecular typing based on the five most important CRGs
We classified AD into subtypes based on the five CRGs. The "ConsensusClusterPlus" software package was used for the consensus clustering of AD samples (Denny et al. Citation2018). In this study, the maximum number of clusters was 6, and 50 repetitive clusters were performed for each cluster number. For each repetitive clustering, 80% of the data points were randomly selected. All features were used for each repetitive cluster. We employed the Partitioning Around Medoids (pam) algorithm, using Euclidean distance (euclidean) as the distance measure. We chose the number of clusters, K, based on the consensus cumulative density function (CDF) curve and the relative change in the area under the CDF curve. However, the practical situation (e.g. the number of samples per cluster) also needed consideration. Additionally, we used the "Pheatmap" software package to construct heatmaps for visualising the expression of the five genes in each subtype. Furthermore, the "ggplot2" package was employed for visualising the expression of the five genes in each subtype (Yu et al. Citation2012). We performed the Kruskal-Wallis test using the "ggpur" package, a nonparametric test for comparing median differences between multiple subtypes.
2.7. Construction of a nomogram model
We used the "RMS" software package to construct a nomogram model based on the five most important CRGs to predict the risk of patients with AD. Calibration curves were employed to evaluate the consistency of our predicted values with reality. Decision curve analysis (DCA) and clinical impact curves were used to assess the benefits obtained by patients from the model-based decision (Iasonos et al. Citation2008).
2.8. Identification of the CRGs co-expressed with differentially expressed lncRNAs (DElncRNAs)
We downloaded the approved symbols of lncRNA genes from the HUGO Gene Nomenclature Committee (HGNC) (https://www.genenames.org/)(Braschi et al. Citation2019). Following previous studies, we compared the lncRNA gene names with the gene symbols in our dataset and selected the overlapping genes (Sabaie et al. Citation2021). The "limma" software package was used to screen the DElncRNAs (Ritchie et al. Citation2015), and the "ggplot2" software package to visualise the DElncRNAs in a volcano plot. The Pearson’s correlation coefficients between the DELncRNAs and DECRGs were calculated using the cor() function in R software. LncRNAs with Pearson’s correlation coefficients |r| > 0.3 with the CRGs were considered correlated and co-expressed with CRGs (Ratner Citation2009). Finally, the "igraph" software package was used to visualise the co-expression between CRGs and DElncRNAs in the circle network diagram.
2.9. Construction of a ceRNA network of cuproptosis-related lncRNAs
We downloaded the AD-related miRNAs from the Human microRNA Disease Database (HMDD) V3.2 database (Karagkouni et al. Citation2020). We used the DIANA-Lncbase V3 to identify experimentally validated interactions between the AD-related miRNAs and DElncRNAs (Karagkouni et al. Citation2020). "Homo sapiens species," "brain or peripheral blood tissues," and "high miRNA confidence levels’’ were the selected DIANA-Lncbase queries. We then predicted the interactions between these miRNAs and target mRNAs using strong experimental evidence from the miRTarBase (Huang et al. Citation2020). We compared the mRNAs with CRGs. The overlapped mRNAs between the filtered targeted mRNAs and cuproptosis-related markers were retained as the core of the ceRNA network. Finally, the ceRNA network was visualised using Cytoscape software (Shannon et al. Citation2003).
2.10. Immune cell infiltration
CIBERSORT (https://cibersortx.stanford.edu/), also known as CIBERSORTx, is a bioinformatics tool used to deconvolute cell type proportions and gene expression profiles from bulk RNA sequencing datasets. We uploaded the expression profiles of the GSE5281 dataset to CIBERSORT to obtain the immune cell infiltration matrix of the 22 types of immune cells (Newman et al. Citation2015). We used the "ggplot2" software package to visualise the immune cell infiltration differences between the AD and control groups and performed a Wilcoxon rank-sum test on the immune cell infiltration differences between the AD and control groups using the "ggpur" software package. Then, we used the cor() function in R software to perform a correlation analysis of the CRGs and lncRNAs with the 22 types of immune cells. Finally, we performed heatmaps to visualise the correlation between the 5 CRGs/11 DElncRNAs and 22 types of immune cells using the "ggplot2" package.
3. Results
3.1. Identification of DECRGs between AD and control groups
The expression levels of 17 cuproptosis-related genes (CRGs) were analysed and visualised in a boxplot with probability density. Using the Wilcoxon rank-sum test, we identified 12 differentially expressed CRGs (DECRGs) with a p-value <0.05 between the Alzheimer’s disease (AD) and control groups (). These DECRGs included ATP7A, ATP7B, DBT, DLAT, DLD, GLS, LIAS, MTF1, NFE2L2, NLRP3, PDHB, and SLC31A1.
Figure 1. (A) The expression of CRGs between the AD and control groups with Wilcoxon rank-sum test.(*indicates p < 0.05, **indicates p < 0.01, ***indicates p < 0.001, and NS indicates no statistical significance) (B) The dot plot visualised the main pathways obtained by KEGG pathway enrichment analysis (P.adj < 0.05). (C) Molecular correlation among the 12 DECRGs. (D) The dot plot visualised the main results (Top 3 categories for that ontology) obtained by Gene Ontology Term Enrichment analysis.
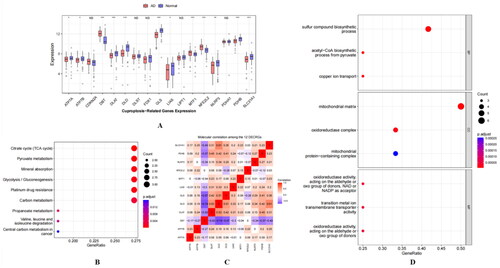
3.2. Functional enrichment analyses and molecular correlation analysis
We input 12 gene symbols and successfully converted them into 12 Entrez IDs with a 100% conversion ratio. A total of 193 biological processes (BPs), 15 cellular components (CCs), 19 molecular functions (MFs), and 40 KEGG pathways were enriched. Dot plots were used to visualise the main pathways (P.adj <0.05) () and the top three categories for each ontology (). Molecular correlation analysis revealed that DBT had strong negative correlations with DLD (r=-0.74) and moderate negative correlations with GLS (r=-0.67) and PDHB (r=-0.57). Furthermore, DLD was moderately correlated with GLS (r = 0.51) and SLC31A1 (r = 0.61) ().
3.3. Construction of machine learning models
A random forest (RF) model was established to evaluate the significant cuproptosis markers from the 12 DECRGs for predicting the occurrence of AD. After dividing the GSE5281 dataset into training (70%) and test (30%) sets, we constructed an RF model based on the training set (). The 12 DECRGs were ranked according to their mean decrease accuracy (). The top five CRGs with the largest mean decrease accuracy, namely MTF1, NFE2L2, GLS, DLD, and DBT, were selected as correlation markers to predict the occurrence of AD. The area under the curve (AUC) for the training set was 1 (), for the test set, it was 0.9 (), and for the external validation set, it was 0.804 (), indicating that the model effectively distinguished between AD and normal patients. In addition, we note that the ROC curve indicated that the area under the curve for the most important 5 CRGs in the external validation set was 0.804 ().
Figure 2. (A) Construction of Random forest (RF) model. (B) Ranking of the 12 DECRGs based on Mean Decrease Accuracy. (C) The ROC curve of training set. (D) The ROC curve of test set. (E) ROC curves of external validation set.
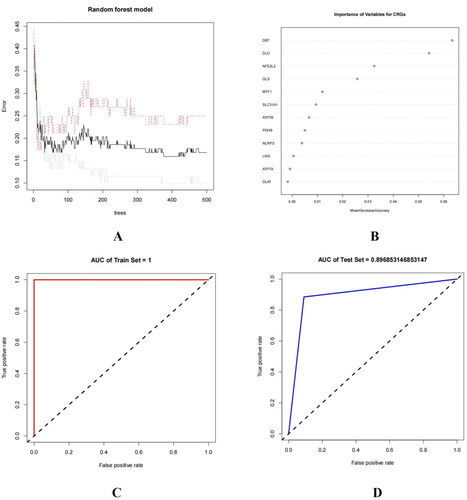
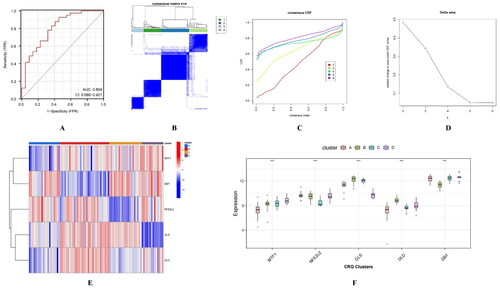
Figure 3. Validation of most important 5 CRGs and molecular typing. (A) ROC curve of most important 5 CRGs in the external validation set (B) Consensus clustering of 87 AD samples.(C) consensus CDF of each K (D)relative change in the area under the CDF curve (E) Heatmap of the expression of each gene in the four subtypes. (F) Boxplot of the expression of each gene in the four subtypes.
3.4. Molecular typing based on the five most important CRGs
The five most important CRGs were mapped to the samples of patients with AD in the GSE5281 dataset, and the samples were clustered. Considering the consensus CDF and relative change in the area under the CDF curve, K = 5 was deemed the ideal parameter (). However, one of the five subtypes contained only one sample, which was deemed insignificant for typing. We chose K = 4 () as the optimal value, resulting in 20, 32, 21, and 14 samples for each subtype, respectively (Table S1). The expression of the five CRGs in each subtype was visualised using a boxplot and heatmap (). The Kruskal-Wallis test revealed significant differences between at least two of the compared subtypes, suggesting that the five CRGs could serve as markers for classifying AD subtypes.
3.5. Construction of the nomogram model
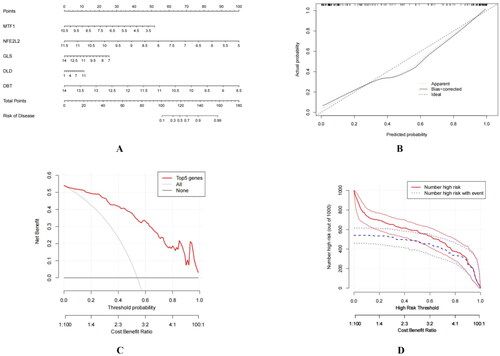
The constructed nomogram model is shown in . The calibration curve deviated from the diagonal line (), suggesting that the model was not well-calibrated and adjustments might be necessary to improve its performance. The decision curve analysis (DCA) curve (red line) was above treating all patients or treating none (grey and black) lines from 0–1, indicating that the nomogram model provided a higher net benefit than these strategies across the range of threshold probabilities. This suggests that the model could be clinically useful and may aid in guiding treatment decisions (). By comparing the two lines (Number high risk and Number high risk with event), the solid line consistently stayed above the dashed line across the range of threshold probabilities (), signifying the nomogram model’s significant predictive power.
Figure 4. Construction of a nomogram model. (A) Nomogram model. (B) Calibration curve of the model. (C) DCA curve of the model. (D) Clinical impact curve of the model.
3.6. Identification of the cuproptosis-related DElncRNAs
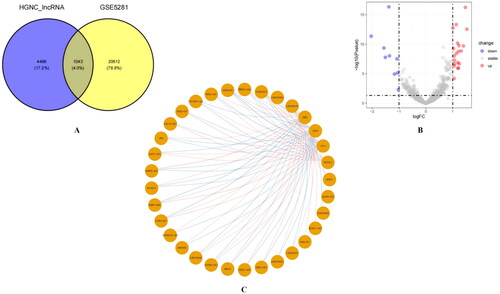
We downloaded 5,540 lncRNA gene symbols approved by the HGNC and overlapped them with the gene symbols of the GSE5281 dataset, obtaining 1,043 lncRNA probes (). With |logFC| > 1 and p value < 0.05 as cut-off values, we identified 29 DElncRNAs and visualised them using volcano plots () (Table S2). Notably, LY86-AS1 (logFC = −1.50) and MIR7-3HG (logFC= −1.56) were significantly downregulated in neurons of patients with AD. We then calculated Pearson’s correlation coefficients between the DELncRNAs and five CRGs. One lncRNA without co-expression with any CRGs was removed, and the remaining 28 DELncRNAs were correlated with at least one of the five CRGs (|r| > 0.3). A circle network diagram was used to visualise the correlation between CRGs and DELncRNAs (), with blue lines indicating negative correlation (r < −0.3) and red lines representing positive correlation (r > 0.3) (Table S3).
Figure 5. Identification of CRGs associated with DELncRNAs. (A) 1,043 lncRNA probes in GSE5281. (B) DELncRNAs in GSE5281. (C) Co-expression network of DELncRNAs and five CRGs (The blue lines indicate negative correlation (R< −0.3), while the red lines represent positive correlation (R > 0.3)).
3.7. Construction of CRGs co-expressed lncRNA-related ceRNA network
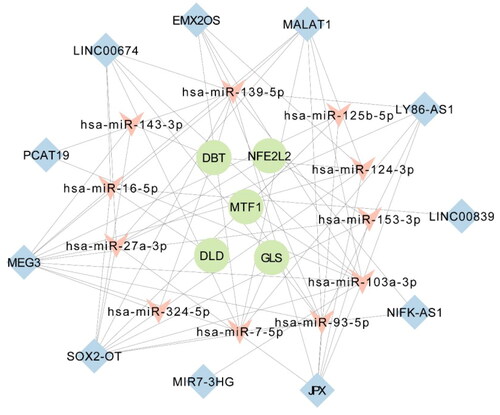
From the 110 AD-related miRNAs downloaded from HMDD, DIANA-Lncbase V3 identified 35 miRNAs that could interact with the 28 DELncRNAs. The miRTarBase predicted that these 35 miRNAs interacted with 7,815 target mRNAs. We combined these 7,815 predictive mRNAs with five cuproptosis-related markers to form the core of the ceRNA network. The DElncRNAs, targeted mRNAs, and interacting miRNAs that expressed in opposite patterns between lncRNAs and targeted mRNAs were removed from the ceRNA network. To explore the potential mechanisms of cuplavirus in AD pathophysiology, we constructed a regulatory ceRNA network that reveals lncRNA-miRNA-mRNA interactions. A ceRNA network with 27 nodes and 69 edges was constructed, including 11 lncRNA nodes, 110 miRNA nodes, and five cuproptosis-related mRNA nodes, as well as 58 lncRNA-miRNA and 11 miRNA-mRNA interacting edges (, Table S4).
Figure 6. The ceRNA network of 11 lncRNAs,11 miRNAs, and five cuproptosis-related mRNAs.
3.8. Results of immune infiltration
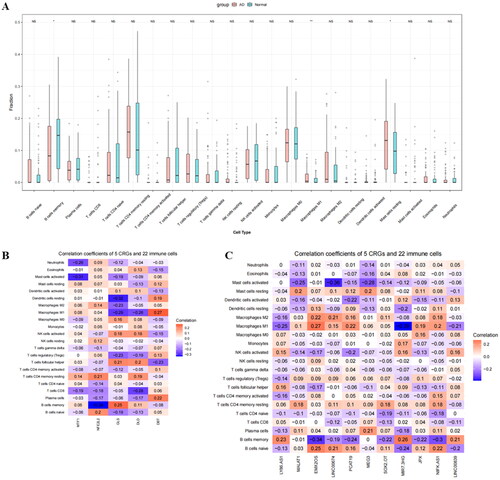
Immune cell infiltration analysis showed a higher infiltration of M1 macrophages and resting mast cells and lower infiltration of memory B cells in AD samples compared to normal samples (p < 0.05) (). Additionally, MTF1 was moderately and negatively correlated with activated mast cells, GLS with resting dendritic cells, and NFE2LE with memory B cells (). The cuproptosis-related lncRNAs, MIR7-3HG, exhibited a moderate negative correlation with M1 macrophages, while EMX2OS showed a moderate negative correlation with memory B cells ().
Figure 7. Evaluation and visualisation of immune cell infiltration and the correlation between cuproptosis-related markers and infiltrating immune cells. (A) Box plot of immune cell infiltration differences among the 22 types of immune cells between AD and normal samples (*indicates p < 0.05, **indicates p < 0.01, ***indicates p < 0.001, and NS indicates no statistical significance). (B) The correlation between CRGs and 22 types of immune cells. (C) The correlation between cuproptosis-related lncRNAs and 22 types of immune cells.
4. Discussion
Cuproptosis, a copper-dependent cell death pathway, relies on mitochondrial respiration. Excessive copper can bind to lipoylated components of the TCA cycle, leading to mitochondrial proteotoxic stress and ultimately, cell death (Tsvetkov et al. Citation2022; Tang et al. Citation2022). Intriguingly, Alzheimer’s disease (AD) pathogenesis is often accompanied by copper toxicity. Excessive copper levels have been linked to amyloid-beta (Aβ) accumulation in AD, with similar results observed in clinical studies of cognitive decline. However, the underlying mechanisms of copper-induced toxicity in AD and cognitive decline remain elusive (Ejaz et al. Citation2020; Choe et al. Citation2022). Numerous studies have implicated mitochondrial dysfunction as a key player in AD pathophysiology (Moreira et al. Citation2010; Reiss et al. Citation2022). Dysfunctional proteostasis, or the reduced clearance of damaged proteins, can contribute to Aβ accumulation in the brain, playing a crucial role in synaptic dysfunction and AD pathophysiology (Knopman et al. Citation2021). This study hypothesises that cuproptosis may be involved in AD pathogenesis and investigates the roles of copper-related genes (CRGs) and long non-coding RNAs (lncRNAs) in cuproptosis in AD using bioinformatics, potentially offering new insights into AD pathogenesis and treatment.
In our analysis of CRGs in GSE5281 (including 87 AD patients and 74 control samples), we constructed a Random Forest (RF) model based on 12 differentially expressed CRGs (DECRGs) and selected the five most important genes for further investigation. We then developed a nomogram model using these five CRGs to predict AD risk and categorised AD samples into four subtypes, indicating that these CRGs may serve as potential markers for AD classification. Furthermore, we constructed a competing endogenous RNA (ceRNA) network using cuproptosis-related mRNAs and differentially expressed lncRNAs (DElncRNAs) to explore the roles of non-coding RNAs in cuproptosis. Lastly, we identified differentially infiltrating immune cells, including M1 macrophages, mast cells, and memory B cells, using CIBERSORT and determined the associations between these immune cells and specific CRGs and lncRNAs.
Our analysis identified several CRGs and lncRNAs of potential interest for further investigation in AD. Dihydrolipoamide dehydrogenase (DLD) is a key protein in the mitochondrial enzyme complex responsible for regulating energy metabolism, and genetic variants of the DLD gene have been associated with late-onset AD (Brown et al. Citation2007). Reduced activity of DLD-containing enzyme complexes has been reported in AD patients (Gibson et al. Citation2012; Banerjee et al. Citation2016), and DLD suppression has been shown to induce tau phosphorylation and mitigate the proteotoxic effects of Aβ deposition in AD models (Ahmad Citation2018; Ahmad and Ebert Citation2021). Nuclear factor erythroid 2-related factor 2 (Nrf2 or NFE2L2) is an essential transcription factor that can mitigate oxidative stress in AD, and impaired Nrf2 nuclear translocation has been observed in early-stage AD. Nrf2 activators have been shown to reverse memory and synaptic plasticity impairments in rodent models, suggesting their potential as novel AD therapeutics (Bahn and Jo Citation2019; Davies et al. Citation2021). Additionally, Nrf2 is crucial for MRE/ARE-mediated transcription in response to copper (Song et al. Citation2014). In animal models, cuproptosis-related lncRNAs, such as MALAT1 and MEG3, have been shown to improve neuronal recovery and cognitive impairment in AD via the PI3K/Akt pathway (Yi et al. Citation2019; Li et al. Citation2020; Asadi et al. Citation2021). This cuproptosis perspective opens the possibility for the development of novel neuroprotective agents in addition to conventional anti-Aβ strategies for AD treatment.
Moreover, neuroinflammation is a widely recognised theory concerning AD pathogenesis, with microglia being the most well-known immune cells involved in AD development. Although microglia have been suggested to protect against AD, excessive microglial activity may be detrimental to neurons in neurodegenerative diseases. Amyloid plaques develop 10 to 20 years before the onset of AD clinical symptoms, while tau pathology and synaptic loss are associated with cognitive impairment during disease progression (Beason-Held et al. Citation2013). In this study, we utilised CIBERSORT to identify immune cells in each sample and determined the associations between differentially infiltrating immune cells and specific CRGs and lncRNAs. Our analysis revealed increased infiltration of M1 macrophages (microglia) and mast cells, and decreased infiltration of memory B cells in AD samples compared to normal samples.
We observed that GLS, a CRG, exhibited a negative correlation with M1 macrophages (microglia), while NFE2L2 was negatively correlated with memory B cells. Additionally, cuproptosis-related lncRNAs MIR7-3HG, NIFK-AS1, and EMX2OS were negatively correlated with M1 macrophages (microglia) and memory B cells, respectively. Under physiological conditions, different types of macrophages, such as microglia and meningeal macrophages, are present in the central nervous system. Increasing evidence suggests that microglia accumulate around senile plaques in AD (Kitazawa et al. Citation2004; Mammana et al. Citation2018), and high concentrations of Aβ do not cause neuronal damage in the absence of microglia (Giulian Citation1999). Chronic activation of microglia may exacerbate plaque pathology and contribute to the development of neurofibrillary tangles. Our study supports these findings, showing increased M1 macrophage (microglia) infiltration in AD samples compared to normal samples. Notably, GLS was negatively correlated with M1 macrophages and downregulated in AD samples, suggesting that low GLS expression may be associated with increased M1 macrophage infiltration. A previous study on cuproptosis reported that GLS is a shared gene between two copper ionophores, namely Cu-DDC and Elesclomol-copper (Tsvetkov et al. Citation2022). According to this study, GLS was downregulated in both copper ionophores. This insinuates that downregulated GLS is related to cuproptosis as well as the activation of M1 macrophages (microglia). Previous research on cuproptosis identified GLS as a shared gene between two copper ionophores, Cu-DDC and Elesclomol-copper, and demonstrated GLS downregulation in both ionophores. These findings imply that downregulated GLS is related to cuproptosis as well as the activation of M1 macrophages (microglia). It is speculated that cuproptosis may be linked to fibril and plaque formation in the brain, with some studies reporting high concentrations of trace metal copper in amyloid plaques (Miller et al. Citation2006). Furthermore, microglia have been shown to promote plaque growth through cell death in a mouse model (Baik et al. Citation2016). These findings suggest that GLS may be a key regulatory gene in cuproptosis, contributing to microglial dysfunction and amyloid plaque-associated neuroinflammation; however, further research is needed.
Consistent with our study, previous research has shown that lncRNA LY86-AS1 and MIR7-3HG are significantly downregulated in neurons of AD patients (Cao et al. Citation2019). The roles of these three molecules in AD cuproptosis warrant further investigation. Although the role of B cells in AD remains unclear, the diversity of B cell receptor libraries and the transformation of memory B cells decline with ageing, accompanied by a reduced antibody response to antigen attack. In contrast, a unique subset of mature B cells, called age-related B cells, accumulate in elderly mice promoting inflammation and autoimmunity while inhibiting B-cell lymphomagenesis (Naradikian et al. Citation2016; Riley et al. Citation2017). Nevertheless, the role of B cells in AD is not fully understood and requires further research. Additionally, Nrf2/NFE2L2 is an important transcription factor that can reduce oxidative stress in AD; hence it is a potential new treatment strategy for AD (Bahn and Jo Citation2019; Davies et al. Citation2021). EMX2OS is an antisense transcript of EMX2. Previous studies revealed abnormal methylation of key genes, such as EMX1 and EMX2, related to brain development and cortical regionalisation in neurodegenerative diseases (Barkova and Petrov Citation1976). The relationship between EMX2OS and memory B cells has yet to be reported. According to a previous study, SOX2OT is differentially expressed in AD model mice and is involved in the early and late stages of the disease, which suggests its role as a biomarker for AD (Arisi et al. Citation2011). Consequently, the role of SOX2OT as a biomarker for AD requires further exploration.
This study has several limitations that should be considered when interpreting the results: (Knopman et al. Citation2021) in vitro and in vivo experiments are needed to validate the identified CRGs and lncRNAs; (Qiu et al. Citation2009) This study focused on 17 CRGs obtained from a recent Science publication, warranting further investigation of other biologically meaningful genes (Torok et al. Citation2018). The concept of crosstalk among different cell death paradigms in the pathogenesis of AD, specifically examining the roles of oxidative stress-mediated ferroptosis and cuproptosis, may stimulate further research inquiries and offer innovative insights for elucidating pathogenic mechanisms and designing targeted therapeutic interventions in AD.
Conclusion
In conclusion, our study identified five CRGs and their associated lncRNAs potentially related to cuproptosis in AD. Based on these five CRGs, we classified AD into four subtypes. Furthermore, we discovered that CRGs and lncRNAs were associated with differentially infiltrating immune cells. These findings may offer important therapeutic targets for AD and provide new directions for future research.
Authors’ contributions
WX designed the study concept. YZ, QS not only analysed and interpreted the data but also drafted and revised the manuscript. YC guided the operation of R software and the installation of the packages. YZ, YC performed the Cytoscape software, supervised the study process, YZ, WX participated in reviewing, and provided funding. All authors read and approved the final manuscript.
Ethics statement
Ethical review and approval was not required for the study on human participants in accordance with the local legislation and institutional requirements. Written informed consent from the patients/participants or patients/participants’ legal guardian/next of kin was not required to participate in this study in accordance with the national legislation and the institutional requirements.
Supplemental Material
Download Zip (502.7 KB)Acknowledgements
This study benefited from GEO. We are grateful to the GEO Database for generously sharing this vast amount of data.
Disclosure statement
The authors declare that the research was conducted in the absence of any commercial or financial relationships that could be construed as a potential conflict of interest.
Data availability statement
All data are available in Supplemental Tables of this manuscript.
Additional information
Funding
References
- Ahmad W, Ebert PR. 2021. Suppression of a core metabolic enzyme dihydrolipoamide dehydrogenase (Dld) protects against amyloid beta toxicity in C. elegans model of Alzheimer’s disease. Genes Dis. 8(6):1–12. doi: 10.1016/j.gendis.2020.08.004.
- Ahmad W. 2018. Dihydrolipoamide dehydrogenase suppression induces human tau phosphorylation by increasing whole body glucose levels in a C. elegans model of Alzheimer’s disease. Exp Brain Res. 236(11):2857–2866. doi: 10.1007/s00221-018-5341-0.
- Arisi I, D’Onofrio M, Brandi R, Felsani A, Capsoni S, Drovandi G, Felici G, Weitschek E, Bertolazzi P, Cattaneo A, et al. 2011. Gene expression biomarkers in the brain of a mouse model for Alzheimer’s disease: mining of microarray data by logic classification and feature selection. J Alzheimers Dis. 24(4):721–738. doi: 10.3233/jad-2011-101881.
- Asadi MR, Hassani M, Kiani S, Sabaie H, Moslehian MS, Kazemi M, Ghafouri-Fard S, Taheri M, Rezazadeh M. 2021. The perspective of dysregulated Lncrnas in Alzheimer’s disease: a systematic scoping review. Front Aging Neurosci. 13:709568. doi: 10.3389/fnagi.2021.709568.
- Atwood CS, Scarpa RC, Huang X, Moir RD, Jones WD, Fairlie DP, Tanzi RE, Bush AI. 2000. Characterization of Copper interactions with Alzheimer amyloid beta peptides: identification of an attomolar-affinity Copper binding site on amyloid beta1-42. J Neurochem. 75(3):1219–1233. doi: 10.1046/j.1471-4159.2000.0751219.x.
- Bahn G, Jo DG. 2019. Therapeutic approaches to Alzheimer’s disease through modulation of Nrf2. Neuromolecular Med. 21(1):1–11. doi: 10.1007/s12017-018-08523-5.
- Baik SH, Kang S, Son SM, Mook-Jung I. 2016. Microglia contributes to plaque growth by cell death due to uptake of amyloid B in the brain of Alzheimer’s disease mouse model. Glia. 64(12):2274–2290. doi: 10.1002/glia.23074.
- Banerjee K, Munshi S, Xu H, Frank DE, Chen H-L, Chu CT, Yang J, Cho S, Kagan VE, Denton TT, et al. 2016. Mild mitochondrial metabolic deficits by Α-ketoglutarate dehydrogenase inhibition cause prominent changes in intracellular autophagic signaling: potential role in the pathobiology of Alzheimer’s disease. Neurochem Int. 96:32–45. doi: 10.1016/j.neuint.2016.02.011.
- Barkova EN, Petrov AV. 1976. The influence of oxygen barotherapy on erythropoiesis in the recuperative period of hemorrhagic collapse]. Biull Eksp Biol Med. 81(2):156–158.
- Beason-Held LL, Goh JO, An Y, Kraut MA, O’Brien RJ, Ferrucci L, Resnick SM. 2013. Changes in brain function occur years before the onset of cognitive impairment. J Neurosci. 33(46):18008–18014. doi: 10.1523/JNEUROSCI.1402-13.2013.
- Braschi B, Denny P, Gray K, Jones T, Seal R, Tweedie S, Yates B, Bruford E. 2019. Genenames.Org: the Hgnc and Vgnc resources in 2019. Nucleic Acids Res. 47(D1):D786–D792. doi: 10.1093/nar/gky930.
- Brown AM, Gordon D, Lee H, Wavrant-De Vrièze F, Cellini E, Bagnoli S, Nacmias B, Sorbi S, Hardy J, Blass JP, et al. 2007. Testing for linkage and association across the dihydrolipoyl dehydrogenase gene region with Alzheimer’s Disease in three sample populations. Neurochem Res. 32(4-5):857–869. doi: 10.1007/s11064-006-9235-3.
- Cao M, Li H, Zhao J, Cui J, Hu G. 2019. Identification of age- and gender-associated long noncoding Rnas in the human brain with Alzheimer’s disease. Neurobiol Aging. 81:116–126. doi: 10.1016/j.neurobiolaging.2019.05.023.
- Choe YM, Suh G-H, Lee BC, Choi I-G, Lee JH, Kim HS, Kim JW. 2022. Association between Copper and global cognition and the moderating effect of iron. Front Aging Neurosci. 14:811117. doi: 10.3389/fnagi.2022.811117.
- Dai B, Sun F, Cai X, Li C, Liu H, Shang Y. 2021. Significance of Rna N6-methyladenosine regulators in the diagnosis and subtype classification of childhood asthma using the gene expression omnibus database. Front Genet. 12:634162. doi: 10.3389/fgene.2021.634162.
- Dai XL, Sun YX, Jiang ZF. 2006. Cu(II) potentiation of Alzheimer Abeta1-40 cytotoxicity and transition on its secondary structure. Acta Biochim Biophys Sin (Shanghai)). 38(11):765–772. doi: 10.1111/j.1745-7270.2006.00228.x.
- Davies DA, Adlimoghaddam A, Albensi BC. 2021. Role of Nrf2 in synaptic plasticity and memory in Alzheimer’s disease. Cells. 10(8):1884. doi: 10.3390/cells10081884.
- Denny P, Feuermann M, Hill DP, Lovering RC, Plun-Favreau H, Roncaglia P. 2018. Exploring autophagy with gene ontology. Autophagy. 14(3):419–436. doi: 10.1080/15548627.2017.1415189.
- Ejaz HW, Wang W, Lang M. 2020. Copper toxicity links to pathogenesis of Alzheimer’s disease and therapeutics approaches. Int J Mol Sci. 21(20):7660.
- Gibson GE, Chen HL, Xu H, Qiu L, Xu Z, Denton TT, et al. 2012. Deficits in the mitochondrial enzyme Α-ketoglutarate dehydrogenase lead to Alzheimer’s disease-like calcium dysregulation. Neurobiol Aging. 33(6):1121 e13–24.
- Giulian D. 1999. Microglia and the immune pathology of Alzheimer disease. Am J Hum Genet. 65(1):13–18. doi: 10.1086/302477.
- Huang HY, Lin YC, Li J, Huang KY, Shrestha S, Hong HC, et al. 2020. Mirtarbase 2020: updates to the experimentally validated microrna-target interaction database. Nucleic Acids Res. 48(D1):D148–D54.
- Hudson WH, Prokhnevska N, Gensheimer J, Akondy R, McGuire DJ, Ahmed R, Kissick HT. 2019. Expression of novel long noncoding Rnas defines virus-specific effector and memory Cd8(+) T cells. Nat Commun. 10(1):196. doi: 10.1038/s41467-018-07956-7.
- Iasonos A, Schrag D, Raj GV, Panageas KS. 2008. How to build and interpret a nomogram for cancer prognosis. J Clin Oncol. 26(8):1364–1370. doi: 10.1200/jco.2007.12.9791.
- Idda ML, Munk R, Abdelmohsen K, Gorospe M. 2018. Noncoding RNAs in Alzheimer’s disease. Wiley Interdiscip Rev Rna. 9(2):1463. doi: 10.1002/wrna.1463.
- Karagkouni D, Paraskevopoulou MD, Tastsoglou S, Skoufos G, Karavangeli A, Pierros V, et al. 2020. Diana-Lncbase V3: indexing experimentally supported Mirna targets on non-coding transcripts. Nucleic Acids Res. 48(D1):D101–D10.
- Kitazawa M, Yamasaki TR, LaFerla FM. 2004. Microglia as a potential bridge between the amyloid beta-peptide and tau. Ann N Y Acad Sci. 1035(1):85–103. doi: 10.1196/annals.1332.006.
- Knopman DS, Amieva H, Petersen RC, Chételat G, Holtzman DM, Hyman BT, Nixon RA, Jones DT. 2021. Alzheimer disease. Nat Rev Dis Primers. 7(1):33. doi: 10.1038/s41572-021-00269-y.
- Li L, Xu Y, Zhao M, Gao Z. 2020. Neuro-protective roles of long non-coding Rna Malat1 in Alzheimer’s disease with the involvement of the microrna-30b/Cnr1 network and the following Pi3k/Akt activation. Exp Mol Pathol. 117:104545. doi: 10.1016/j.yexmp.2020.104545.
- Liang WS, Dunckley T, Beach TG, Grover A, Mastroeni D, Walker DG, Caselli RJ, Kukull WA, McKeel D, Morris JC, et al. 2007. Gene expression profiles in anatomically and functionally distinct regions of the normal aged human brain. Physiol Genomics. 28(3):311–322. doi: 10.1152/physiolgenomics.00208.2006.
- Liu J, Berthier CC, Kahlenberg JM. 2017. Enhanced inflammasome activity in systemic lupus erythematosus is mediated via type I interferon-induced up-regulation of interferon regulatory factor 1. Arthritis Rheumatol. 69(9):1840–1849. doi: 10.1002/art.40166.
- Mammana S, Fagone P, Cavalli E, Basile MS, Petralia MC, Nicoletti F, Bramanti P, Mazzon E. 2018. The role of macrophages in neuroinflammatory and neurodegenerative pathways of Alzheimer’s disease, amyotrophic lateral sclerosis, and multiple sclerosis: pathogenetic cellular effectors and potential therapeutic targets. Int J Mol Sci. 19(3):831. doi: 10.3390/ijms19030831.
- Marchese FP, Raimondi I, Huarte M. 2017. The multidimensional mechanisms of long noncoding Rna function. Genome Biol. 18(1):206. doi: 10.1186/s13059-017-1348-2.
- Miller JA, Woltjer RL, Goodenbour JM, Horvath S, Geschwind DH. 2013. Genes and pathways underlying regional and cell type changes in Alzheimer’s disease. Genome Med. 5(5):48. doi: 10.1186/gm452.
- Miller LM, Wang Q, Telivala TP, Smith RJ, Lanzirotti A, Miklossy J. 2006. Synchrotron-based infrared and X-ray imaging shows focalized accumulation of Cu and Zn co-localized with beta-amyloid deposits in Alzheimer’s disease. J Struct Biol. 155(1):30–37. doi: 10.1016/j.jsb.2005.09.004.
- Moreira PI, Carvalho C, Zhu X, Smith MA, Perry G. 2010. Mitochondrial dysfunction is a trigger of Alzheimer’s disease pathophysiology. Biochim Biophys Acta. 1802(1):2–10. doi: 10.1016/j.bbadis.2009.10.006.
- Naradikian MS, Hao Y, Cancro MP. 2016. Age-associated B cells: key mediators of both protective and autoreactive humoral responses. Immunol Rev. 269(1):118–129. doi: 10.1111/imr.12380.
- Newman AM, Liu CL, Green MR, Gentles AJ, Feng W, Xu Y, Hoang CD, Diehn M, Alizadeh AA. 2015. Robust enumeration of cell subsets from tissue expression profiles. Nat Methods. 12(5):453–457. doi: 10.1038/nmeth.3337.
- Qiu C, Kivipelto M, von Strauss E. 2009. Epidemiology of Alzheimer’s disease: occurrence, determinants, and strategies toward intervention. Dialogues Clin Neurosci. 11(2):111–128. doi: 10.31887/DCNS.2009.11.2/cqiu.
- Ratner B. 2009. The correlation coefficient: its values range between +1/−1, or do they? J Target Meas Anal Mark. 17(2):139–142. doi: 10.1057/jt.2009.5.
- Reiss AB, Ahmed S, Dayaramani C, Glass AD, Gomolin IH, Pinkhasov A, Stecker MM, Wisniewski T, De Leon J. 2022. The role of mitochondrial dysfunction in Alzheimer’s disease: a potential pathway to treatment. Exp Gerontol. 164:111828. doi: 10.1016/j.exger.2022.111828.
- Riley RL, Khomtchouk K, Blomberg BB. 2017. Age-associated B cells (Abc) inhibit B lymphopoiesis and alter antibody repertoires in old age. Cell Immunol. 321:61–67. doi: 10.1016/j.cellimm.2017.04.008.
- Ritchie ME, Phipson B, Wu D, Hu Y, Law CW, Shi W, Smyth GK. 2015. Limma powers differential expression analyses for Rna-sequencing and microarray studies. Nucleic Acids Res. 43(7):e47–e47. doi: 10.1093/nar/gkv007.
- Sabaie H, Moghaddam MM, Moghaddam MM, Ahangar NK, Asadi MR, Hussen BM, Taheri M, Rezazadeh M. 2021. Bioinformatics analysis of long non-coding Rna-associated competing endogenous Rna network in schizophrenia. Sci Rep. 11(1):24413. doi: 10.1038/s41598-021-03993-3.
- Sarell CJ, Wilkinson SR, Viles JH. 2010. Substoichiometric levels of Cu2+ ions accelerate the kinetics of fiber formation and promote cell toxicity of amyloid-{beta} from Alzheimer disease. J Biol Chem. 285(53):41533–41540. doi: 10.1074/jbc.M110.171355.
- Shannon P, Markiel A, Ozier O, Baliga NS, Wang JT, Ramage D, Amin N, Schwikowski B, Ideker T. 2003. Cytoscape: a software environment for integrated models of biomolecular interaction networks. Genome Res. 13(11):2498–2504. doi: 10.1101/gr.1239303.
- Song MO, Mattie MD, Lee CH, Freedman JH. 2014. The role of Nrf1 and Nrf2 in the regulation of Copper-responsive transcription. Exp Cell Res. 322(1):39–50. doi: 10.1016/j.yexcr.2014.01.013.
- Tang D, Chen X, Kroemer G. 2022. Cuproptosis: a Copper-triggered modality of mitochondrial cell death. Cell Res. 32(5):417–418. doi: 10.1038/s41422-022-00653-7.
- Torok J, Maia PD, Powell F, Pandya S, Raj A. 2018. A method for inferring regional origins of neurodegeneration. Brain. 141(3):863–876. doi: 10.1093/brain/awx371.
- Tsvetkov P, Coy S, Petrova B, Dreishpoon M, Verma A, Abdusamad M, Rossen J, Joesch-Cohen L, Humeidi R, Spangler RD, et al. 2022. Copper induces cell death by targeting lipoylated Tca cycle proteins. Science. 375(6586):1254–1261. doi: 10.1126/science.abf0529.
- Wang M, Qin L, Tang B. 2019. Micrornas in Alzheimer’s disease. Front Genet. 10:153. doi: 10.3389/fgene.2019.00153.
- Yi J, Chen B, Yao X, Lei Y, Ou F, Huang F. 2019. Upregulation of the Lncrna Meg3 improves cognitive impairment, alleviates neuronal damage, and inhibits activation of astrocytes in hippocampus tissues in Alzheimer’s disease through inactivating the Pi3k/Akt signaling pathway. J Cell Biochem. 120(10):18053–18065. doi: 10.1002/jcb.29108.
- Yin Z, Raj D, Saiepour N, Van Dam D, Brouwer N, Holtman IR, Eggen BJL, Möller T, Tamm JA, Abdourahman A, et al. 2017. Immune hyperreactivity of Aβ plaque-associated microglia in Alzheimer’s disease. Neurobiol Aging. 55:115–122. doi: 10.1016/j.neurobiolaging.2017.03.021.
- Yu G, Wang LG, Han Y, He QY. 2012. Clusterprofiler: an R package for comparing biological themes among gene clusters. OMICS. 16(5):284–287. doi: 10.1089/omi.2011.0118.