
Abstract
Background
Genome-wide association studies of COVID-19 severity have been carried out mostly on European or East Asian populations with small representation of other world regions. Here we explore the worldwide distribution and linkage disequilibrium (LD) patterns of genetic variants previously associated with COVID-19 severity.
Methods
We followed up the results of a large Spanish genome-wide meta-analysis on 26 populations from the 1000 Genomes Project by calculating allele frequencies and LD scores of the nine most significant SNPs. We also used the entire set of summary statistics to compute polygenic risk scores (PRSs) and carried out comparisons at the population and continental level.
Results
We observed the strongest differences among continental regions for the five top SNPs in chromosome 3. European, American, and South Asian populations showed similar LD patterns. Average PRSs in South Asian and American populations were consistently higher than those observed in Europeans. While PRS distributions were similar among South Asians, the American populations showed striking differences among them.
Conclusions
Considering the caveats of PRS transferability across ethnicities, our analysis showed that American populations present the highest genetic risk score, hence potentially higher propensity, for COVID-19 severity. Independent validation is warranted with additional summary statistics and phenotype data.
Introduction
Coronavirus disease 2019 (COVID-19) is an infectious disease caused by the severe acute respiratory syndrome coronavirus 2 (SARS-CoV-2). The WHO (World Health Organization Citation2023) declared it a public health emergency of international concern from 30 January 2020 to 5 May 2023. In that period, almost 770 million cases and around 7 million deaths occurred, making it the fifth deadliest epidemic and pandemic in history. The extensive clinical information collected from patients during this period has provided knowledge of many aspects of the disease including the genetic predisposition to severe forms. Higher gene expression, genetic variation in several genes, and genetic ancestry have been associated with the susceptibility, severity, and clinical outcomes of COVID-19, as different authors have suggested (e.g., Ishak et al. Citation2022).
Several genome-wide association studies (GWASs) have been performed to identify specific loci and variants related to COVID-19 severity and complexity of the observed symptoms (e.g., Pairo-Castineira et al. Citation2021). Many of the top loci are involved in immune response and viral pathogenesis, with the 3p21.31 locus on chromosome 3 being one of the most relevant ones. This segment has most probably been passed down from the Neanderthals to modern humans, and it includes clinically relevant genes like LZTFL1, FYCO1, XCR1, and CCR3 (Zeberg and Pääbo Citation2020; Yaghmouri and Izadi Citation2024).
During these 4 years of continuous research, the importance of the ethnic background in COVID-19 progression and treatment response has become evident. In the UK, Wan et al. (Citation2023) analysed the first two waves and found that ethnicity affected the association between adverse outcomes and phenotypes based on routine biomarker trajectories. They reported high-risk phenotypes associated with inflammation and catabolism in patients of African and Asian descent. The worst responses of these patients could be explained by health and social inequalities (Wan et al. Citation2023). Ethnicity-related health disparities have promoted a greater burden of cardiovascular and metabolic diseases in US African Americans and US Hispanic groups exacerbated by the pandemic (Bunsawat et al. Citation2022).
The impact of genetic ancestry itself as a risk factor for COVID-19 severity remains unclear because of the complex interaction between biological/genetic predisposition and health/social inequities. Data from different continental areas extracted from the WHO show that four main areas – Europe, Western Pacific, Americas, and South-East Asia – account for 96% of cases and suffered 91% of deaths (World Health Organization Citation2023). The lowest burden of morbidity and mortality due to COVID-19 has been recorded on the African continent. An integrative review of 21 studies found that this low burden was explained by a combined effect of a higher proportion of people of younger age and under-reporting of cases (Manna et al. Citation2023).
Most GWASs of COVID-19 have been performed in European or European-derived populations, as in the COVID-19 Host Genetics Initiative (COVID-19 Host Genetics Initiative Citation2021). From a total of 94 GWASs, 53 were performed in Europe; 26 in North America (one in African Americans, one in Europeans and African Americans, four in Mexicans, and the rest in samples with mixed ancestries); three in South America (including American and European ancestries); one in Africa (South Africa, mixed ancestries); five in West and Central Asia; five in East Asia, and one in Australia (mainly European ancestries). In sum, COVID-19 GWASs on Europeans account for at least 56% of the total, surpassing the already high proportion (43%) of GWASs for any trait carried out on Europeans relative to other regions of the world (https://www.ebi.ac.uk/gwas/).
In this paper, we have explored the extent to which the results of GWAS COVID-19 in samples of European ancestry can be applied to other populations. There is consensus suggesting that the results of the GWASs could be transferred if the distribution of risk variants and linkage disequilibrium (LD) patterns in the discovery population are similar to the ones in the non-discovery populations (Martin et al. Citation2017; Wang et al. Citation2020; Clarke et al. Citation2022; Mars et al. Citation2022). Since most risk variants have a small effect and limited predictive power, the use of polygenic risk scores (PRSs) – the joint consideration of genotypes and genetic effects across the entire genome (Choi et al. Citation2020) – can provide additional useful insights, contingent on the aforementioned conservation of LD patterns (Peterson et al. Citation2019).
Martin et al. (Citation2017) examined the transferability of GWASs performed on a single population, mainly European, to the populations of The 1000 Genomes Project. They concluded that correlations between true and inferred PRSs are highest in the population from which summary statistics were assessed. Wang et al. (Citation2020) proposed a theoretical model of the relative accuracy (RA) of PRS between ancestries as a function of population genetic parameters. Among their conclusions is that LD and minor allele frequencies (MAF) are relevant for RA. Clarke et al. (Citation2022) found that PRSs for coronary artery disease (CAD) showed similar predictive power in Hispanic and non-Hispanic US populations of European ancestry, although for some Hispanic individuals PRSs provided weaker risk predictions. Mars et al. (Citation2022) indicated that the transferability of PRSs results between ancestries was acceptable for individuals with European and, to a lesser extent, South and East Asian ancestry, and not so when applied to African populations. This observation is in line with Wang et al. (Citation2020), who also found that LD and MAF differences between ancestries could explain the loss of RA of European-based PRSs in populations of African ancestry for some traits.
To date, two published studies have carried out a genetic risk score prediction of COVID-19 severity based on GWAS results. The first used the summary statistics of a GWAS in 2,244 critically ill patients, most of whom were representative of European (75%) and, to a lesser extent, Asian ancestry (18%) (Pairo-Castineira et al. Citation2021), to predict susceptibility and severity in the Indian Population (Prakrithi et al. Citation2021). Although the discovery population was mainly of European origin and the genetic risk score was computed for several regions in India, the authors found a significant association between genetic score and COVID-19 mortality in different Indian sub-populations. LD patterns around the single nucleotide polymorphisms (SNPs) used in the genetic score calculations were conserved across populations, strengthening the relative accuracy of the genetic score prediction.
The second work was a GWAS conducted in 11,939 cases by Cruz et al. (Citation2022) with extensive clinical information from 34 hospitals across Spain (the SCOURGE consortium). The individuals used in the association testing were Spanish of European descent. The authors computed a genetic risk score based on 13 variants by combining the nine top hits for severity with other variants associated with hospitalisation and infection risk. The genetic score was able to accurately predict three out of the five original severity levels scale used to classify patients. They also performed a meta-analysis with a second Spanish cohort, the CNIO study (2,666 individuals). The results replicated the associations found in the 3p21.31 and 21q22 loci, and reported new associations in 9p21, 17q21, and 19q13. The nine variants outlined in this meta-analysis were associated with both hospitalisation risk and the three severity classes identified in the genetic risk score.
Considering the above, in this study we explore the worldwide distribution and LD patterns of the nine most significant SNPs associated with COVID-19 severity in Cruz et al. (Citation2022). To this end, we leverage data from worldwide populations of The 1000 Genomes Project. Moreover, we calculate PRSs for those worldwide populations to which we are confident that a European-based PRS is transferable with the intention of assessing if there are differential patterns of liability to COVID-19 severity. Although severity of disease or mortality from COVID-19 is no longer a major concern, knowing to what extent, or in which regions of the world, the results of the GWAS can be transferred may be useful, given that further studies in non-European populations are not expected.
Materials and methods
Populations and worldwide distribution of minor allele frequencies
We interrogated the online database The 1000 Genomes Project Consortium (Citation2015), Phase 3 to obtain the MAF distributions of the nine most significantly associated SNPs (rs115679256, rs17763742, rs35477280, rs4443214, rs115102354, rs10813976, rs1230082, rs17860169, and rs77127536) with severity in the meta-analysis of the SCOURGE and CNIO studies (Cruz et al. Citation2022). We carried out the rest of our analyses on a dataset including 2,504 individuals from 26 populations from Africa, Europe, South Asia, Southeast Asia, and the Americas.
Worldwide LD patterns
As a measure of evaluating the shared genetic structure across continents and populations, we explored the LD patterns of the nine most significant SNPs with two different approaches – namely, LD scores and LD friends – using GCTA (Yang et al. Citation2011). For LD scores, the software estimates the correlation coefficient of a given marker with each of the SNPs in the flanking regions, which in our case was set to include all markers up to 1 Mbp in either direction, and sums the resulting coefficients. SNPs with coefficients less than 0.01 were disregarded. LD scores among continents were compared with a Kruskal-Wallis test. Mann–Whitney U tests were used for pairwise comparisons between populations within each continent. For those continents with similar LD scores, we also estimated correlation coefficients between target SNPs and flanking variants (i.e. LD friends) within a window of 5,000 Kbp. Only significant correlations with nominal p-value < 0.05 were further considered.
Worldwide PRS distribution
We used the summary statistics from the meta-analysis for severity risk of the SCOURGE and CNIO studies of Cruz et al. (Citation2022) to calculate PRSs for each of the 2,397 The 1000 Genomes Project samples with PRSice (Choi and O’Reilly Citation2019). We excluded the Iberian samples (IBS) from this analysis as these were used as controls in the discovery phase. To match the build of the summary statistics, we lifted genomic coordinates from build 37 (GRCh37/hg19) to build 38 (GRCh38/hg38) in the The 1000 Genomes Project dataset using the online tool in Kent et al. (Citation2002). After standard quality-control filtering and default clumping, PRSice calculated PRSs using 176,196 out of a total of 3,387,800 overlapping variants between the two datasets. Comparisons between and within continents were carried out with Kruskal-Wallis and Mann–Whitney tests as above.
Results
and show MAFs of the nine SNPs associated with COVID-19 severity in Africa, Europe, East Asia, South Asia, and the Americas. MAFs in populations within each continental region are shown in Supplementary Table S1. The pattern of MAF distribution in the five SNPs on chromosome 3 shows the most relevant differences among continental regions. There are four SNPs with MAF equal or above 1% in Europe, South Asia, and America, whereas almost no variation is observed in Africa and East Asia. rs115679256 and rs115102354 show the highest frequencies in Europe (∼ 5%), followed by America (∼ 2%). rs17763742 and rs35477280 show the highest frequencies in South Asia (∼30–37%), followed by Europe (∼8–12%) and America (∼4–6%). Finally, rs4443214 shows the highest frequencies in Africa (44%) and the lowest in East Asia (4.6%). The four SNPs of chromosomes 9, 17, 19, and 21 show similar MAF patterns among continental regions. In all of them, MAFs are above 10%. rs10813976 shows the highest frequency in South Asia, rs1230082 in Europe, and rs77127536 and rs17860169 in East Asia.
Figure 1. Chromosome location, SNP identification/nearby gene(s), and minor allele frequency distribution of the nine SNPs associated with COVID-19 severity in the main geographical regions included in the 1000 Genomes Project Reference Panel.
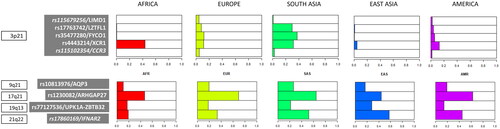
Table 1. Minor allele frequencies and gene information for the nine top SNPs associated to COVID-19 severity in Cruz et al. (Citation2022) in each of the five geographical regions included in the 1000 Genomes Project Consortium.
LD scores of the nine top hits for the main continental regions are detailed in Supplementary Table S2 and summarised in . As can be seen from the respective boxplots, Europe, America, and South Asia have overlapping ranges of LD scores while those from Africa and East Asia are lower. An LD score comparison among the five continents corroborates this observation (Kruskal-Wallis test; p-value = 8.717e-06; Supplementary Table S2). Further pairwise comparisons indicate that Europe, America, and South Asia present no significant differences in their LD score distributions, while Africa and East Asia are significantly different from the rest (Supplementary Table S2). Median r2 values of each target SNP’s LD friends are similar across Europe, America, and South Asia, even though they present statistically significant differences (data not shown), pointing at a conserved LD structure (Supplementary Table S3).
Figure 2. Boxplots of LD scores per (A) main geographical regions (AFRICA: ACB, ASW, ESN, GWD, LWK, MSL, YRI, EUROPE: CEU, FIN, GBR, IBS, TSI; SOUTH ASIA: BEB, GIH, ITU, PJL, STU; EAST ASIA: CDX, GHB, CHS, JPT, KHV; AMERICA: CLM, MXL, PEL, PUR) and (B) populations within regions (red = Africa; yellow = Europe; green = South Asia; Blue = East Asia; purple = America).
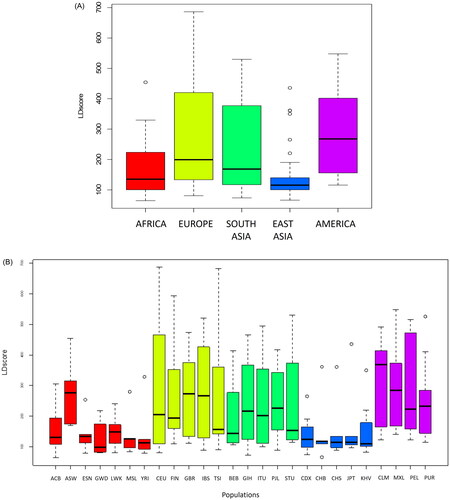
LD scores for populations within regions are shown in Supplementary Table S4 and represented in . The Kruskal-Wallis test indicates there are no significant differences among populations within each region (Supplementary Table S4). The only population showing an LD score pattern different from other African groups is ASW (African Ancestry in Southwest US), which is more in line with the European populations.
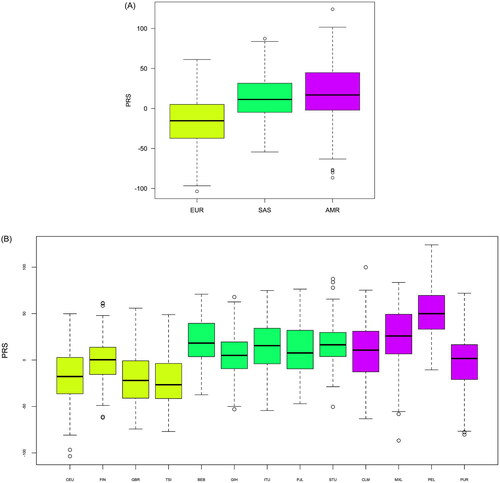
Regarding PRS calculations, we followed up only the three continents with overlapping LD patterns: Europe, South Asia, and the Americas, as we assume that PRS calculations in those are more transferable than in Africa and East Asia based on our LD pattern observations. shows individual-level PRS distributions for each of the three continents under study. Mean PRSs in Europe are generally lower compared to the other two continents. PRSs in South Asia and the Americas were consistently higher and pairwise comparisons showed that these differences were statistically significant (Supplementary Table S5), reinforcing the idea that, to a certain degree, each continent presents a different genetic liability to hospitalisation and disease severity. Population-level PRSs are shown in . It is worth mentioning that, whereas PRS distributions were fairly similar within South Asia, these were more disparate across populations within the Americas.
Figure 3. Boxplots of polygenic risk scores per (A) regions (EUR = Europe; SAS = South Asia; AMR = America), and (B) populations within regions (yellow = Europe; Green = South Asia; Purple = America).
Discussion
The main objective of this work has been to explore the worldwide distribution of a set of SNPs previously associated with COVID-19 severity in a large Spanish genome-wide meta-analysis (rs115679256, rs17763742, rs35477280, rs4443214, rs115102354, rs10813976, rs1230082, rs77127536, rs17860169). LD scores around these nine SNPs have allowed us to identify non-European populations with similar LD patterns and, therefore, to explore, by means of PRSs, the genetic liability of said populations to COVID-19 severity, since there are no ancestry-specific GWASs in many of them. Rather than relying on just the top nine hits, we used an infinitesimal approach for the PRS calculations.
Five of the nine SNPs associated with severity risk are in chromosome 3, and some of them lie in/near genes that have been previously associated with COVID-19 severity in other GWASs (COVID-19 Host Genetics Initiative Citation2021; Pairo-Castineira et al. Citation2021). Interestingly, among the regions of chromosome 3 associated with a high risk for COVID-19 there is a region containing an introgression from the Neanderthals (Zeberg and Pääbo Citation2020) close to the gene cluster of chemokine receptors CCR1, CCR2, CCR3, CCR5, CCR9, XCR1, and CXCR6 (Zeberg Citation2022). The 3p21.31 locus in chromosome 3 has been transferred to modern humans in Europe, but it is assumed that the Near East was an important interbreeding area, because it was the area of the first migration out of Africa (Zeberg and Pääbo Citation2020). This cluster includes some genes – LZTFL, FYCO1, XCR1, CCR3 – and SNPs examined in this work – rs17763742, rs35477280, rs4443214 – associated with COVID-19 severity (Yaghmouri and Izadi Citation2024). On the other hand, Jagoda et al. (Citation2023) identified another four introgressed alleles also associated with severe COVID-19 by modulating the regulation of two critical chemokines receptor genes: CCR1 and CCR5.
The SNPs of chromosome 3 we examined in this study are near the LIMD1, LZTFL1, FYCO1, XCR1, and CCR3 genes. Other studies reported results on some of these genes. The LZTFL1 gene encodes the leucine zipper transcription factor-like protein 1, which is highly expressed in human pulmonary and bronchial epithelial cells with an important implication in ciliary function regulation (Wei et al. Citation2016). A GWAS in the Italian population by Breno et al. (Citation2023) highlighted the association of rs35624553 in LZTFL1 with COVID-19 severity. In the same way, a meta‐analysis published by Eshetie et al. (Citation2023) concluded that a cluster of highly correlated nine SNPs at 3p21.31 locus, including LZTFL1 and SLC6A20, was significantly associated with disease severity. Similarly, rs73064425 and its two adjacent genes, LZTFL1 and SLC6A20, were also associated with COVID-19 severity in a GWAS that included COVID-19 patients from the UK Biobank cohort (Zhu et al. Citation2023). The genetic predisposition to severe forms of disease was also studied in a large representative sample of the Russian population (Gusakova et al. Citation2023). These authors found significant associations not only with LZTFL1 but also with FYCO1 and XCR1 and they suggested that FYCO1 may accelerate viral intracellular replication and exocytosis, increasing the risk of severe COVID-19. XCR1 encodes the XCL1 and XCL2 (Lymphotactins 1 and 2) receptor proteins. The encoded protein transduces a signal by increasing the intracellular calcium ion level. Studies on mice showed that XCR1 was expressed exclusively in CD8+ dendritic cells and XCL1 increased the production of antigen-specific CD8+ T cells and the secretion of IFN-gamma.
The 21q22.1 chromosome region containing the IFNAR2 gene has also been replicated in several GWASs and has been related to the role of IFNAR2 in modifying gene expression in the lungs (COVID-19 Host Genetics Initiative Citation2021; Ferreira et al. Citation2022). This gene encodes a type I membrane protein that forms one of the two chains of a receptor for interferons alpha and beta. Mutations in this gene are associated with antiviral immune response and the development of some immunodeficiency (Ferreira et al. Citation2022).
The associations with SNPs of 9p21, 17q21, and 19q13 have been reported for the first time in Cruz et al. (Citation2022). As explained by Cruz et al. in the discussion of their work, the AQP3 (9q21) gene is mainly expressed in the lung and could be related to the acute respiratory distress characteristic of some patients.
Regarding the global distribution of the nine SNPs here considered, Europe, America, and South Asia are the regions showing the most similar allele distribution pattern. In addition, for these SNPs they also show conserved LD blocks, and overlapping LD patterns with no significant differences in their LD scores. These similarities encouraged us to explore PRS distributions in the three world regions. Both the LD conservation of Europeans with Americans and South Asians, and the lack of conservation between Europeans with Africans, has already been reported in previous GWAS studies (Wang et al. Citation2020; Prakrithi et al. Citation2021; Clarke et al. Citation2022; Mars et al. Citation2022). The recent history of humans (40–60 thousand years ago) when contacts with archaic Neanderthal and Denisovan groups also occurred, is key to understanding global LD pattern relationships among current populations. Similarly, the lack of LD conservation with East Asians, and particularly with Africans, fits with the African origin of modern humans and the subsequent differentiation of the remaining populations (see the review of Bergström et al. Citation2021).
Patterns of PRS distribution varied significantly across the three continental groups considered. Europe showed the lowest average PRS values, while South Asia and the Americas showed notably higher values. Consequently, South Asian and American populations may have a higher propensity for COVID-19 severity. The American groups analysed here also showed some of the most disparate PRS patterns, with mean values ranging from −0.8 in Puerto Ricans to 49.75 in Peruvians. This disparity may be due to their different degrees of population admixture (Montinaro et al. Citation2015). In line with this result, in a study to predict cardiovascular disease using GWAS conducted in subjects of mainly European descent, US Hispanic individuals showed greater heterogeneity in PRS values than non-Hispanic individuals of European or African ancestry, although PRSs for CAD performed well in Hispanics overall (Clarke et al. Citation2022).
The most pronounced differences in PRS values were observed between Europe and South Asia. The PRSs in South Asia showed a mean value that ranged from 5.79 to 17.57. The SAS groups of 1000 Genomes are a small representation of the current South Asian diversity, particularly for Indian populations (Sengupta et al. Citation2016). A similar study, much more comprehensive in terms of population representativity, was conducted in 25 Indian sub-populations of the Indian Genome Variation Consortium (Prakrithi et al. Citation2021) using the top 100 most significant SNPs of the GWAS of Pairo-Castineira et al. (Citation2021), where the representativeness of the patients was mostly European. Due to methodological issues, the authors estimated the LD patterns of the 100 SNPs using data from populations of The 1000 Genome Project. More specifically, they compared the LD pattern of Indian Telegu from UK (ITU), Europeans (CEU), Africans (YRI), and Asians (CHB). LD patterns were conserved for the selected SNPs, allowing the calculation of genetic risk scores. The authors found that median PRS and COVID-19 mortality in each district were significantly associated. Some individuals in the sub-populations were at a high risk of developing severe forms of COVID-19.
Despite the insights we gained regarding the differences in genetic liability to hospitalisation due to COVID-19 infection, our study has limitations, the most important being the lack of COVID-19-related phenotypes in the target populations, which would allow us to estimate prediction accuracy. For this reason, our findings should be seen through the prism of merely describing the genetic potential of each population for disease liability. Polygenic predictions would also allow us to control for confounding factors, such as population structure, sex, and other relevant socioeconomic variables. Moreover, despite the similarities in MAF and LD patterns, there is no guarantee that the effects of causal variants in the target populations are similar to the SNP effects estimated in the discovery phase by Cruz et al. (Citation2022). These issues can limit the transethnic transferability of PRSs as argued elsewhere (Martin et al. Citation2017). More GWASs targeting non-European populations are warranted to bypass this issue and provide accurate predictions of susceptibility to infectious diseases such as COVID-19.
Supplemental Material
Download PDF (598.4 KB)Supplemental Material
Download MS Excel (39.2 KB)Disclosure statement
The authors report there are no competing interests to declare.
Additional information
Funding
References
- Bergström A, Stringer C, Hajdinjak M, Scerri EML, Skoglund P. 2021. Origins of modern human ancestry. Nature. 590(7845):229–237. doi: 10.1038/s41586-021-03244-5.
- Breno M, Noris M, Rubis N, Parvanova AI, Martinetti D, Gamba S, Liguori L, Mele C, Piras R, Orisio S, et al. 2023. A GWAS in the pandemic epicenter highlights the severe COVID-19 risk locus introgressed by Neanderthals. iScience. 26(10):107629. doi: 10.1016/j.isci.2023.107629.
- Bunsawat K, Grosicki GJ, Jeong S, Robinson AT. 2022. Racial and ethnic disparities in cardiometabolic disease and COVID-19 outcomes in White, Black/African American, and Latinx populations: physiological underpinnings. Prog Cardiovasc Dis. 71:11–19. doi: 10.1016/j.pcad.2022.04.005.
- Choi SW, Mak TS, O’Reilly PF. 2020. Tutorial: a guide to performing polygenic risk score analyses. Nat Protoc. 15(9):2759–2772. doi: 10.1038/s41596-020-0353-1.
- Choi SW, O’Reilly PF. 2019. PRSice-2: Polygenic Risk Score software for biobank-scale data. Gigascience. 8(7):giz082. doi: 10.1093/gigascience/giz082.
- Clarke SL, Huang RDL, Hilliard AT, Tcheandjieu C, Lynch J, Damrauer SM, Chang KM, Tsao PS, Assimes TL. 2022. Race and ethnicity stratification for Polygenic Risk Score analyses may mask disparities in Hispanics. Circulation. 146(3):265–267. doi: 10.1161/CIRCULATIONAHA.122.059162.
- COVID-19 Host Genetics Initiative. 2021. Mapping the human genetic architecture of COVID-19. Nature. 600(7889):472–477. https://www.covid19hg.org/. doi: 10.1038/s41586-021-03767-x.
- Cruz R, Diz-de Almeida S, López de Heredia M, Quintela I, Ceballos FC, Pita G, Lorenzo-Salazar JM, González-Montelongo R, Gago-Domínguez M, Sevilla Porras M. 2022. Novel genes and sex differences in COVID-19 severity. Hum Mol Genet. 31(22):3789–3806. doi: 10.1093/hmg/ddac132.
- Eshetie S, Jullian P, Benyamin B, Lee SH. 2023. Host genetic determinants of COVID-19 susceptibility and severity: a systematic review and meta-analysis. Rev Med Virol. 33(5):e2466. doi: 10.1002/rmv.2466.
- Ferreira LC, Gomes CEM, Rodrigues-Neto JF, Jeronimo SMB. 2022. Genome-wide association studies of COVID-19: connecting the dots. Infect Genet Evol. 106:105379. doi: 10.1016/j.meegid.2022.105379.
- Gusakova MS, Ivanov MV, Kashtanova DA, Taraskina AN, Erema VV, Mikova VM, Loshkarev RI, Ignatyeva OA, Akinshina AI, Mitrofanov SI, et al. 2023. GWAS reveals genetic basis of a predisposition to severe COVID-19 through in silico modeling of the FYCO1 protein. Front Med (Lausanne). 10:1178939. doi: 10.3389/fmed.2023.1178939.
- Ishak A, Mehendale M, AlRawashdeh MM, Sestacovschi C, Sharath M, Pandav K, Marzban S. 2022. The association of COVID-19 severity and susceptibility and genetic risk factors: a systematic review of the literature. Gene. 836:146674. doi: 10.1016/j.gene.2022.146674.
- Jagoda E, Marnetto D, Senevirathne G, Gonzalez V, Baid K, Montinaro F, Richard D, Falzarano D, LeBlanc EV, Colpitts CC, et al. 2023. Regulatory dissection of the severe COVID-19 risk locus introgressed by Neanderthals. Elife. 12:e71235. doi: 10.7554/eLife.71235.
- Kent WJ, Sugnet CW, Furey TS, Roskin KM, Pringle TH, Zahler AM, Haussler D. 2002. The human genome browser at UCSC. Genome Res. 12(6):996–1006. doi: 10.1101/gr.229102.
- Manna OK, Costa Clemens SA, Clemens R. 2023. Investigating the possible reasons for the low reported morbidity and mortality of COVID-19 in African countries: an integrative review. Pediatr Infect Dis J. 42(7):e222–e228. doi: 10.1097/INF.0000000000003916.
- Mars N, Kerminen S, Feng Y-CA, Kanai M, Läll K, Thomas LF, Skogholt AH, Della Briotta Parolo P, Biobank Japan Project, FinnGen, et al. 2022. Genome-wide risk prediction of common diseases across ancestries in one million people. Cell Genom. 2(4):100118. doi: 10.1016/j.xgen.2022.100118.
- Martin AR, Gignoux CR, Walters RK, Wojcik GL, Neale BM, Gravel S, Daly MJ, Bustamante CD, Kenny EE. 2017. Human demographic history impacts genetic risk prediction across diverse populations. Am J Hum Genet. 100(4):635–649. Erratum in: Am J Hum Genet. 2020;107(4):788–789. doi: 10.1016/j.ajhg.2017.03.004.
- Montinaro F, Busby GB, Pascali VL, Myers S, Hellenthal G, Capelli C. 2015. Unravelling the hidden ancestry of American admixed populations. Nat Commun. 6(1):6596. doi: 10.1038/ncomms7596.
- Pairo-Castineira E, Clohisey S, Klaric L, Bretherick AD, Rawlik K, Pasko D, Walker S, Parkinson N, Fourman MH, Russell CD, et al. Genetic mechanisms of critical illness in COVID-19. Nature. 2021;591(7848):92–98. doi: 10.1038/s41586-020-03065-y.
- Peterson RE, Kuchenbaecker K, Walters RK, Chen CY, Popejoy AB, Periyasamy S, Lam M, Iyegbe C, Strawbridge RJ, Brick L, et al. 2019. Genome-wide association studies in ancestrally diverse populations: opportunities, methods, pitfalls, and recommendations. Cell. 179(3):589–603. doi: 10.1016/j.cell.2019.08.051.
- Prakrithi P, Lakra P, Sundar D, Kapoor M, Mukerji M, Gupta I, The Indian Genome Variation Consortium. 2021. Genetic risk prediction of COVID-19 susceptibility and severity in the Indian population. Front Genet. 12:714185. doi: 10.3389/fgene.2021.714185.
- Sengupta D, Choudhury A, Basu A, Ramsay M. 2016. Population stratification and underrepresentation of Indian subcontinent genetic diversity in the 1000 Genomes Project Dataset. Genome Biol Evol. 8(11):3460–3470. doi: 10.1093/gbe/evw244.
- The 1000 Genomes Project Consortium. 2015. A global reference for human genetic variation. Nature. 526:68–74. doi: 10.1038/nature153.
- Wan YI, Puthucheary ZA, Pearse RM, Prowle JR. 2023. Characterising biological mechanisms underlying ethnicity-associated outcomes in COVID-19 through biomarker trajectories: a multicentre registry analysis. Br J Anaesth. 131(3):491–502. doi: 10.1016/j.bja.2023.04.008.
- Wang Y, Guo J, Ni G, Yang J, Visscher PM, Yengo L. 2020. Theoretical and empirical quantification of the accuracy of polygenic scores in ancestry divergent populations. Nat Commun. 11(1):3865. doi: 10.1038/s41467-020-17719-y.
- Wei Q, Chen ZH, Wang L, Zhang T, Duan L, Behrens C, Wistuba II, Minna JD, Gao B, Luo JH, et al. 2016. LZTFL1 suppresses lung tumorigenesis by maintaining differentiation of lung epithelial cells. Oncogene. 35(20):2655–2663. doi: 10.1038/onc.2015.328.
- World Health Organization. 2023. WHO coronavirus (COVID-19) [accessed 2023 Nov 10]. https://covid19.who.int/.
- Yaghmouri M, Izadi P. 2024. Role of the Neanderthal Genome in genetic susceptibility to COVID-19: 3p21.31 locus in the spotlight. Biochem Genet. doi: 10.1007/s10528-024-10669-w.
- Yang J, Lee SH, Goddard ME, Visscher PM. 2011. GCTA: a tool for genome-wide complex trait analysis. Am J Hum Genet. 88(1):76–82. doi: 10.1016/j.ajhg.2010.11.011.
- Zeberg H. 2022. The major genetic risk factor for severe COVID-19 is associated with protection against HIV. Proc Natl Acad Sci USA. 119(9):e2116435119. doi: 10.1073/pnas.2116435119.
- Zeberg H, Pääbo S. 2020. The major genetic risk factor for severe COVID-19 is inherited from Neanderthals. Nature. 587(7835):610–612. doi: 10.1038/s41586-020-2818-3.
- Zhu D, Zhao R, Yuan H, Xie Y, Jiang Y, Xu K, Zhang T, Chen X, Suo C. 2023. Host genetic factors, comorbidities and the risk of severe COVID-19. J Epidemiol Glob Health. 13(2):279–291. doi: 10.1007/s44197-023-00106-3.