
Abstract
Background
Rising global obesity rates are linked with inflammation and associated morbidities. These negative outcomes are generally more common in low-resource communities within high-income countries; however, it is unclear how frequent infectious disease exposures in these settings may influence the relationship between adiposity and inflammation.
Aim
We test associations between adiposity measures and distinct forms of inflammation among adults (n = 80) living in low-resource U.S. communities experiencing high levels of obesity and pathogen exposure.
Subjects and methods
Adiposity measures included BMI and percent body fat. Inflammation measures included systemic inflammation (C-reactive protein [CRP]) and localised intestinal inflammation (faecal calprotectin [FC]). The relationship between a condition characterised by elevated inflammation (Helicobacter pylori infection) and adiposity was also considered.
Results
Adiposity was not significantly related to FC concentration. However, both adiposity measures were positively related with odds of CRP elevation and H. pylori infection was associated with significantly lower adiposity measures (all p < 0.05).
Conclusion
For this disadvantaged U.S. sample, the association between adiposity and inflammation varies by the systemic/localised nature of inflammation and the likely underlying cause of inflammation. Defining these associations will improve understanding of how rising obesity rates shape long-term health inequities, with implications for more effective intervention design.
Introduction
In light of the global health threat posed by obesity, the present study reviews how adiposity can both lead to elevated inflammation and, simultaneously, be shaped by inflammation generated by ongoing infection. We then consider how high rates of both obesity and infectious disease result in a dual burden of disease, a phenomenon largely studied in lower-income countries. More work is needed to assess the dual burden of chronic and infectious disease within low-resource areas of high-income countries, including the U.S. To address this gap, we test links between adiposity, inflammation markers, and a common infection characterised by elevated inflammation in two low-resource U.S. communities that experience both high infectious disease burdens and high obesity rates.
Global burden of obesity
Recent estimates suggest that roughly 3.12 billion people (∼39% of the global population) are affected by obesity (World Obesity Federation Citation2023). Obesity is defined as excessive adipose tissue accumulation to a level that threatens individual health (World Health Organization Citation2023), with higher obesity rates often attributed to energetic factors like dietary shifts (e.g. increased access to calorically-dense food) and exposure to obesogens (e.g. chemical pollutants found in everyday objects that act as endocrine disruptors) (Egusquiza and Blumberg Citation2020; Popkin et al. Citation2012; Swinburn et al. Citation2004). Obesity rates are expected to continue rising in the coming years, potentially affecting more than half of the global population (over 4 billion people) by the year 2035 (World Obesity Federation Citation2023). Current data indicates that obesity resulted in 160 million disability adjusted life years (DALYs) in 2019 (Chong et al. Citation2023), reflecting the substantial impact of obesity-related conditions on quality of life. For instance, obesity can decrease quality of life by negatively impacting individual health in a variety of ways, including increasing the risk for several comorbidities (e.g. various forms of cancer, diabetes, cardiovascular disease, liver and kidney disease, etc.) (Abdelaal et al. Citation2017; Guh et al. Citation2009; Kovesdy et al. Citation2017). Many obesity-related health conditions are linked with chronic inflammation caused at least in part by high adipose tissue levels (Furman et al. Citation2019; Pérez et al. Citation2016; Schipper et al. Citation2012; Tchernof and Després Citation2013).
Adiposity and inflammatory pathways
Adipose tissue serves as an active endocrine organ and has been shown to secrete various pro-inflammatory cytokines (e.g. interleukin [IL]-6 and tumour necrosis factor [TNF]-α) (Aronson et al. Citation2004; Cohen et al. Citation2021; Florez et al. Citation2006; McDade et al. Citation2021; Vahdat et al. Citation2012). While acute inflammation is an important physiological response that serves as a first line of defence to infection or injury, the chronic inflammation characteristic of obesity often damages bodily tissue (Furman et al. Citation2019; Multhoff et al. Citation2012). Beyond the duration or strength of an inflammatory response, the location of inflammation may also shape individual wellbeing. Evidence indicates that visceral adipose tissue (i.e. surrounding central organs) may produce more pro-inflammatory cytokines relative to adipose tissue located peripherally, potentially exerting a greater impact on chronic health patterns (Alexopoulos et al. Citation2014; Alvehus et al. Citation2010; Fontana et al. Citation2007; Mathieu et al. Citation2009). Moreover, inflammatory responses can be systemic (i.e. spread across the body) or localised (i.e. isolated to a specific location within the body) (Furman et al. Citation2019; Grigg and Sonnenberg Citation2017). It should be noted, however, that links between obesity and inflammation are complex, and a growing body of evidence suggests that stigma experienced by people with obesity may lead to stress responses that elevate inflammation levels and lead to negative health outcomes (Brewis et al. Citation2018; Keirns et al. Citation2023; Muennig Citation2008; Tomiyama et al. Citation2018). In addition, inflammation caused by acute infections may also impair wellbeing and affect host energetics (Gildner et al. Citation2022), compounding poor health outcomes in populations experiencing both high levels of pathogen exposure and obesity.
Links between infections characterised by elevated inflammation and body composition
In addition to body composition (e.g. high levels of adiposity) influencing inflammation, it is possible that inflammation linked with infection may also impact body composition. For example, infection with the potentially pathogenic bacteria Helicobacter pylori is common worldwide – impacting up to half of the global population – and in many cases is not symptomatic; yet, roughly 20% of infected individuals develop severe symptoms directly linked with inflammatory immune activity (e.g. ulceration and increased gastrointestinal cancer risk) (Blaser and Falkow Citation2009; Fuenmayor-Boscán et al. Citation2020). Interestingly, previous studies have documented links between H. pylori infection and body composition, including several that have found that infected individuals exhibit significantly greater levels of adipose tissue compared to uninfected study participants (Abdullahi et al. Citation2008; Arslan et al. Citation2009; Jiang et al. Citation2022; Kamarehei and Mohammadi Citation2022; Xu et al. Citation2019). It has been hypothesised that a positive relationship between infection and adiposity levels may be due to gastric inflammation-induced dysregulation of hormones that increases caloric consumption during infection (Abdullahi et al. Citation2008; Arslan et al. Citation2009; Jiang et al. Citation2022; Kamarehei and Mohammadi Citation2022; Xu et al. Citation2019). Still, it is unclear how H. pylori infection status and adiposity are related among affected populations living in high-income countries like the U.S., since most work has been conducted in lower-income nations.
The dual burden of disease
Several studies investigating links between adiposity levels and various forms of inflammation have focused on the effects of increasing access to calorically dense, nutrient poor foods in lower-income countries in conjunction with high pathogen burdens (Amuna and Zotor Citation2008; Popkin et al. Citation2012; Swinburn et al. Citation2004). This combination is thought to result in a dual burden of disease, with individuals exhibiting high rates of both chronic conditions - including obesity and related comorbidities – and infectious diseases that trigger inflammatory immune responses that may affect body composition (Bygbjerg Citation2012; Dunachie and Chamnan Citation2019; Thompson et al. Citation2020). Other studies have investigated obesity patterns in high-income nations, with widespread sanitation systems and healthcare access that ideally protect against infection and associated inflammation. These populations are also largely characterised by relatively sedentary lifestyles and access to inexpensive calorically dense food, which might promote the development of obesity (Egusquiza and Blumberg Citation2020; Jackson et al. Citation2020; Popkin et al. Citation2012; Swinburn et al. Citation2004). It is well established that obesity rates within high-income countries like the U.S. are typically higher among low-resource communities, a pattern largely attributed to lack of access to affordable nutritious food and limited leisure time for exercise (Denis et al. Citation2018; McClendon et al. Citation2021). However, very limited research exists on the dual burden of chronic and infectious disease within low-resource areas of high-income countries.
Within the U.S., for example, substantial variation in obesity risk, pathogen exposure, and associated poor health are evident, though many of these health issues remain neglected. This lack of data is partly due to the fact that many infectious diseases (e.g. harmful bacteria, amoebas, and parasites) are largely ignored in high-income nations like the U.S., based on the faulty assumption that these infections are restricted to low- and middle-income countries (Hotez Citation2008, Citation2013, Citation2018; Lynn et al. Citation2021). These infectious disease burdens may be disproportionally high among low-resource U.S. communities characterised by harmful environmental exposures linked with inadequate infrastructure (e.g. failing sanitation systems), widespread poverty, and high levels of psychosocial stress that may negatively impact immune function (Blackburn and Lively Citation2020; Hotez Citation2008, Citation2018). Thus, a dual burden of infectious disease (like H. pylori infection) and chronic conditions (like obesity) may be present, but largely unrecognised, in parts of the U.S., similar to what has been documented in lower-income nations. More work is needed in low-resource U.S. populations experiencing high levels of pathogen exposure and obesity to assess links between adiposity and various inflammation pathways (e.g. systemic physiological responses, localised immune activity), as well as test how specific health issues directly linked with inflammation (e.g. H. pylori infection) may be related to body composition.
Study rationale and objectives
Here, we test links between adiposity, inflammation markers, and a common infection characterised by elevated inflammation in two low-resource U.S. communities – one in the Mississippi Delta and the other in Southwestern Illinois – characterised by both high infectious disease burdens and high obesity rates. This study was conducted as part of the Rural Embodiment and Community Health project (REACH; https://www.reachresearch.org/), which was established in 2019 with the goal of determining the prevalence of neglected infectious diseases, as well as testing relationships between lifestyle variation, ecological factors, and health patterns in low-resource rural regions of the U.S. The project focuses on the impact of exposure to underdiagnosed pathogens on immune function, including inflammation levels. Previous analyses in the Mississippi Delta indicate high levels of childhood intestinal inflammation compared to similarly-aged children living in both high- and lower-income nations (Cepon-Robins et al. Citation2022). Data collected from adults in this area indicate similar patterns, including high rates of intestinal inflammation (67% of the sample had clinically-elevated inflammation levels) and H. pylori infection (45% tested positive) (Gildner et al. Citation2023). These initial findings suggest that gastrointestinal infections continue to be quite common in low-resource U.S. communities, and may result in inflammatory immune responses with the potential to affect participant energetics and body composition. However, links between adiposity, various forms of inflammation, and infections characterised by elevated inflammation have not yet been tested in these settings, despite high levels of infection and reported community concerns about inadequate sanitation infrastructure, high obesity levels, and poor nutrition.
The objectives of the present study are three-fold: (i) to test the association between measures of adiposity levels and a measure of systemic inflammation; (ii) to test the relationship between adiposity measures and a measure of localised inflammation; and, (iii) to assess the association between a commonly experienced health condition linked with inflammation and adiposity proxy measures. The minimally-invasive measures of adiposity included body mass index (BMI) and percent body fat (%BF). Systemic inflammation was measured using C-reactive protein (CRP); a highly sensitive marker of systemic inflammation and associated tissue damage secreted in response to pro-inflammatory cytokines (Pepys and Hirschfield Citation2003). Localised intestinal inflammation was assessed using faecal calprotectin (FC); a protein produced by white blood cells, with elevated levels in stool indicative of inflammation-linked alterations to the mucosal barrier and subsequent crossing of white blood cells into the intestine (D’Incà et al. Citation2007). Finally, H. pylori infection was included in analysis as a common condition characterised by elevated inflammation with the potential to influence body composition. Based on the assumption that individuals in these contexts simultaneously experience obesogenic conditions and high levels of pathogen exposure, we tested the predictions that the likelihood of (i) elevated CRP concentrations (possibly associated with adipose tissue physiology) and (ii) clinically-elevated FC levels (often linked with intestinal infection) would be greater among participants with higher BMI or %BF measures. In addition, we predicted that (iii) a positive H. pylori infection test would be related with higher BMI or %BF measures. Relationships between the two inflammation measures and H. pylori infection status were also assessed.
Materials and methods
Study sample
Data were collected between June and August 2022 in two communities. The first community, located in the rural Mississippi Delta region, has a population of approximately 2,000 individuals. Roughly 95% of individuals in the community identify as Black or African American, and the median household income is $20,265 based on US census estimates. The second community, located in suburban Southwestern Illinois, has a population of roughly 14,500 people and a median income of $30,000. Approximately 65% of individuals in the community identify as Black or African American based on US census data. Both communities experience limited access to key resources, including to full grocery stores for many families (leading to a reliance on the limited food selection available at local dollar stores and neighbouring gas stations). Furthermore, access to full hospitals was limited for many participants, and concerns about tap water safety were widely reported in both regions. The sample included 80 adults (42 from Mississippi and 38 from Illinois), between the ages of 19–84 years old. The majority of study participants at both sites self-identified as Black or African American, consistent with overall community demographics. Informed consent was obtained for all participants. The authors report there are no competing interests to declare.
Data collection
Biological sample collection
Dried blood spots (DBS) were collected from participants to measure CRP. Following standard protocols, three to five drops of whole blood were collected on filter paper from a single finger prick following standard minimally-invasive collection methods (McDade et al. Citation2007). Samples were dried 4 h, frozen, and shipped for analysis of CRP. In addition, stool samples were collected by participants and returned to researchers as described in similar studies (Cepon-Robins et al. Citation2014, Citation2022). Faecal calprotectin was extracted from stool samples using the CALEX Cap device (B-CALEX-C; BUHLMANN Diagnostics Corp, Amherst, NH). A small portion of each stool sample was also aliquoted into a 2 ml cryotube. The CALEX Cap devices and stool aliquots were frozen and transported for analysis of FC and H. pylori infection status. Two participants failed to return stool samples for analysis, resulting in a final sample size of 78 for analyses using stool sample data.
Inflammation and infection measures
All mandatory health and safety procedures were complied with in the course of conducting the laboratory procedures below, and all lab personnel had received the required certifications to complete work in a BSL2 lab.
Systemic inflammation, reflected by C-reactive protein levels: CRP concentrations were determined using a modified high-sensitivity enzyme-linked immunosorbent assay (ELISA) protocol developed specifically for DBS (Blackwell et al. Citation2010; McDade et al. Citation2004; Urlacher et al. Citation2018). Samples were assayed in duplicate, with inter-assay coefficients of variation (CV) of 0.34% for the Illinois samples and 2.0% for the Mississippi samples. Intra-assay coefficients were 4.7% for the Illinois samples and 7.2% for the Mississippi samples. Consistent with previous studies, CRP DBS concentrations were converted to serum-equivalent values using a validated assay-specific conversion equation (Mcdade et al. Citation2012; Urlacher et al. Citation2018). Elevated systemic inflammation was subsequently identified from serum-equivalent values as CRP > 3 mg/L, a common cut-point for clinically-relevant chronic inflammation (Mcdade et al. Citation2012; Pearson et al. Citation2003). While some studies exclude individuals with CRP > 10 mg/L due to likely acute phase response to infection or injury (Mcdade et al. Citation2012), including the 11 people in the present sample with CRP > 10 mg/L did not appreciably alter results. We therefore included all individuals in our analysis.
Localised inflammation, reflected by faecal calprotectin concentrations: Extracted faecal samples were assayed together (combining the Mississippi and Illinois samples) in duplicate via ELISA (EK-CAL; BULMANN Diagnostics Corp, Amherst, NH). Inter-assay coefficients of variation were 5.0% and 14.4% for high and low control samples, respectively, resulting in an overall inter-assay coefficient of 9.7%. The intra-assay coefficient of variation was 12.0%. The slightly high intra-assay coefficient was due to one plate with particularly high CVs for a handful for samples as the ELISA protocol was being refined, each of these high CV samples was successfully re-run on a subsequent plate and these re-run FC values were used during analysis. Using measured FC concentrations, participants were categorised based on the inflammation level to assess prevalence of clinically-elevated intestinal inflammation (normal: <50 ug/g; elevated: 50 μg/g or greater) based on reference values provided by the manufacturer; following previous work, this categorical variable was used during analysis to identify medically relevant cases of elevated FC (Campeotto et al. Citation2004; Cepon-Robins et al. Citation2019; Fagerberg et al. Citation2003; Gisbert and McNicholl Citation2009; Hestvik et al. Citation2011; Michels et al. Citation2017; Olafsdottir et al. Citation2002).
Helicobacter pylori infection status (negative vs. positive): Commercially available ELISA kits (T5051; TechLab Inc, Blacksburg, VA) were used to test for H. pylori infection. This kit yields a positive or negative result – rather than a concentration value – and samples were not run in duplicate, per the kit instructions.
Adiposity measures
Obesity is often identified using BMI, the ratio of weight to height (kg/m2). While BMI is an imprecise measure that does not account for body composition (e.g. amount of adipose vs. lean tissue), it is a non-invasive and inexpensive measure that can be useful in largescale epidemiological studies (Frankenfield et al. Citation2001; Nevill et al. Citation2006). Cut-offs for weight categories using BMI are typically made using the following World Health Organisation classifications: underweight (<18.5 kg/m2), “healthy” weight (18.5–24.9 kg/m2), overweight (25.0–29.9 kg/m2), and obese (≥30 kg/m2) (World Health Organization Citation2000). Similarly, percent body fat (%BF) – often calculated using a bioelectrical impedance scale – is a commonly used marker of obesity risk. There is some debate about appropriate cut-offs for “healthy” vs high percent body fat based on age, sex, and population, with some proposing that obesity should be defined as body fat percentage >35% for women and >25% for men (Romero-Corral et al. Citation2008; Woolcott and Bergman Citation2018). Despite the uncertainty about reliable cut-offs, higher body fat percentages have been linked with classifications of obesity and related chronic health conditions (Romero-Corral et al. Citation2008; Woolcott and Bergman Citation2018). Thus, these two minimally-invasive indicators of adipose levels were used.
Body mass index: Participant height and weight were obtained with a stadiometer (Seca Corporation 214, Hanover, MD) and Tanita scale (model BF-689); these measures were used to calculate BMI using the following equation: weight (kg)/height (m2).
Percent body fat: The same Tanita scale was also used to measured %BF using proprietary bioelectric impedance analysis.
Covariates
The research team conducted interviews with study participants to collect data on individual demographics, household infrastructure, and health history. Several covariates potentially linked with the key variables of interest were collected as part of a participant interview and included during analysis. These covariates included community (Mississippi vs. Illinois), self-reported sex, age, race (Black/African American, white, other), annual household income (under $20,000 vs $20,000 or higher), and whether someone in the household smoked (no vs yes). The household income cut-off of $20,000 was selected because this was approximately the median community household income level at the time of data collection.
Statistical analyses
Data analyses were conducted using Stata 14. Continuous variables were normally distributed (skewness values within ±1). Multicollinearity was not detected between variables, VIF values ranged from 1.01–1.02. Logistic regression analyses were run to test whether the odds of exhibiting elevated CRP or elevated FC were related to BMI or %BF, while controlling for relevant covariates (community, sex, age, race, annual household income, and whether someone in the household smoked). Linear regression analyses were also conducted to test whether positive H. pylori infection status was related to BMI or %BF, while controlling for the same covariates. Chi-squared analyses were conducted to assess the relationships between the three inflammation measures. Results were considered significant at p < 0.05. The sample was predominantly comprised of adults living in different households (74 unique household were reported for the 80 participants); thus, household clustering was not a concern in these analyses.
Results
Descriptive statistics are presented in . Study participants were, on average, older adults (average age of 55), and the majority identified as female and Black/African American. Most participant households made less than $20,000 annually and smoking was reported in nearly half of households. High levels of adiposity, as indicated by BMI or %BF, were also evident in the sample, with average BMI and %BF values both falling in the ranges often used to identify obesity. Finally, nearly half of participants displayed elevated CRP concentrations and the majority exhibited clinically-elevated FC levels. Close to half the sample also tested positive for H. pylori. No significant relationships were observed between the three inflammation measures (all chi-squared test p-values > 0.1).
Table 1. Descriptive statistics of key variables.
Objective 1: Associations between CRP and adiposity measures
As predicted, individuals with higher BMI or %BF measurements exhibited higher odds of displaying elevated CRP (BMI model aOD =1.16, 95%CI = 1.06–1.28, p = 0.002; %BF model aOD = 1.13, 95%CI = 1.03–1.24, p = 0.007) ( and ; ). Participant sex was also significant in the %BF model, with female participants displaying lower odds of elevated CRP compared to males (aOD = 0.11, 95%CI = 0.02–0.69, p = 0.019). Finally, study community and having a smoker in the house were significant in the BMI model only. Participants from the Illinois community exhibited significantly lower odds of elevated CRP compared to participants from Mississippi (aOD = 0.29, 95%CI = 0.09–0.97, p = 0.044), while participants living in households where someone smokes displayed higher odds of elevated CRP compared to smoker-free households (aOD = 3.22, 95%CI = 1.01–10.30, p = 0.049).
Figure 1. Violin plots depicting BMI (top graph) and percent body fat (bottom graph) for participants exhibiting non-elevated vs elevated C-reactive protein concentrations. The white circle marks the group median, the box indicates interquartile range, with whiskers extending to the upper and lower-adjacent values. Overlaid shape reflects the probability density of the data at different BMI or percent body fat values.
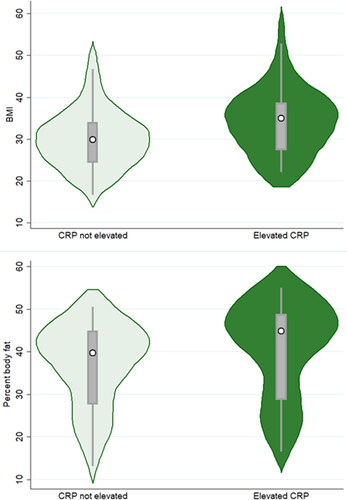
Table 2. Logistic regression models assessing associations between BMI and the likelihood of exhibiting elevated biomarkers of inflammation and infection.
Table 3. Logistic regression models assessing associations between percent body fat and the likelihood of exhibiting elevated biomarkers of inflammation and infection.
Objective 2: Associations between faecal calprotectin and adiposity measures
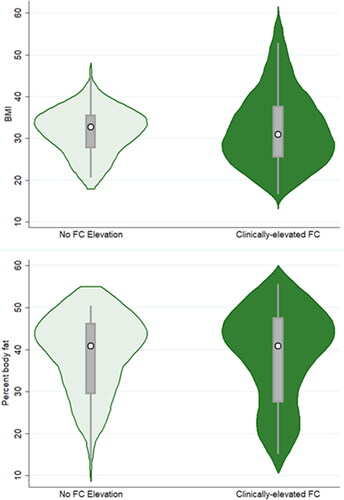
Odds of clinically-elevated FC levels were not significantly related to either participant BMI or %BF ( and ; ). The only significant variable in the analyses was participant age, with the odds of elevated FC concentrations increasing with age (BMI model aOD = 1.05, 95%CI = 1.01–1.10, p = 0.019; %BF model aOD = 1.04, 95%CI = 1.0003–1.08, p = 0.048).
Figure 2. Violin plots depicting BMI (top graph) and percent body fat (bottom graph) for participants exhibiting non-elevated vs clinically-elevated faecal calprotectin levels. The white circle marks the group median, the box indicates interquartile range, with whiskers extending to the upper and lower-adjacent values. Overlaid shape reflects the probability density of the data at different BMI or percent body fat values.
Objective 3: Associations between H. pylori infection status and adiposity measures
Unexpectedly, testing positive for H. pylori infection was associated with lower BMI and %BF measurements (BMI model B = −3.70, 95%CI = −7.04 – (−0.26)), p = 0.031; %BF model B = −3.47, 95%CI = −6.77 – (−0.17), p = 0.040) (; ). Participant sex was also significantly associated with the adiposity measures, with women exhibiting higher BMI and %BF measurements (BMI model B = 7.62, 95%CI = 4.27–11.0, p < 0.001; %BF model B = 16.4, 95%CI = 13.1–19.7, p < 0.001). Finally, age was significantly and negatively associated with the adiposity measures in the BMI model (B = −0.13, 95%CI = −0.24 – (−0.02), p = 0.024). No other variables were significantly related to odds of infection.
Figure 3. Violin plots depicting BMI (top graph) and percent body fat (bottom graph) for participants exhibiting negative vs positive Helicobacter pylori test results. The white circle marks the group median, the box indicates interquartile range, with whiskers extending to the upper and lower-adjacent values. Overlaid shape reflects the probability density of the data at different BMI or percent body fat values.
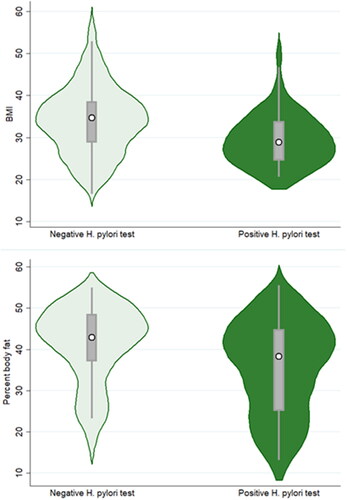
Table 4. Linear regression models assessing associations between H. pylori infection status and measures of body composition.
Discussion
These findings provide partial support for the study predictions. As expected, higher BMI and %BF measures were linked with higher odds of elevated CRP concentrations. However, no significant relationships were identified between the adiposity measures and FC levels, and H. pylori infection was, unexpectedly, associated with lower BMI and %BF values. These mixed findings highlight the complex relationship between adiposity levels and various markers and health conditions linked with inflammation. Interestingly, the two measures of adiposity used exhibited mostly consistent patterns, suggesting that these variables are capturing similar patterns in this context and one measure may be sufficient in the future to test hypotheses related to inflammation-adiposity relationships. Conversely, the results for the two inflammation measures did not appear to be significantly related, suggesting that they may reflect physiologically distinct inflammatory processes. Similarly, H. pylori infection status was not significantly related to either inflammation measure, suggesting that while these important health markers may all be shaped by environmental factors common in low-resource contexts, the resulting inflammatory pathways appear to be independent of one another. These compounding health issues may ultimately lead to worse outcomes and a dual burden of disease in these contexts. This lack of consistency supports the premise that using multiple measures of inflammation and related health conditions – reflecting different facets of inflammatory immune activity – is required to clarify the complex ways by which adiposity may be related to various aspects of immune function and infections characterised by elevated inflammation.
Objective 1: C-reactive protein and adiposity measures - a positive association
As expected, higher adiposity levels were significantly related to higher odds of elevated CRP concentrations. It should be noted that measured adiposity was generally high in this sample, meaning that higher adiposity levels in this context reflect only the “normal” to “overweight/obese” range of adiposity. Still, this pattern is consistent with other studies indicating that high CRP levels are strongly associated with BMI, %BF, and other measures typically linked with poor metabolic health (Aronson et al. Citation2004; Choi et al. Citation2013; Cohen et al. Citation2021; Florez et al. Citation2006; McDade et al. Citation2021; Pettersson-Pablo et al. Citation2020; Vahdat et al. Citation2012). This relationship has been attributed to the role adipose tissue plays as an important regulator of inflammation, including producing proinflammatory cytokines like TNF-α and IL-6 (which stimulate CRP production in the liver) (Aronson et al. Citation2004; Cohen et al. Citation2021; Florez et al. Citation2006; McDade et al. Citation2021; Vahdat et al. Citation2012). Importantly, elevated CRP levels may cause collateral tissue damage and contribute to health disparities in low-resource and minoritised communities (Furman et al. Citation2019; McDade et al. Citation2021). Previous work has documented higher CRP levels in individuals who identify as Black/African American or Hispanic (McDade et al. Citation2021; Ranjit et al. Citation2007). These findings have been attributed in part to higher obesity rates (Goosby et al. Citation2016; McDade et al. Citation2021), predisposing vulnerable communities for elevated CRP and related long-lasting poor health outcomes.
Objective 2: Faecal calprotectin and adiposity measures - no clear association
Some previous studies have documented evidence for a link between weight loss and reduced FC levels (Kant et al. Citation2013), and it has been suggested that localised inflammation variation may be related to changes in gut microbiota composition (Verdam et al. Citation2013). Yet, no associations between FC and the adiposity measures were evident in the present study. It is perhaps unsurprising that FC elevation was not linked with the adiposity measures, given that this is a localised intestinal marker that may be relatively unaffected by more systemic factors (like overall adiposity) and may instead be largely shaped by intestinal infections (Cepon-Robins et al. Citation2022, Citation2023).
Objective 3: H. pylori infection status and adiposity measures – an inverse relationship
Unexpectedly, lower BMI and %BF values were linked with H. pylori infection. A large body of evidence suggests that H. pylori and obesity exhibit a positive relationship, such that H. pylori infected individuals are more likely to exhibit high levels of adiposity (Baradaran et al. Citation2021; Chen et al. Citation2018; Jiang et al. Citation2022; Kamarehei and Mohammadi Citation2022; Xu et al. Citation2019). This relationship is typically attributed to the impact of infection on adiposity, such as hormone dysregulation that alters appetite and increases food intake (Abdullahi et al. Citation2008; Arslan et al. Citation2009; Jiang et al. Citation2022; Kamarehei and Mohammadi Citation2022; Xu et al. Citation2019). However, some studies have documented an inverse relationship between individual adiposity levels and H. pylori infection status, with H. pylori infected individuals displaying lower adiposity levels, as was documented here. This pattern has been attributed to infection-related painful symptoms (e.g. gastric ulcers) and changes in appetite or satiety that decrease (rather than increase) caloric intake (Azuma et al. Citation2002; Cho et al. Citation2005; Ioannou et al. Citation2005; Lender et al. Citation2014; Moran-Lev et al. Citation2017). It has also been suggested that H. pylori infection may shift energy allocation to an increased investment in host immune activity in the form of inflammation, potentially leading to growth deficits and weight loss (Franceschi et al. Citation2014; Khosravi et al. Citation2015).
Still, H. pylori infection should not be viewed as a strategy to prevent obesity. Infection may instead contribute to malnutrition risk and has been linked with severe negative health outcomes in some cases, including some gastric cancers (Blaser and Falkow Citation2009; Fuenmayor-Boscán et al. Citation2020; Polk et al. Citation2010). Helicobacter pylori infection may also reflect health inequities related to socioeconomic factors more broadly, as evidence clearly indicates that H. pylori spread and initial infection occurs most often in low-resource communities characterised by crowded living conditions and inadequate sanitation infrastructure (Arslan et al. Citation2009). Thus, H. pylori infection risk may be greatest in low-resource U.S. households and severe inflammatory infections may compound existing health inequities.
Long-term health implications and future research directions
As discussed above, each of the measures included in the present study may contribute to widespread health disparities in the U.S. In combination with rising obesity rates, the high levels of inflammation and infection characterised by elevated inflammation documented here may substantially impact long-term wellbeing. More work is needed – ideally using longitudinal data – to clarify the frequency and duration of these robust inflammatory responses among individuals living in low-resource communities. Further analyses are also required to test the impact of infections other than H. pylori (e.g. intestinal parasites) and additional chronic conditions that may trigger inflammatory immune responses and affect body composition. Future research should additionally consider how experienced stigma may shape associations between obesity and inflammation. More work is also needed to test interactions between resource access (e.g. to proper nutrition and medical care), adiposity levels, and infection risks in shaping inflammation and related health patterns across the life course. This research could help identify the root causes of common health inequities, thereby informing the design of more effective intervention measures.
While the current study focused on adults, preliminary REACH study results indicate that high rates of inflammation in these communities may begin early in life, and may be due in part to infections characterised by elevated inflammation. For instance, data collected from 24 children in the Mississippi Delta documented high levels of intestinal inflammation, as indicated by FC (Cepon-Robins et al. Citation2022). Most children (80%) exhibited clinically-elevated FC concentrations, rates much higher than those documented in similarly-aged children from other high-income countries or from Indigenous Ecuadorian children (Cepon-Robins et al. Citation2022). Clear signs of intestinal parasites and bacteria have also been documented in the Mississippi Delta (Cepon-Robins et al. Citation2022, Citation2023; Gildner and Cepon-Robins Citation2023), and analyses suggest these infections may be linked with elevated FC levels (Cepon-Robins et al. Citation2022, Citation2023). These intestinal infections may cause tissue damage (e.g. through bacterial colonisation and parasite feeding behaviors) that directly trigger localised inflammation, with implications for host energetics and body composition (Cepon-Robins et al. Citation2022; Gildner et al. Citation2022). Resulting persistent localised inflammation could in turn elevate the risk of developing more serious chronic health issues later in life (e.g. certain cancers), contributing to poor intestinal health and prevalent health inequities well-documented in low-resource predominantly Black communities (Blackburn and Lively Citation2020; Butt et al. Citation2020; Hotez Citation2008).
While cross-sectional in nature, the high prevalence of inflammation documented among both children and adults in this community suggest that these inflammatory immune responses are widespread and likely persistent. High rates of inflammation among younger participants is especially concerning, as this pattern may foreshadow future chronic health conditions as these individuals grow older. An additional future research avenue could be to assess how high-levels of inflammation directly contribute to physiological and functional decline during ageing, leading to tissue damage that triggers a cycle of further inflammation in a phenomenon called “inflammaging” (McDade et al. Citation2021). It is therefore apparent that the impacts of inflammation – whether linked with adiposity or widespread infections – shape both current and future health patterns, at all life stages. Cumulatively, limited resource-access and infrastructure neglect in challenging environmental contexts may act to increase the risk of both obesity and pathogen exposure, with implications for inflammatory responses, changes in body composition, and future disease risk.
Study limitations and strengths
This study has several important limitations. First, the analyses relied on simplistic measures of adiposity (BMI and %BF). While these measures are commonly used in public health research, they do not directly capture important aspects of individual body composition (e.g. fat distribution) (Frankenfield et al. Citation2001; Nevill et al. Citation2006); we were therefore unable to account for potentially elevated inflammation levels linked specifically with visceral adiposity. Additional work testing links between adiposity levels and various inflammatory markers is needed using more precise measures of body composition (e.g. DEXA). Moreover, only two direct measures of inflammation (CRP and FC) and one infection characterised by elevated inflammation (H. pylori infection) were included. We also cannot say definitively whether study participants who tested positive for H. pylori were symptomatic. Although many participants in the present study reported intestinal distress, these symptoms may have been linked with other infections present in the area (e.g. parasitic worms).
The data used were also cross-sectional. It is therefore not possible to definitively determine the directionality of the significant relationships observed between the adiposity measures and markers related to inflammation (i.e. whether adiposity precedes inflammation or vice versa). Longitudinal data are also needed to clarify whether the documented high rates of FC and CRP concentrations are short-lived, acute spikes (likely caused by temporary infections) or whether they are indicative of longer-lasting, chronic inflammation (likely caused by persistent infection or altered physiological responses linked with high adiposity levels). Finally, the study sample was relatively small and focused on adults. Future research using larger samples that include child and/or adolescent participants is warranted to assess associations between adiposity and inflammatory markers across the life course.
Still, despite these limitations, the present study is one of the first to assess multiple levels of inflammation – influenced by structural factors such as resource access and local infrastructure – and a common infection characterised by elevated inflammation in relation to widely used adiposity measures in low-resource U.S. communities. These patterns were also assessed in a predominantly non-white sample, a limitation in many other studies (Aronson et al. Citation2004), thereby providing insights into how complex, bidirectional associations between adiposity and inflammation may influence health inequities within minoritised populations.
Conclusions
This study assessed links between two measures of adiposity (BMI and %BF), various inflammation-related measures (systemic inflammation linked with CRP elevation, localised inflammation reflected by clinically-elevated FC concentrations), and a bacterial infection linked with inflammation in two low-resource U.S. communities experiencing both relatively high pathogen exposure risks and environmental factors related to increased obesity risk. These living conditions may increase the risk of both infectious and chronic health conditions, contributing to elevated rates of inflammation and increased risk for infections characterised by elevated inflammation that may impact body composition; the use of multiple inflammatory markers and infection measures may help disentangle these complex patterns. Study results indicate adiposity levels exhibit the expected positive relationship with odds of systemic inflammation (as indicated by elevated CRP concentrations), but are not significantly related to localised intestinal inflammation (as indicated by FC levels). Contrary to many other studies that have documented a positive relationship between H. pylori infection and adiposity levels, H. pylori infection in the present study was unexpectedly associated with lower BMI and %BF values.
These inconsistent findings suggest associations between adiposity levels and inflammation vary by population and are based on the inflammation marker or infection measure used, the location of the inflammatory response, and the likely cause of that inflammation. Specifically, given that BMI and %BF do not specify location of adipose tissue, these measures may better capture systemic links between adiposity and inflammation, potentially related to underlying changes in physiology as adipose levels increase. In addition, conditions linked with inflammation – such as H. pylori infection – may reflect changes in adiposity associated with experienced illness symptoms (e.g. changes in appetite and satiety, anorexia related to gastric pain) or changes in host energetics. More work in needed to better establish these patterns. Clarifying links between adiposity and various inflammatory pathways in diverse contexts will help establish how rising global obesity rates may shape long-term health outcomes and inequities, with implications for the design of more effective intervention programs, particularly in vulnerable low-resource communities experiencing high rates of both infectious disease and chronic health conditions.
This article was submitted to the Human Metabolism & Physiology section of AHB for which one of the authors is the Section Editor. The Section Editor recused themselves from handling this article and it was assigned to another AHB Editor for independent and anonymous peer-review. In no way was this author involved in the editorial process for this article.
Disclosure statement
No potential conflict of interest was reported by the author(s).
Data availability statement
The complete de-identified dataset is available upon reasonable request on the Rural Embodiment and Community Health website (REACHResearch.org) under the Data Sharing/Contact Us tab.
Additional information
Funding
References
- Abdelaal M, Le Roux CW, Docherty NG. 2017. Morbidity and mortality associated with obesity. Ann Transl Med. 5 (7):161–161. doi: 10.21037/atm.2017.03.107.
- Abdullahi M, Annibale B, Capoccia D, Tari R, Lahner E, Osborn J, Leonetti F, Severi C. 2008. The eradication of helicobacter pylori is affected by body mass index (BMI). Obes Surg. 18 (11):1450–1454. doi: 10.1007/s11695-008-9477-z.
- Alexopoulos N, Katritsis D, Raggi P. 2014. Visceral adipose tissue as a source of inflammation and promoter of atherosclerosis. Atherosclerosis. 233 (1):104–112. doi: 10.1016/j.atherosclerosis.2013.12.023.
- Alvehus M, Burén J, Sjöström M, Goedecke J, Olsson T. 2010. The human visceral fat depot has a unique inflammatory profile. Obesity (Silver Spring)). 18 (5):879–883. doi: 10.1038/oby.2010.22.
- Amuna P, Zotor FB. 2008. Epidemiological and nutrition transition in developing countries: impact on human health and development: the epidemiological and nutrition transition in developing countries: evolving trends and their impact in public health and human development. Proc Nutr Soc. 67(1):82–90. doi: 10.1017/S0029665108006058.
- Aronson D, Bartha P, Zinder O, Kerner A, Markiewicz W, Avizohar O, Brook GJ, Levy Y. 2004. Obesity is the major determinant of elevated C-reactive protein in subjects with the metabolic syndrome. Int J Obes Relat Metab Disord. 28 (5):674–679. doi: 10.1038/sj.ijo.0802609.
- Arslan E, Atilgan H, Yavaşoğlu I. 2009. The prevalence of helicobacter pylori in obese subjects. Eur J Intern Med. 20 (7):695–697. doi: 10.1016/j.ejim.2009.07.013.
- Azuma T, Suto H, Ito Y, Muramatsu A, Ohtani M, Dojo M, Yamazaki Y, Kuriyama M, Kato T. 2002. Eradication of Helicobacter pylori infection induces an increase in body mass index. Aliment Pharmacol Ther. 16(Suppl. 2):240–244. doi: 10.1046/j.1365-2036.16.s2.31.x.
- Baradaran A, Dehghanbanadaki H, Naderpour S, Pirkashani LM, Rajabi A, Rashti R, Riahifar S, Moradi Y. 2021. The association between helicobacter pylori and obesity: a systematic review and meta-analysis of case–control studies. Clin Diabetes Endocrinol. 7 (1):15. doi: 10.1186/s40842-021-00131-w.
- Blackburn CC, Lively M. 2020. Poverty and neglected tropical diseases in the American Rural South. Lanham (MD): Lexington Books.
- Blackwell AD, Snodgrass JJ, Madimenos FC, Sugiyama LS. 2010. Life history, immune function, and intestinal helminths: trade-offs among immunoglobulin E, C-reactive protein, and growth in an Amazonian population. Am J Hum Biol. 22 (6):836–848. doi: 10.1002/ajhb.21092.
- Blaser MJ, Falkow S. 2009. What are the consequences of the disappearing human microbiota? Nat Rev Microbiol. 7(12):887–894. doi: 10.1038/nrmicro2245.
- Brewis A, SturtzSreetharan C, Wutich A. 2018. Obesity stigma as a globalizing health challenge. Global Health. 14 (1):20. doi: 10.1186/s12992-018-0337-x.
- Butt J, Blot WJ, Shrubsole MJ, Waterboer T, Pawlita M, Epplein M. 2020. Differences in antibody levels to H. Pylori virulence factors VacA and CagA among African Americans and Whites in the Southeast USA. Cancer Causes Control. 31 (6):601–606. doi: 10.1007/s10552-020-01295-z.
- Bygbjerg IC. 2012. Double burden of noncommunicable and infectious diseases in developing countries. Science. 337(6101):1499–1501. doi: 10.1126/science.1223466.
- Campeotto F, Butel MJ, Kalach N, Derrieux S, Aubert-Jacquin C, Barbot L, Francoual C, Dupont C, Kapel N. 2004. High faecal calprotectin concentrations in newborn infants. Arch Dis Child Fetal Neonatal Ed. 89 (4):F353–F355. doi: 10.1136/adc.2002.022368.
- Cepon-Robins TJ, Gildner TE, Schrock J, Eick G, Bedbury A, Liebert MA, Urlacher SS, Madimenos FC, Harrington CJ, Amir D, et al. 2019. Soil-transmitted helminth infection and intestinal inflammation among the Shuar of Amazonian Ecuador. Am J Phys Anthropol. 170 (1):65–74. doi: 10.1002/ajpa.23897.
- Cepon-Robins TJ, Liebert MA, Gildner TE, Urlacher SS, Colehour AM, Snodgrass JJ, Madimenos FC, Sugiyama LS. 2014. Soil-transmitted helminth prevalence and infection intensity among geographically and economically distinct Shuar communities in the Ecuadorian Amazon. J Parasitol. 100 (5):598–607. doi: 10.1645/13-383.1.
- Cepon-Robins TJ, Mallott EK, Recca IC, Gildner TE. 2022. Exploring biocultural determinants of intestinal health: do resource access and parasite exposure contribute to intestinal inflammation among a preliminary sample of children in rural Mississippi? Am J Biol Anthropol. 182(4):606–619. doi: 10.1002/ajpa.24574.
- Cepon-Robins TJ, Mallott EK, Recca IC, Gildner TE. 2023. Evidence and potential drivers of neglected parasitic helminth and protist infections among a small preliminary sample of children from rural Mississippi. Am J Hum Biol. 35 (7):e23889. doi: 10.1002/ajhb.23889.
- Chen L, Xu W, Lee A, He J, Huang B, Zheng W, Su T, Lai S, Long Y, Chu H, et al. 2018. The impact of helicobacter pylori infection, eradication therapy and probiotic supplementation on gut microenvironment homeostasis: an open-label, randomized clinical trial. EBioMedicine. 35:87–96. doi: 10.1016/j.ebiom.2018.08.028.
- Cho I, Blaser MJ, François F, Mathew JP, Ye XY, Goldberg JD, Bini EJ. 2005. Helicobacter pylori and overweight status in the United States: data from the Third National Health and Nutrition Examination Survey. Am J Epidemiol. 162(6):579–584. doi: 10.1093/aje/kwi237.
- Choi J, Joseph L, Pilote L. 2013. Obesity and C-reactive protein in various populations: a systematic review and meta-analysis. Obesity Rev. 14 (3):232–244. doi: 10.1111/obr.12003.
- Chong B, Jayabaskaran J, Kong G, Chan YH, Chin YH, Goh R, Kannan S, Ng CH, Loong S, Kueh MTW, et al. 2023. Trends and predictions of malnutrition and obesity in 204 countries and territories: an analysis of the Global Burden of Disease Study 2019. eClinicalMedicine. 57:101850. doi: 10.1016/j.eclinm.2023.101850.
- Cohen E, Margalit I, Shochat T, Goldberg E, Krause I. 2021. Markers of chronic inflammation in overweight and obese individuals and the role of gender: a cross-sectional study of a large cohort. J Inflamm Res. 14(February):567–573. doi: 10.2147/JIR.S294368.
- D’Incà R, Dal Pont E, Di Leo V, Ferronato A, Fries W, Vettorato MG, Martines D, Sturniolo GC. 2007. Calprotectin and lactoferrin in the assessment of intestinal inflammation and organic disease. Int J Colorectal Dis. 22(4):429–437. Springer: doi: 10.1007/s00384-006-0159-9.
- Denis GV, Sebastiani P, Bertrand KA, Strissel KJ, Tran AH, Slama J, Medina ND, Andrieu G, Palmer JR. 2018. Inflammatory signatures distinguish metabolic health in African American women with obesity. PloS One. 13(5):e0196755. doi: 10.1371/journal.pone.0196755.
- Dunachie S, Chamnan P. 2019. The double burden of diabetes and global infection in low and middle-income countries. Trans R Soc Trop Med Hyg. 113(2):56–64. doi: 10.1093/trstmh/try124.
- Egusquiza RJ, Blumberg B. 2020. Environmental obesogens and their impact on susceptibility to obesity: new mechanisms and chemicals. Endocrinology. 161 (3):bqaa024. doi: 10.1210/endocr/bqaa024.
- Fagerberg UL, Lööf L, Merzoug RD, Hansson L-O, Finkel Y. 2003. Fecal calprotectin levels in healthy children studied with an improved assay. J Pediatr Gastroenterol Nutr. 37(4):468–472. doi: 10.1097/00005176-200310000-00013.
- Florez H, Castillo-Florez S, Mendez A, Casanova-Romero P, Larreal-Urdaneta C, Lee D, Goldberg R. 2006. C-reactive protein is elevated in obese patients with the metabolic syndrome. Diabetes Res Clin Pract. 71 (1):92–100. doi: 10.1016/j.diabres.2005.05.003.
- Fontana L, Christopher Eagon J, Trujillo ME, Scherer PE, Klein S. 2007. Visceral fat adipokine secretion is associated with systemic inflammation in obese humans. Diabetes. 56 (4):1010–1013. doi: 10.2337/db06-1656.
- Franceschi F, Annalisa T, Teresa DR, Giovanna D, Ianiro G, Franco S, Viviana G, Valentina T, Riccardo LL, Antonio G. 2014. Role of helicobacter pylori infection on nutrition and metabolism. World J Gastroenterol. 20 (36):12809–12817. doi: 10.3748/wjg.v20.i36.12809.
- Frankenfield DC, Rowe WA, Cooney RN, Smith JS, Becker D. 2001. Limits of body mass index to detect obesity and predict body composition. Nutrition. 17 (1):26–30. doi: 10.1016/S0899-9007(00)00471-8.
- Fuenmayor-Boscán A, Hernández-Rincón I, Arismendi-Morillo G, Mengual E, Rivero Z, Romero G, Lizarzábal M, Álvarez-Mon M. 2020. Changes in the severity of gastric mucosal inflammation associated with helicobacter pylori in humans coinfected with intestinal helminths. Indian J Gastroenterol. 39(2):186–195. doi: 10.1007/s12664-020-01023-0.
- Furman D, Campisi J, Verdin E, Carrera-Bastos P, Targ S, Franceschi C, Ferrucci L, Gilroy DW, Fasano A, Miller GW, et al. 2019. Chronic inflammation in the etiology of disease across the life span. Nat Med. 25(12):1822–1832. doi: 10.1038/s41591-019-0675-0.
- Gildner TE, Cepon-Robins TJ, Urlacher SS. 2022. Cumulative host energetic costs of soil-transmitted helminth infection. Trends Parasitol. 38 (8):629–641. doi: 10.1016/j.pt.2022.04.007.
- Gildner TE, Cepon-Robins TJ. 2023. Rural embodiment and community health: an anthropological case study on biocultural determinants of tropical disease infection and immune system development in the USA. Curr Trop Med Rep. 10 (1):26–39. doi: 10.1007/s40475-023-00282-z.
- Gildner TE, Elizabeth K, Mallott A, Zhang S, Waimon JB, Thomas KL, Nemeth A, Shing TJ. Cepon-Robins 2023. Rural Embodiment and Community Health (REACH) study: testing associations between environmental exposures and intestinal health in low-resource U.S. communities. Am J Biol Anthropol. 180(S75):63.
- Gisbert JP, McNicholl AG. 2009. Questions and Answers on the Role of Faecal Calprotectin as a Biological Marker in Inflammatory Bowel Disease. Dig Liver Dis. 41(1):56–66. Elsevier: doi: 10.1016/j.dld.2008.05.008.
- Goosby BJ, Cheadle JE, McDade T. 2016. Birth weight, early life course BMI, and body size change: chains of risk to adult inflammation? Soc Sci Med. 148:102–109. doi: 10.1016/j.socscimed.2015.11.040.
- Grigg JB, Sonnenberg GF. 2017. Host-microbiota interactions shape local and systemic inflammatory diseases. J Immunol. 198 (2):564–571. doi: 10.4049/jimmunol.1601621.
- Guh DP, Zhang W, Bansback N, Amarsi Z, Birmingham CL, Anis AH. 2009. The incidence of co-morbidities related to obesity and overweight: a systematic review and meta-analysis. BMC Public Health. 9 (1):88. doi: 10.1186/1471-2458-9-88.
- Hestvik E, Tumwine JK, Tylleskar T, Grahnquist L, Ndeezi G, Kaddu-Mulindwa DH, Aksnes L, Olafsdottir E. 2011. Faecal calprotectin concentrations in apparently healthy children aged 0-12 years in Urban Kampala, Uganda: a community-based survey. BMC Pediatr. 11(1):9. doi: 10.1186/1471-2431-11-9.
- Hotez PJ. 2008. Neglected infections of poverty in the United States of America. PLoS Negl Trop Dis. 2 (6):e256. doi: 10.1371/journal.pntd.0000256.
- Hotez PJ. 2013. NTDs V.2.0: ‘blue marble health’—neglected tropical disease control and elimination in a shifting health policy landscape. PLoS Negl Trop Dis. 7(11):e2570. doi: 10.1371/journal.pntd.0002570.
- Hotez PJ. 2018. The rise of neglected tropical diseases in the ‘new Texas’. PLoS Negl Trop Dis. 12 (1):e0005581. doi: 10.1371/journal.pntd.0005581.
- Ioannou GN, Weiss NS, Kearney DJ. 2005. Is Helicobacter pylori seropositivity related to body mass index in the United States? Aliment Pharmacol Ther. 21(6):765–772. doi: 10.1111/j.1365-2036.2005.02369.x.
- Jackson SE, Llewellyn CH, Smith L. 2020. The obesity epidemic–nature via nurture: a narrative review of high-income countries. SAGE Open Med. 8:2050312120918265. doi: 10.1177/2050312120918265.
- Jiang Y, Huang L, Zhou L. 2022. Association between obesity and helicobacter pylori infection. Nutr Clin Métabolisme. 36(3):210–216. doi: 10.1016/j.nupar.2022.07.003.
- Kamarehei F, Mohammadi Y. 2022. The effect of helicobacter pylori infection on overweight: a systematic review and meta-analysis. Iran J Public Health. 51(11):2417–2424. doi: 10.18502/ijph.v51i11.11159.
- Kant P, Fazakerley R, Hull MA. 2013. Faecal calprotectin levels before and after weight loss in obese and overweight subjects. Int J Obes (Lond)). 37(2):317–319. doi: 10.1038/ijo.2012.38.
- Keirns NG, Keirns BH, Tsotsoros CE, Layman HM, Stout ME, Sciarrillo CM, Emerson SR, et al. 2023. The acute inflammatory effects of weight stigma: an experimental pilot study. Stigma Health. doi: 10.1037/sah0000487.
- Khosravi Y, Seow SW, Amoyo AA, Chiow KH, Tan TL, Wong WY, Poh QH, Sentosa IMD, Bunte RM, Pettersson S, et al. 2015. Helicobacter pylori infection can affect energy modulating hormones and body weight in germ free mice. Sci Rep. 5(1):8731. doi: 10.1038/srep08731.
- Kovesdy CP, Furth SL, Zoccali C. 2017. Obesity and kidney disease: hidden consequences of the epidemic. J Bras Nefrol. 39(1):1–10. doi: 10.5935/0101-2800.20170001.
- Lender N, Talley NJ, Enck P, Haag S, Zipfel S, Morrison M, Holtmann GJ. 2014. Associations between H elicobacter pylori and obesity‐an ecological study. Aliment Pharmacol Ther. 40(1):24–31. doi: 10.1111/apt.12790.
- Lynn MK, Morrissey JA, Conserve DF. 2021. Soil-transmitted helminths in the USA: a review of five common parasites and future directions for avenues of enhanced epidemiologic inquiry. Curr Trop Med Rep. 8 (1):32–42. doi: 10.1007/s40475-020-00221-2.
- Mathieu P, Poirier P, Pibarot P, Lemieux I, Després J-P. 2009. Visceral obesity. Hypertension. 53(4):577–584. doi: 10.1161/HYPERTENSIONAHA.108.110320.
- McClendon J, Chang K, Boudreaux MJ, Oltmanns TF, Bogdan R. 2021. Black-White racial health disparities in inflammation and physical health: cumulative stress, social isolation, and health behaviors. Psychoneuroendocrinology. 131 (September):105251. doi: 10.1016/j.psyneuen.2021.105251.
- McDade TW, Burhop J, Dohnal J. 2004. High-sensitivity enzyme immunoassay for C-reactive protein in dried blood spots. Clin Chem. 50(3):652–654. doi: 10.1373/clinchem.2003.029488.
- McDade TW, Meyer JM, Koning SM, Harris KM. 2021. Body mass and the epidemic of chronic inflammation in early mid-adulthood. Soc Sci Med. 281:114059. doi: 10.1016/j.socscimed.2021.114059.
- Mcdade TW, Tallman PS, Madimenos FC, Liebert MA, Cepon TJ, Sugiyama LS, Snodgrass JJ. 2012. Analysis of variability of high sensitivity C-reactive protein in lowland Ecuador reveals no evidence of chronic low-grade inflammation. Am J Hum Biol. 24 (5):675–681. doi: 10.1002/ajhb.22296.
- McDade TW, Williams S, Snodgrass JJ. 2007. What a drop can do: dried blood spots as a minimally invasive method for integrating biomarkers into population-based research. Demography. 44(4):899–925. doi: 10.1353/dem.2007.0038.
- Michels N, Van de Wiele T, De Henauw S. 2017. Chronic psychosocial stress and gut health in children: associations with calprotectin and fecal short-chain fatty acids. Psychosom Med. 79(8):927–935. doi: 10.1097/PSY.0000000000000413.
- Moran-Lev H, Lubetzky R, Mandel D, Yerushalmy-Feler A, Cohen S. 2017. Inverse correlation between Helicobacter pylori colonization and pediatric overweight: a preliminary study. Child Obes. 13(4):267–271. doi: 10.1089/chi.2016.0275.
- Muennig P. 2008. The body politic: the relationship between stigma and obesity-associated disease. BMC Public Health. 8 (1):128. doi: 10.1186/1471-2458-8-128.
- Multhoff G, Molls M, Radons J. 2012. Chronic inflammation in cancer development. Front Immunol. 2:98. doi: 10.3389/fimmu.2011.00098.
- Nevill AM, Stewart AD, Olds T, Holder R. 2006. Relationship between adiposity and body size reveals limitations of BMI. Am J Phys Anthropol. 129 (1):151–156. doi: 10.1002/ajpa.20262.
- Olafsdottir E, Aksnes L, Fluge G, Berstad A. 2002. Faecal calprotectin levels in infants with infantile colic, healthy infants, children with inflammatory bowel disease, children with recurrent abdominal pain and healthy children. Acta Paediatr. 91 (1):45–50. doi: 10.1111/j.1651-2227.2002.tb01638.x.
- Pearson TA, Mensah GA, Alexander RW, Anderson JL, Cannon RO, Criqui M, Fadl YY, Fortmann SP, Hong Y, Myers GL, et al. 2003. Markers of inflammation and cardiovascular disease: application to clinical and public health practice: a statement for healthcare professionals from the Centers for Disease Control and Prevention and the American Heart Association. Circulation. 107(3):499–511. doi: 10.1161/01.cir.0000052939.59093.45.
- Pepys MB, Hirschfield GM. 2003. C-reactive protein: a critical update. J Clin Invest. 111(12):1805–1812. doi: 10.1172/JCI200318921.
- Pérez LM, Pareja-Galeano H, Sanchis-Gomar F, Emanuele E, Lucia A, Gálvez BG. 2016. Adipaging’: ageing and obesity share biological hallmarks related to a dysfunctional adipose tissue. J Physiol. 594(12):3187–3207. doi: 10.1113/JP271691.
- Pettersson-Pablo P, Cao Y, Bäckström T, Nilsson TK, Hurtig-Wennlöf A. 2020. Body fat percentage and CRP correlates with a composite score of vascular risk markers in healthy, young adults - The Lifestyle, Biomarkers, and Atherosclerosis (LBA) study. BMC Cardiovasc Disord. 20(1):77. doi: 10.1186/s12872-020-01376-6.
- Polk D, Brent RM. Peek 2010. Helicobacter pylori: gastric cancer and beyond. Nat Rev Cancer. 10(6):403–414. doi: 10.1038/nrc2857.
- Popkin BM, Adair LS, Ng SW. 2012. Global nutrition transition and the pandemic of obesity in developing countries. Nutr Rev. 70 (1):3–21. doi: 10.1111/j.1753-4887.2011.00456.x.
- Ranjit N, Diez-Roux AV, Shea S, Cushman M, Ni H, Seeman T. 2007. Socioeconomic position, race/ethnicity, and inflammation in the multi-ethnic study of atherosclerosis. Circulation. 116(21):2383–2390. doi: 10.1161/CIRCULATIONAHA.107.706226.
- Romero-Corral A, Somers VK, Sierra-Johnson J, Thomas RJ, Collazo-Clavell ML, Korinek J, Allison TG, Batsis JA, Sert-Kuniyoshi FH, Lopez-Jimenez F. 2008. Accuracy of body mass index in diagnosing obesity in the adult general population. Int J Obes (Lond)). 32(6):959–966. doi: 10.1038/ijo.2008.11.
- Schipper HS, Prakken B, Kalkhoven E, Boes M. 2012. Adipose tissue-resident immune cells: key players in immunometabolism. Trends Endocrinol Metab. 23(8):407–415. doi: 10.1016/j.tem.2012.05.011.
- Swinburn BA, Caterson I, Seidell JC, James WPT. 2004. Diet, nutrition and the prevention of excess weight gain and obesity. Public Health Nutr. 7(1a):123–146. doi: 10.1079/phn2003585.
- Tchernof A, Després J-P. 2013. Pathophysiology of human visceral obesity: an update. Physiol Rev. 93:359–404. doi: 10.1152/physrev.00033.2011.
- Thompson AL, Nicholas KM, Watson E, Terán E, Bentley ME. 2020. Water, food, and the dual burden of disease in Galápagos, Ecuador. Am J Hum Biol. 32 (1):e23344. doi: 10.1002/ajhb.23344.
- Tomiyama A, Janet D, Carr EM, Granberg B, Major E, Robinson AR, Sutin A. Brewis 2018. How and why weight stigma drives the obesity ‘epidemic’ and harms health. BMC Med. 16 (1):123. doi: 10.1186/s12916-018-1116-5.
- Urlacher SS, Ellison PT, Sugiyama LS, Pontzer H, Eick G, Liebert MA, Cepon-Robins TJ, Gildner TE, Snodgrass JJ. 2018. Tradeoffs between immune function and childhood growth among Amazonian forager-horticulturalists. Proc Natl Acad Sci USA. 115(17):E3914–E3921. doi: 10.1073/pnas.1717522115.
- Vahdat K, Azizi F, Zandi K, Assadi M, Nabipour I. 2012. Chronic inflammation is correlated with percentage of body fat independent of the burden of infection. Inflammation. 35(4):1322–1329. doi: 10.1007/s10753-012-9445-6.
- Verdam FJ, Fuentes S, de Jonge C, Zoetendal EG, Erbil R, Greve JW, Buurman WA, de Vos WM, Rensen SS. 2013. Human intestinal microbiota composition is associated with local and systemic inflammation in obesity. Obesity (Silver Spring)). 21(12):E607–E615. doi: 10.1002/oby.20466.
- Woolcott OO, Bergman RN. 2018. Relative fat mass (RFM) as a new estimator of whole-body fat percentage ─ a cross-sectional study in American Adult individuals. Sci Rep. 8(1):10980. doi: 10.1038/s41598-018-29362-1.
- World Health Organization. 2000. Obesity: preventing and managing the global epidemic : report of a WHO consultation. Geneva (Switzerland): World Health Organization.
- World Health Organization. 2023. Obesity. https://www.who.int/health-topics/obesity.
- World Obesity Federation. 2023. World obesity atlas 2023. https://s3-eu-west-1.amazonaws.com/wof-files/World_Obesity_Atlas_2023_Report.pdf.
- Xu X, Li W, Qin L, Yang W, Yu G, Wei Q. 2019. Relationship between helicobacter pylori infection and obesity in Chinese adults: a systematic review with meta-analysis. PloS One. 14(9):e0221076. doi: 10.1371/journal.pone.0221076.