
ABSTRACT
As classroom diversity increases across educational domains, additional stress is placed on instructors to provide effective and personalised learning experiences. Formative assessments can inform instructors of learning differences between student cohorts and individual students, allowing adaptation of learning experiences to individual student needs. This work is motivated by the need for faculty to implement formative assessment strategies, such that instructors can adapt the classroom-assessment environment by identifying learning goals, categorising or tagging assessment questions by learning goal categories, and organising the assessment data by tag. This paper summarises how tag-organised assessment (TOA) may be implemented and visualised to facilitate formative assessment strategies. We validated our TOA approach by interviewing instructors on needs in classroom-assessment environments and the usefulness of TOA visualisations to address assessment needs. Instructors perceived TOA visualisations as beneficial for synchronising learning goals with assessment coverage, improving student feedback, and communicating learning goals and success criteria to students.
Introduction
The origination of adaptive teaching coincides with the artificial intelligence movement. One might assume that today’s undergraduate pedagogical and assessment practices have been implemented to leverage its capabilities for scalable and individualized learning practices – it is perceivable that today’s undergraduate pedagogical and assessment practices are designed to deliver individualized learning experiences. However, to date, many higher education institutions continue to defer to classic lecture-based models and traditional assessment metrics built around quality assurance as opposed to quality enhancement when educating and assessing their students. Through these models, several hundred students are subjected to the same educational experience despite learner variance (Conole and Warburton Citation2005; Ikwumelu, Oyibe, and Oketa Citation2015). Much scholarly work has already been devoted to analyzing STEM teaching best practices (Antepohl and Herzig Citation1999; Ebner and Holzinger Citation2007; Hadim and Esche Citation2002; Hall et al. Citation2002; Hsieh and Knight Citation2008; Mason, Shuman, and Cook Citation2013; Mills and Treagust Citation2003; Toto and Nguyen Citation2009; Yadav et al. Citation2011), we will not discuss those trends here, instead we will focus on higher education STEM assessment that has shown in its own right to be a critical catalyst for student learning and relates to increased pressure on higher education institutions to measure and track learning outcomes more formally and where student enrolment, domestic and international, is as high as it has ever been (Altbach, Reisberg, and Rumbley Citation2019; Brown, Bull, and Pendlebury Citation1997; Farrer Citation2002; Laurillard Citation2002).
The increased pressure for meaningful assessment also contributes to providing personalised student learning experiences. This pressure, combined with a trend of steadily increasing student enrolment, sets the stage for unique issues in scaling ordinarily effective assessment protocols to serve larger classrooms and more diverse student bodies (Kawas and Wong Citation2019; Killpack and Melón Citation2016). Furthermore, it has been shown that intrinsic student factors, such as prior knowledge and experiences among other attributes, can profoundly affect the efficacy of an educational program (Ikwumelu, Oyibe, and Oketa Citation2015). One solution aimed at addressing the pedagogical issue of increased student diversity is the use of formative assessment to inform and implement adaptive teaching practices (Barana, Fissore, and Marchisio Citation2020; Park and Lee Citation2003).
Formative assessment is an effective way to improve student achievement, but is difficult to implement
Formative assessment is widely understood to be a positive influence on student learning, empowering instructors to track student progress and activating self-regulated learning in students (Black and Wiliam Citation2006; Yan et al. Citation2021). An assessment is formative if assessment information is fed back within an educational system and used to improve the system (i.e. forming the direction of improvement) (Wiliam and Thompson Citation2008). The benefits of formative assessment are well documented, and has been shown to be one of the most effective and cost efficient ways to improve student achievement (Black and Wiliam Citation2006; Wiliam Citation2010).
Despite the benefits, formative assessment is not easy for instructors to implement, and the actual adoption of formative assessments in classrooms has been shown to be unsatisfactory (Yan et al. Citation2021). There are several documented factors that affect instructor intentions to implement formative assessment. Some key factors are an instructor’s attitude towards formative assessment, an instructor’s self-efficacy or perceived control over performing formative assessment, and an instructor’s level of formative assessment education and training (Yan et al. Citation2021). Instructors are more willing to implement formative assessment if they are confident in their ability to implement it and have developed the formative assessment skills and knowledge. Thus, there is a need to facilitate the adoption of formative assessment strategies such that instructors will be more confident and require less training to implement formative assessment in their classrooms.
Computer-based assessments and learning management systems can address issues of scale in formative assessment and adaptive teaching.
Data collection and assessment protocols associated with adaptive teaching and learning environments have been viewed as difficult to maintain in large student populations where the demand for individualized student accommodation becomes too high (Dagger, Wade, and Conlan Citation2005; De Bra et al. Citation2003; Eklund and Sinclair Citation2000; Ikwumelu, Oyibe, and Oketa Citation2015; Westwood Citation2018); however and perhaps to our benefit, adaptive teaching and learning has its historical roots in computer-based assessment (Carbonell Citation1970; Conole and Warburton Citation2005; E. F. Taylor Citation1968; J. F. Rockhart, Morton, and Zannetos Citation1970) which are viewed by many as solutions to addressing issues in scaling education practices to serve large and diverse learner populations. These computer-based learning management systems (LMSs) are advantageous because they can automatically analyze and visualise useful course data for instructors and students (Ihantola Citation2011; Kosowski, Małafiejski, and Noinski Citation2007; Swacha and Baszuro Citation2013; Thomas Citation2009). This innovation allows instructors to easily identify individual student performance metrics, adapt instruction methods, and suggest complementary resources from digital data.
Tagging is a powerful organisational tool for digital learning resources
In any learning system, efficient time usage by the instructor is important. The extra time and cognitive cost to implement formative assessment and adaptive teaching practices makes efficient resource usage especially important in formative assessment methods, especially as student population increases (Ikwumelu, Oyibe, and Oketa Citation2015; Yan et al. Citation2021). Tagging digital assessment materials can be used to organise student performance information, allowing instructors to quickly access information in each tag category. This tag-organised assessment (TOA) has been used before in other contexts and for other purposes, and has been shown to be very effective in organising information (Balakrishnan Citation2018; Brooks, Biala, and Arbour Citation2018; Francavilla Citation2018; Gorissen, van Bruggen, and Jochems Citation2015; Ruebel and Galloway Citation2013). Problems can be categorised in many ways, including amount of structure, complexity, and domain specificity (Jonassen Citation2000). Assessment material may be grouped into categories across many dimensions (i.e. course concepts, assessment type, content difficulty, etc.) (Jonassen Citation2000), and labelling course content with tags associated with relevant categories allows for automated and isolated analyses of student performance in individual categories.
Furthermore, tagging assessments with specific knowledge (i.e. skills and concepts) needed to solve each question can identify student misconceptions regarding each learning outcome, including course-relevant skills and concepts. Understanding student misconceptions is useful for formatively adapting course content to improve student learning in several STEM fields (Foroushani Citation2019; Neidorf et al. Citation2020; Qian and Lehman Citation2017). By tagging knowledge content, student misconceptions can be identified at individual student and cohort levels, and can be used to adapt curricula, pedagogy, or assessment to address each identified misconception. The ability for TOA to identify outcome-specific misconceptions makes TOA a powerful tool for implementing outcomes-based assessment.
Learning outcomes and outcomes-based assessment approaches have implications for curriculum design, teaching, learning and assessment, as well as accreditation assurance (Biggs and Tang Citation2011). Tracking learning outcomes and monitoring outcome attainment can help answer questions as to what, who, how, where and when we teach and assess (Keshavarz Citation2011); however, learning outcomes can be perceived as too broad to be measurable across a suite of courses, so many courses will define course-level learning outcomes that lead to program-level learning outcomes. The mapping of course-level outcomes to program-level outcomes is a common practice (Premalatha Citation2019). Additionally, many fields have created concept inventories of specific concepts and skills that focus on specific concepts or skills in a field (Shuman, Besterfield-Sacre, and McGourty Citation2005). Concept inventories involve asking the student multiple questions about a concept combined with other concepts to develop a model of combined concepts that the student understands and where understanding breaks down, i.e. temperature versus energy in a thermodynamics course (Prince, Vigeant, and Nottis Citation2012). In a similar way, tag-organised assessment leverages the use of multiple questions related to a tag, or concept, in combination with other concepts or skills to measure a more nuanced performance related to understanding. A TOA approach can help to operationalise learning-outcomes based assessments in courses that use digital assessments and learning management systems.
Intuitive data visualisation of TOA may serve to improve usability in the classroom
In education, most research on student learning visualisation has targeted instructors and educational institutions as users (Dawson Citation2010; Dawson and Bakharia Citation2010; Graf et al. Citation2011; Vatrapu et al. Citation2011), while visualising individual student achievement is less focused on (Arroyo et al. Citation2007; Falakmasir et al. Citation2012; Long and Aleven Citation2011; Zhang and Almeroth Citation2010). TOA visualisations can be used to present cohort and individual student data to instructors and learners to inform their teaching and learning respectively. However, a major TOA limitation is the increased complexity of performance data as TOA divides a single performance metric into many tag-specific performance metrics. Thus, instructors and students may have a more difficult time using or understanding TOA data than the relatively simple non-organised performance scores. Developing intuitive TOA visualisations for instructors and students may serve to improve TOA usability, facilitating TOA understanding by students and instructors and alleviating a barrier to instructor TOA adoption.
A need for customizable tag-oriented assessment tools with data visualizations for instructors
In this study, a tagging system was developed and implemented using LMS data to create a detailed class performance profile for relevant skills and concepts assessed in the course. To do this, an inventory of course-relevant skills and concepts was developed to use in course assessment question tagging. Each assessment question was tagged with skills and conceptual knowledge needed to answer the question correctly. Tag-organised performance was calculated from student performance data and was visualised to show individual student and class average performance data for each tag. We hypothesise that tag-organised performance facilitates formative assessment strategies and improves adaptive teaching because teachers can use TOA to understand specific student misconceptions. Teachers can then subsequently adapt their instruction and assessment practices to meet student needs.
Theoretical background
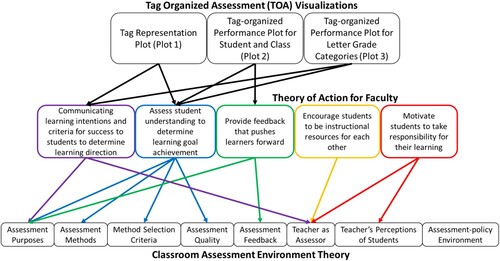
Some engineering concept misconceptions exist due to a lack of mental frameworks for concepts or conceptual areas. While many learning theories apply to misconceptions, this study applies two learning theories, Classroom Assessment Environment Theory by Brookhart (Brookhart Citation1997) and The Theory of Action for Faculty by Wiliam and Thompson (Citation2008).
The theoretical framework by Brookhart (Brookhart Citation1997) synthesises two different bodies of literature: the classroom assessment environment literature and social-cognitive theories of learning and motivation. Brookhart, postulates that in any class, the classroom assessment environment is played out in repeated classroom assessment events, activity segments with associated expectations and assessments (Brookhart Citation1997). Within a classroom assessment event, a teacher communicates to students through assignments, activities, and feedback on performance, and students respond according to their perceptions of these learning opportunities and their perceived efficacy to accomplish the tasks. Therefore, the classroom assessment environment concept offers a way to integrate individual (students) and group (a class with one teacher) aspects of effort and achievement into one theoretical framework. In this theoretical framework, classroom assessment environments can be described and distinguished across 8 dimensions: (1) Assessment purposes, (2) methods used to assess achievement, (3) criteria used in selecting assessment methods, (4) assessment quality, (5) assessment feedback, (6) the teacher as an assessor, (7) teacher’s perceptions of students, and (8) assessment-policy environment (Brookhart Citation1997). By evaluating these assessment environment dimensions for individual classrooms, instructor needs and areas of improvement can be identified for instructors to build better learning environments for their students and ensure that student needs are being met.
To address the need for faculty role in assessment, the framework of William and Thompson (2008) can be applied as a theory of action for guiding the faculty role in assessment feedback. Assessment purposes can be categorised as summative assessment to describe and communicate student performance, formative assessment to be fed back into and improve the classroom in some way related to learning, or assessment for learning to directly support the learning of the students. The Theory of Action for Faculty calls for instructors to use formative assessment and assessment for learning to engineer an effective learning environment. Formative assessment and assessment for learning are conceptualised as consisting of five key strategies: (1) To clarify and share learning intentions and criteria for success to determine student learning directions; (2) To elicit evidence of students’ understanding (assessment) in order to determine learning goal achievement; (3). To provide feedback that pushes learners forward; (4) To encourage students to be instructional resources for one another; and (5) To motivate students to take responsibility for their learning (Wiliam and Thompson Citation2008).
Our study’s conceptual framework connects The Classroom Assessment Environment theory and the Theory of Action for Faculty by treating an instructor’s classroom assessment environment as a system that can be improved with the five formative assessment strategies from The Theory of Action for Faculty. The five formative assessment strategies can be used to engineer a better assessment environment for the classroom that promotes learning and adapts course content to address student needs. In the present study, the focus is on instructors, as actors, using TOA to facilitate the first three formative assessment strategies to improve their classroom assessment environments. This study further probes the connection between the classroom assessment environment and formative assessment strategies by gleaning instructor perspectives through interviews.
Methodology
Research questions
In this paper, the following research questions are addressed:
How can we visualise tagged assessment data and display actionable metrics to instructors based on direct assessment such that instructors can easily understand and act upon the information?
What do higher education STEM faculty cite as needs or challenges in their classroom assessment environments and how do these needs connect the Theory of Action for Faculty with the Classroom Assessment Environment Theory?
How do STEM instructors describe how tag organised assessment can be used to facilitate formative assessment and address needs in their classroom assessment environments?
Implementing TOA to bioengineering course data
Sample and course context
The data visualisations that were the basis of this study were formed from student data from a sophomore level biomedical engineering course at a large land-grant institution within the United States of America. This course was a core course in the biomedical engineering curriculum, and most of the students were bioengineering majors at the university. The dataset consisted of data collected from 63 students who consented to have their data used in this project. The course teaches mass, energy, and momentum conservation principles in bioengineering and is an introduction to analyzing systems for bioengineering applications. As bioengineering majors, the students in this course have prior experience in calculus, introductory molecular and cellular biology, and general chemistry from the university.
Course design
PrairieLearn, a newly developed LMS, was used to administer course assessments, grade course assessments, and collect TOA data for this study (PrairieLearn, Citationn.d.). PrairieLearn is an education platform that allows course instructors to write their questions in html, python, or JavaScript code. This gives the platform flexibility in assessment question design and automatic assessment grading, and the platform was designed as a computer-based testing platform (West, Herman, and Zilles Citation2015). PrairieLearn also allows for question parameter randomisation.
Six homework assignments, six quizzes, and three exams were converted from paper assessments to PrairieLearn assessments created for the class, composed of a total of 70 assessment questions. 63 of the questions were numerical entry questions and 7 questions were multiple choice.
After the course was offered, the PrairieLearn course material was converted to TOA by applying descriptive tags to each question. Tags were chosen based on the concept knowledge and skills the course instructor believed were needed for students to succeed in the course. The tag list was also cross-checked with a second faculty member who formerly taught the course and a former course teaching assistant to ensure tag relevance. A total of 62 tags were created (Supplementary Table S2), and 43 of those tags were represented in the PrairieLearn course after question tagging (). These 43 tags included 3 unit tags specifying the three units in the course, 9 skill tags, 30 concept tags, and a ‘multiple choice’ tag to identify multiple choice questions. Cumulatively 374 tags were assigned across all questions for an average of 5.27 tags per question. Across all students and questions, there was a total of 4,344 average question scores derived from a total of 14,503 question submissions.
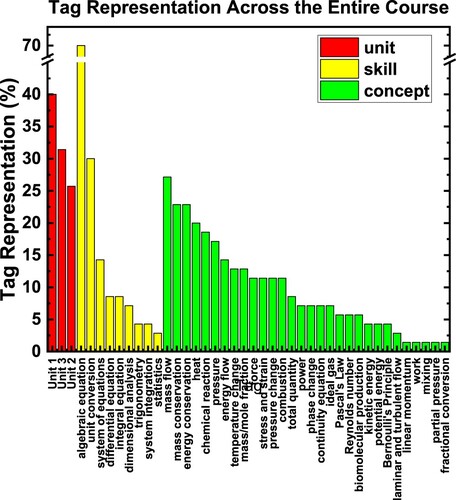
Figure 1. Skill and concepts vary widely in the amount represented in the course. The total usage of each tag displayed as percentage of all questions answered during the course.
Toa data analysis and visualization
PrairieLearn provides a data export capability for assessment details for individual students and individual assessments. These exported files contain the question submission scoring and tag labelling which was used to compute tag representation and tag-organised performance. A MATLAB script was constructed to (A) mine performance data and question tags and then (B) use mined data to compute tag representation for the course and tag-organised performance for students, letter-grade cohorts, and the entire class. Tag representation for each tag was calculated as the percentage of all assessment questions that contained the corresponding tag. Individual student tag-organised performance for each tag was calculated as the unweighted mean of the corresponding student’s percentage scores for all assessment questions that were labelled with the corresponding tag. Cohort tag-organised performance for a specific tag was calculated as the unweighted mean of the tag organised performance measures for all students in the cohort.
In order to distinguish the skills and concepts that the course assessments focus on, the total number of questions labelled by each tag was grouped into units, skills, and concepts. Then each group was sorted in order of decreasing tag count and visualised as a bar graph ().
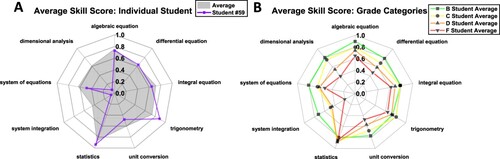
Mean tag score for each skill was visualised as a radar plot for the class as a whole ((A)), as well as for different performance levels defined by the A, B, C, D, and F letter-grade thresholds for average question score ((B)). A-students score from 90–100%, B-students from 80–89.9%, C-students from 70–79.9%, D-students from 60–69.9%, and F-students below 60%. Average skill performance data was also included for an average performing student in order to show how individual students can be compared to the class average for each skill tag.
Figure 2. Tag-organised performance of individual students, the entire class, and letter-grade specific cohorts can be used to identify student misconceptions. (A) Average student performance for the 9 analytically relevant skills. The skill performance of a student is also displayed with the average as an example of applying this visualisation to compare individual student performance with the overall class performance. (B) Average student performance at different letter grades, defined by thresholds set for the average question performance metric. A-students score from 90-100%, B-students from 80-89.9%, C-students from 70-79.9%, D-students from 60-69.9%, and F-students below 60%.
Interview of STEM instructors to gather assessment needs and evaluate TOA effectiveness
Interviews with instructors from a variety of institutions in STEM courses were conducted in order to gain perspectives on what goals exist in the instructional space and which were not currently being met. In addition, these interviews provided a reference to identify the usability and applications of TOA visualisations in the classroom for instructors ().
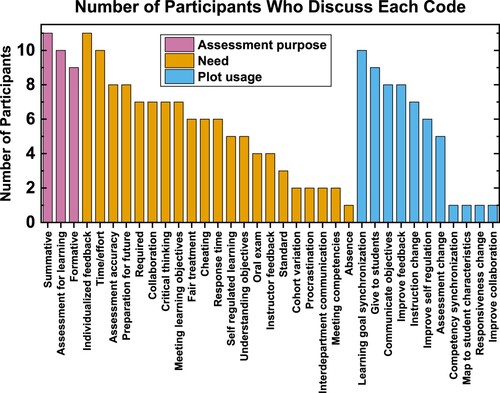
Figure 3. Interview coding informs instructor needs, assessment purposes, and TOA usability. This figure shows the number of participants who have discussed each interview code. Assessment purpose, instructor need, and TOA plot usage codes were included in this visualisation.
Interview participants
Interviews were conducted with 11 participants, all of which were instructors of higher learning who taught at least one STEM course at a 2-year or 4-year college institution. Participants were selected from attendees at an Assessment Summit (Amos Citation2021) who were interested in being contacted further about advancements and possible participation in assessment-related research added their email address to an interest form. Everyone on that interest form was contacted to request their participation in this interview study. During the interview, each participant was asked to focus on a single course that the participant teaches. Details for each participant and their selected course can be found in .
Table 1. Interview participant information.
Interview design
Each interview had three phases: (1) an exploratory phase in which interview questions were focused on characterising the participant’s classroom assessment environment for a single course that they teach; (2) a TOA evaluation phase in which interview questions were focused on the usefulness and useability of TOA visualisations in the classroom; and (3) an open discussion phase in which the participant could make additional questions and comments and in which the interviewer and participant could discuss openly without being restricted by a script. The full interview script can be found in the supplement.
The exploratory phase of the interview was designed around the Classroom Assessment Environment Theory (Brookhart Citation1997). During this phase, the participant was asked to choose a course to focus on. Then 12 questions were asked to understand the participant’s assessment methods, assessment purposes, assessment feedback, assessment quality criteria, student success criteria, assessment restriction, and information about the participant as an assessor.
During the TOA evaluation phase, participants were shown three TOA data visualisations in succession: A tag representation plot, designated as ‘Plot 1’ (); an individual student and class-wide tag-organised performance plot, designated as ‘Plot 2’ ((A)); and a letter-grade cohort tag-organised performance plot, designated as ‘Plot 3’ ((B)). After showing each visualisation, two open ended questions were asked to understand (1) how the participant perceives the visualisation, and (2) whether or not the participant would use the visualisation in their classroom, and how they would use the visualisation. A question was asked at the end of this section to assess how the participant might use the three visualisations in combination. There was a total of 7 questions in the TOA evaluation section.
The last, free discussion section included only a single question that asked participants if they had any additional questions or comments. In this section, the participant and interviewer had the flexibility to discuss the participant’s questions and comments freely without the guidance of a script.
After the interviews were conducted, they were analyzed to understand each participant’s classroom assessment environment, including the participant’s unmet needs, and to understand the opportunities for TOA visualisations to meet those needs and improve the participants classroom assessment environment.
Codebook development
After instructor interviews were conducted, the codebook was developed and then refined in preliminary coding rounds. The theory of action for faculty (Wiliam and Thompson Citation2008) informed the development of codes related to assessment purpose and needs for instructors. Codes were included to capture the five formative assessment strategies proposed by Wiliam and Thompson (Citation2008) as instructor needs to understand the roles of formative assessment and assessment for learning in the participants’ courses. We also incorporated TOA usage codes corresponding to how participants describe using the TOA plots shown to them, and TOA issue codes, corresponding to complaints participants have with the TOA plots. We also coded for the use of LMSs since TOA can be automated by integrating into an LMS, and we coded for sources of information, external to the course, that instructors use to improve their classroom environment. Example codes from the codebook are shown in .
Table 2. Example codes and sample quotations from the codebook.
Codes were refined through a paired coding process to expand the codebook and achieve intercoder agreement. Preliminary coding passes were done on two interviews by two coders, applying original codes to the transcript, and identifying additional codes to be applied in subsequent coding passes. The coders then repeated the process until acceptable interrater reliability was reached according to a pooled Cohen’s Kappa greater than 0.7 for a reliable data coding process on the developed coding themes ((Banerjee et al. Citation1999; De Vries et al. Citation2008)). After the initial rounds of coding, discrepancies in coding were discussed between the two coders, allowing the definitions of each code and their use cases to be clarified. During this coding process, using a constant comparison method across the multiple interview transcripts, the coders also identified and confirmed any additional theme categories and added them to the framework. Once this was achieved, the finalised codebook (Supplementary Table S3) was used to re-code all interviews.
Interview code records were analyzed by assessing and comparing the number of participants who discuss each code. The participant count for each code was recorded and ranked within each code category. This analysis was used to assess which codes were the most prevalent and important among participants.
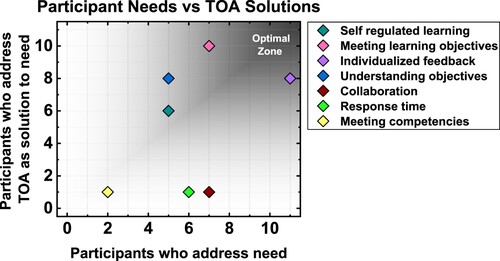
To assess participant perceptions on how useful TOA visualisations are at fulfilling instructor needs, codes in the plot usage category were paired with closely corresponding codes in the instructor needs category. A scatter plot was generated with plot usage code participant count on the vertical axis and instructor need participant count on the horizontal axis.
To assess the usefulness and issues of each TOA visualisation independently, each ‘plot usage’ code instance and ‘issues with visualisations’ code instance was additionally coded for the plot number(s) that the code corresponds to. The participant count for each ‘plot usage’ and ‘issues with visualisations’ code was then compared across plots to assess participant perceptions on the best uses of each TOA plot and issues with each plot that should be addressed.
Results
TOA data was visualised into three useful plots to aid instructors in performing formative assessment strategies. We analyzed what each TOA plot communicates in a sophomore level bioengineering course. We then interviewed higher learning STEM instructors to understand how real TOA users could use it to facilitate formative assessment strategies and improve classroom assessment environments.
Analysis of TOA data from bioengineering course
TOA data was separated into two measures to be used by instructors, tag representation, and tag-organised performance. Tag representation refers to the number of times each tag appears in assessment questions throughout the course. Tag-organised performance refers to the average score of all questions with each tag. Tag-organised performance was calculated for all individual students, the whole class, and letter-grade performance groups.
Tag representation ranked bar plot for skills and concepts show how much each learning goal is assessed throughout the course.
Tag representation information is valuable to instructors as it tells them how much they are assessing each concept or skill in their course. This information can be used to ensure that key course skills and concepts are strongly represented in the assessments. Course tag representation varied widely, from only being present once for a few of the tags to being in 70% of the algebraic equation questions (). The top three represented skills are algebraic equations, unit conversion (30%), and system of equations (15%). Algebraic equations and unit conversion questions dominate as the most focused skills tested while the trigonometry and statistics skills were barely focused on (<5%). The top 6 concepts, each present in more than 15% of the course questions, are mass conservation, energy conservation, mass flow, heat, pressure, and chemical reaction. Five concept tags were only represented once, including linear momentum, work, mixing, partial pressure, and fractional conversion.
Tag-organised performance radar plots for skills show student misconceptions and skill discrepancies between high and low performing students
When class performance is broken down into individual skill performance, strong differences can be seen in class performance for specific skills. The class excelled on statistics questions, scoring 87% on average, while the class struggled on system integration questions, scoring 43% on average ((A)). An average performing student’s (Student #59) skill scores were shown on the same visualisation to compare with the class ((A)). Student #59 performed worse than average on dimensional analysis, system integration, and unit conversion questions, but excelled in trigonometry and statistics questions.
When visualising tag-organised performance for letter grade catagories, more specific information can be gleaned regarding where the most points are being lost and where poor performing students are most struggling ((B)). Skills with overall good course performance show smaller performance gaps between grade levels. For example, Integral equations has a relatively high average score of 72%, and the difference between the B student and F student scores is only 16%. However, for the 43% average system integration questions, the difference between the B student and F student averages is 52%. This shows that skill deficits for low-performing students vary considerably.
Analysis of instructor interviews
To understand how TOA can be used by instructors, we interviewed 11 STEM faculty in higher education regarding their classroom assessment environments, as well as their thoughts on usefulness of TOA data visualisations. Interviews were coded and analyzed to discern how well TOA meets instructor needs and in what ways can TOA be implemented to benefit formative assessment and assessment for learning strategies. Acceptable inter-coder agreement was reached between the two coders with a pooled Cohen’s kappa score of 0.72 for all codes.
Comparing the number of participants who discuss each interview code identifies prevalent instructor needs in classroom assessment environments
We assess the most prevalent codes by comparing each code’s participant count for assessment purpose, participant need, and TOA visualisation usage codes (). Most participants discuss the use of assessments for learning and formative assessments in addition to summative assessments, demonstrating that the set of study participants rely on assessments to improve student learning and further develop their courses. Instructors commonly discuss using assessment for learning to help students practice and master learning goals. One participant reinforced this idea by describing assessment as ‘a learning opportunity, and not just ‘This is what you don’t know’’. Additionally, participants discuss using assessment for learning to help students self-regulate their learning and understand where they should allocate their time. For example, an instructor stated, ‘The biggest thing is for us to make sure that students know where they need to put more time in on the material so hopefully the assessment report … is enough to let the student understand where they need to spend more time.’ Also, instructors commonly discuss using formative assessment to discover and address student misconceptions. A participant reinforces this by describing that ‘the other [use for assessments] is for us to be able to identify misconceptions, so semester by semester if we see that our approach to the material isn't … preventing common misdirection of students … we'll change our approach to it … , so that it's less likely to occur in the future.’ Participants also describe using formative assessment to monitor and adapt assessment difficulty and adopt student ideas into course content.
Figure 4. Ensuring that learning objectives are covered in the course and improving student feedback are both highly needed by instructors and highly solvable with TOA visualisations. For the seven instructor need codes for which there is a corresponding plot usage code, the number of participants who discuss each plot usage code was plotted against the corresponding number of participants who discuss each instructor need code. The optimal zone, corresponding with high instructor need and high TOA usability is shown in the upper right corner.
Providing individualized feedback to students is a need for all participants, and participants seek to use individualized feedback to direct student learning and help them address misconceptions. A participant describes that they ‘think what would be really important is being able to provide individual feedback based on the assessments. What went wrong? What were you thinking here? To try to better understand why you got the answer you got so that we could then adjust that right away.’ Also, providing individualized feedback is commonly discussed as an area of improvement in participant courses. A participant demonstrates this need for improvement by saying ‘I sort of wish I could do a better job giving more individualized feedback and it's one of the things that I'm struggling with.’ Providing individualized feedback is difficult for participants to implement in high enrolment courses due to time constraints. One participant supports this by saying, ‘[Feedback] isn't as detailed as we'd like it to be, because we're a small group and we have like a lot of those to do … so it is very difficult to go into the detail that we want.’
Otherwise, the most prevalent participant needs include managing spent time and effort (10 participants), improving student assessment accuracy (8 participants), and preparing students for future classes or careers (8 participants). Participants often wished that they had more time to implement different teaching practices such as giving more individualized instruction to students or administering oral exams. For example, an instructor describes, ‘I wish that [students] could be getting individual attention that I'm confident is accurate. It's like I don't do any oversight onto the homework grading … I just don't feel like I have the bandwidth to do it for a 240-person class.’ Participants also discussed concern over accurately assessing course content. For example, a participant says, ‘Sometimes we thought we were asking one thing and it turns out we were asking something else. It turns out that the hard part of the problem is something that we didn't even realise,’ demonstrating that students might approach questions in ways that are unrelated to learning goals. Participants also discussed the need to prepare students for future classes and careers. For example, a participant stated, ‘So how I prepare my course is actually also determined by what the next step means, be it a course, or a job, or whatever it is.’
In addition, we monitored LMS usage and external sources of formative information. All participants use at least one LMS in their course, including Gradescope (9 participants), PrairieLearn (2 participants), and/or Blackboard (1 participant). Also, the most commonly discussed external source of formative information is baseline performance from other classes or previous semesters, which 4 participants discussed; however, most participants do not discuss reaching outside the classroom for formative information.
Course learning goal coverage and individualized feedback are both highly needed and well addressed by TOA
Coverage of learning objectives and giving students individualized feedback were the only two codes for which most participants discussed the subject as a need and discussed using TOA visualisations to address that need ().
Individualized feedback was discussed by all participants as a need and 8 participants discussed at least one TOA visualisation as a useful aid to improving feedback to students. One participant embodied the need for individualized feedback very well by stating, ‘I wish that every student could get a lot of individual attention. I wish that they could be getting individual attention that I'm confident is accurate.’ There is also a need to discover what feedback is most helpful to individual students, which one participant states by asking, ‘If there's missing feedback, what feedback [does the student] need that I have not seen, that I don't recognise [they] need?’ TOA is discussed by participants to improve assessment feedback and alleviate the concerns instructors have with getting specific and individualized feedback to students.
Ensuring coverage of learning objectives was discussed by 7 participants as a need in the classroom, and 10 participants discussed that the TOA visualisations addressed this need. One participant said that their ‘assessment is kind of all tied back to the learning outcomes in some way, so whether it be like a laboratory exercise, a discussion that they do, a project that they do, it's all tied back to some learning outcome.’ This illuminates the large scope and importance of ensuring learning objective coverage, and TOA was widely considered to be effective at ensuring the intended learning goals for the course are covered in assessments.
Additionally, TOA was also discussed by most participants to be useful for communicating learning objectives to students and improving self-regulated learning; however, only 5 out of 11 participants discussed those needs. Thus, communicating learning objectives to students and improving self-regulated learning are highly addressed by TOA, but less needed by instructors. In contrast, improving response time to students and student collaboration were discussed by most participants as needs, but only one participant discussed using TOA to address each of those needs. This indicates that improving response time to students and improving collaboration were highly needed, but TOA was not seen as effective to address those needs. Overall TOA is perceived to address important instructor needs, and we next investigated how specific TOA visualisations addressed those needs.
Participants reveal complementary uses of the three TOA visualisations
Participants perceived each TOA plot as having complementary usage potential in the classroom. Most participants discussed using the tag representation plot (Plot 1, ) to ensure learning objectives are covered in course assessments (). A participant described that the tag representation plot would be helpful to see ‘if the amount of weight I put in the assessments matches my … internal idea of … how much importance I assigned to each concept.’ Another participant discussed that using the plot for ‘keeping track of whether you are over-teaching something or over-focusing on something is really helpful.’
Figure 5. Participants reveal complementary usability of TOA visualisations. The number of participants who discuss each coded plot usage is displayed. Plot usage codes which were discussed by one or less participants were omitted in this graph.
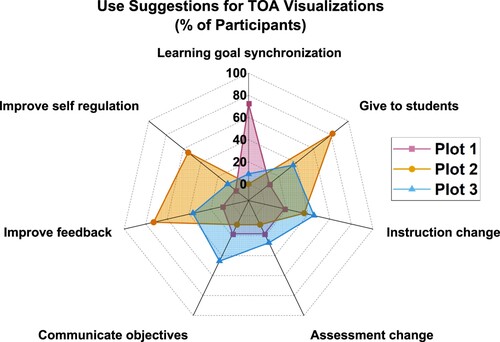
The individual student and course average tag performance plot (Plot 2, (A)) was discussed by most participants as a useful student resource as well as a tool to improve student feedback and self-regulated learning. Participants discussed using the plot to direct and target feedback to the whole class and to individual students. A participant states that, to understand what feedback a student needs, the plot would help them with ‘finding out where they were struggling more so than if they were struggling, this would actually probably fix that problem for me.’ Participants also discussed giving individualized tag-organised performance plots to students as a learning aide, as well as for students to know how to better invest their time during studying. For example, a participant discussed that the ‘ … [plot] can help each individual student. And you can see [the plot] actually being filled in as the semester's going, so they can actually know where they need a target to get better.’
More participants discussed the use of the letter grade category tag performance plot (Plot 3, (B)) to communicate course objectives to students, improve course assessments, and improve course instruction than for Plot 1 or Plot 2. Plot 3 was not only seen as a tool to communicate objectives, but also to communicate the extent to which each objective is important in the course. For example, one participant stated, ‘I wonder if this would be good for like a beginning of the class. ‘Hey, here's the kind of things we're going to cover. You can see from the previous semester, students had trouble in these areas, so these might be the areas you want to … maybe sit down with a tutor or make an appointment with me.’’
For a minority of participants, tag-organised performance plots were difficult to comprehend, and the tag representation plot had an unappealing appearance.
Most participants did not have issues with the comprehensibility or appearance of TOA visualisations, but there were some concerns worth noting. Four out of the 11 participants found the letter-grade tag-organised performance plot (Plot 3, (B)) confusing or thought the plot would be confusing to communicate to students. Participants described Plot 3 as hard to interpret or draw conclusions from. A participant discusses that ‘Like any plot they handed me about my class, I'd look at it. I don't know what conclusions I can draw from it.’ Another participant discusses that they would avoid showing Plot 3 to students because they ‘think that that's something that they could easily misinterpret and do bad things with’.
In addition, 3 participants had issues with the appearance of the tag representation plot (Plot 1, ). Two participants claim Plot 1 is too busy, which may indicate that there is too much information packed into the plot, while another participant describes the plot as ‘hard to read’. Two participants also had difficulties in comprehending the data displayed, including 1 participant misunderstanding the data as student scores rather than representation of course topics in assessments. Issues with the appearance of Plot 1 may have contributed to participants’ difficulties in comprehending the data displayed. This sentiment is expressed well by 1 participant who states, ‘This is very difficult for at least my audience to get their head around. It's rather busy. I wouldn't use it,’ highlighting the tie between the complicated appearance of the plot and difficulties in understanding for students.
Also, 3 participants found the student and class tag-organised performance plot (Plot 2, (A)) difficult to comprehend for themselves or students. One participant discusses that Plot 2 might encourage students to focus on less important course goals because it doesn’t communicate how important each tag is. The participant cites ‘ … that not everything is equally important or equally weighted for [the students’] understanding of something’. Another participant discusses that Plot 2 might be misleading because questions can have multiple tags, so each measured skill performance could be influenced by the performance of other skills. For example, the participant asked ‘is the ‘unit conversion’ tag really getting unfairly painted? Maybe there is just a ‘unit conversion’ involved in the ‘system integration’ and that's the tag.’ Other TOA visualisation issues were scarce, with 1 participant discussing issues with Plot 3’s appearance and accessibility for low vision students, and no participants discussing issues with Plot 2’s appearance. Constructive feedback helps us understand how we can improve TOA visualisations for instructors and ensure better TOA accessibility.
Discussion
Our study investigates three primary research questions. (1) How can we visualise tagged assessment data and display actionable metrics to instructors based on direct assessment such that instructors can easily understand and act upon the information? (2) What do higher education STEM faculty cite as needs or challenges in their classroom assessment environments and how do these needs connect the Theory of Action for Faculty with the Classroom Assessment Environment Theory? (3) How do STEM instructors describe how tag organised assessment can be used to facilitate formative assessment and address needs in their classroom assessment environments?
To address these research questions, we developed a TOA method to calculate and visualise tag representation in assessments and tag-organised assessment performance. We show that the TOA method can generate useful visualisations pertaining to learning goal representation in assessments, and the tag-organised performance of both cohorts and individual students. We also show that the tag-organised performance data can be used to understand tag-specific performance discrepancies between student cohorts. We then interviewed 11 higher learning STEM instructors and find that instructors perceive TOA as a tool to address several classroom assessment environment needs.
TOA visualisations can address several instructor needs in their classroom assessment environments.
We show that interview participants view TOA visualisations as helpful to address four highly discussed needs in the classroom assessment environment, including (1) ensuring adequate coverage of learning objectives in assessments, (2) improving assessment feedback to students, (3) communicating learning objectives to students, and (4) improving student self-regulated learning. This means that instructors believe TOA is helpful to facilitate both formative assessment and assessment for learning. Thus, implementing TOA is suggested to meet instructor formative needs in the classroom while also serving as a potential learning aid for students.
Tag representation can be used to cover learning goals more accurately in assessments and communicate those goals to students
Similar to Biggs’ constructive alignment principles, where a constructivist approach and instructional deign merge to guide faculty in decisions related to assessments in a classroom (Biggs Citation1996), TOA can be used to promote faculty understanding of assessments and performance on assessments in a course.
The tag representation plot (Plot 1, ) can ensure adequate learning objective coverage in course assessments. Most participants discuss adequate coverage of learning objectives as a need in their classroom, and the tag representation plot was highly discussed as a tool to address this need by allowing instructors to check the plot for adequate assessment learning objective coverage. This gives instructors an easy way to determine if course material must adapt to emphasise different information. Additionally, the instructor will be able to identify out-of-scope assessment material and eliminate it, leaving room for more relevant assessment material that will result in a more accurate summative evaluation of course goals, and better help students learn and assess student learning goal achievement more accurately. Thus, the tag representation plot allows instructors to more accurately assess key learning goals, and more effectively elicit evidence of students’ understanding of those learning goals to determine areas of improvement (the second strategy in the Theory of Action for Faculty (Wiliam and Thompson Citation2008)).
Additionally, by more accurately understanding assessed learning objectives from the tag representation plot, instructors can ensure that success criteria are being accurately communicated to students. Sharing learning intentions and criteria for success to students is also one of the formative assessment success criteria in the Theory of Action for Faculty (Wiliam and Thompson Citation2008), and instructors would benefit by more accurately performing this strategy.
By improving the accuracy at which the first two formative assessment strategies are performed, instructors can impact their classroom assessment environments by refining assessment purposes and methods, improving assessment quality, and improving themselves as assessors (). Assessment purposes and methods in the course may shift context to better match learning goals. Also, the teacher may become a better assessor by being able to better align instructional materials with assessment content, and to be able to better communicate assessment success criteria to students.
Figure 6. TOA can be used to impact a classroom assessment environment by facilitating three strategies in formative assessment and assessment for learning. The five key formative assessment strategies in the Theory of Action for Faculty can then influence dimensions in an instructor’s classroom assessment environment. Arrows indicate TOA’s influence on formative assessment strategies, and the influence of formative assessment strategies on the dimensions of a classroom assessment environment.
Student and class-specific tag-organised performance visualisations empower instructors to improve assessment feedback to students and help students self-regulate their own learning
Interview participants view the tag-organised performance plot (Plot 2, (A)) as a tool to improve feedback to students, to give to students for their own use, and to improve student self-regulated learning. This demonstrates that tag-organised performance can be used as both formative assessment to give targeted student feedback, and as assessment for learning to guide students without additional instructor intervention. Tag-organised performance visualisations also inform instructors of student misconceptions and empower instructors to communicate meaningful feedback to students. Thus tag-organised performance from TOA facilitates two strategies in the Theory of Action for Faculty, namely eliciting evidence of students’ understanding to determine areas of improvement, and providing feedback that pushes learners forward (Wiliam and Thompson Citation2008).
By improving the accuracy at which the second and third formative assessment strategies are performed, instructors can use tag-organised performance to impact their classroom assessment environments by refining assessment purposes and methods, improving assessment quality, adjusting assessment design to account for newly discovered student misconceptions, and to tailor student feedback to individual student needs.
Tag-organised performance for letter grades helps instructors communicate learning goal difficulty to students and control learning goal difficulty by adjusting instruction and assessments
The tag-organised performance plot for letter grade categories (Plot 3, (B)) can be used to communicate learning objectives to students and can serve as formative information to improve course instruction or assessment. We show that the letter grade category plot has a broad range of uses, the most frequent of which, discussed by 5 participants each were communicating course objectives to students, and improving course instruction. Instructors can use this visualisation to communicate course objectives and objective difficulty based on skill discrepancies gleaned from Plot 3. This allows instructors to more easily clarify and share learning intentions and criteria for success to students, fulfilling one of the formative assessment success criteria in the Theory of Action for Faculty (Wiliam and Thompson Citation2008). This allows instructors to better understand and have control over the learning direction for the class.
Additionally, participants claimed that Plot 3 was useful for improving both assessments and instruction. The letter grade-specific data shows which skills and concepts have the largest performance divide between high and low performing students. Instructors can formatively use this information to adapt their instructional materials or their assessments to reduce this divide. Thus instructors can use letter-grade cohort tag-organised performance plots to elicit evidence of students’ understanding to determine areas of improvement at the level of course performance groups, facilitating the second formative assessment strategy of The Theory of Action for Faculty (Wiliam and Thompson Citation2008). By improving the ease at which the first two formative assessment strategies are performed, instructors can use letter-grade-specific tag-organised performance to impact their classroom assessment environments by refining assessment purposes and methods, improving assessment quality, and improving themselves as assessors ().
Overall, TOA visualisations can be used to facilitate three key strategies in formative assessment and assessment for learning which in turn drive improvements in classroom assessment environments
Interview results suggest that the three TOA visualisation presented to participants can influence three out of the five formative assessment strategies from The Theory of Action for Faculty (). By more effectively implementing those assessment strategies, instructors will give more informative and helpful formative assessment and assessment for learning to enhance student learning in the classroom. Furthermore, many assessments can be used both formatively and summatively and both rely on accurate assessment of course goals (Wiliam and Thompson Citation2008). Thus, the enhanced information that TOA provides can benefit summative evaluation as well as formative evaluation.
By influencing formative assessment strategies, TOA can also benefit the classroom assessment environment (). The first strategy in the Theory of Action for Faculty, communicating learning and success criteria to students, can help shape appropriate assessment purposes and benefit the instructor as an assessor as course goals become more strongly connected to assessment content. Assessing student understanding to determine achievement can be fed back into the assessment environment to improve several aspects of assessment design, including improving assessment purposes, methods, and quality such that students perform better and learning goals are more appropriately assessed. Ensuring helpful feedback improves an assessment environment’s assessment feedback dimension and affects assessment purposes as learning through assessment feedback becomes an important assessment purpose. Encouraging student collaboration can improve an instructor’s ability to make and assess teams as instructors understand the types of students that work well together. Motivating students to self-regulate their learning can improve an instructor’s ability to assess self-regulated learning and have a more accurate view of students based on their ability to self-regulate. TOA can positively influence at least six dimensions of a classroom assessment environment by improving three formative assessment strategies.
Improvements can be made to TOA visualisations to make TOA more useful and accessible to STEM instructors
Data visualisations have long been needed to display information clearly, concisely, and meaningfully in the classroom. Our results have shown TOA to be useful for facilitating formative assessment, but by using this data, instructors and students have more metrics to keep track of, making assessment results more complex and increasing cognitive load. Most visualisation designs for any usage context are ineffective (Munzner Citation2014), so identifying appropriate visualisations to convey the most important information clearly and concisely to both instructors is important to reduce this cognitive load.
To visualise tag representation across the entire study, a sorted bar graph was used, displaying tags in order of most represented to least (Plot 1, ). Instructors can use this graph to discern over- or underrepresented subjects in course assessments. Bar plots can be used to visualise many categories of data, with an upper limit of several dozen categories (Munzner Citation2014). Thus, we hypothesised that visualising all unit, skill, and concept tags on a single plot would be appropriate, especially after segmenting data by tag type, and ranking tags along the horizontal axis. However, 3 interview participants complained that the tag representation plot was too busy or hard to read. The tag representation plot communicates representation for all 43 unit, skill, and concept tags, but conveying representation information for all 43 tags in one graph may be too much information to be user friendly for instructors and students. To eliminate data from the plot, tag representation visualisations could be split into skill and concept visualisations separately. This could also be addressed by reducing tag count into a smaller number of more general tags. Adding a filtering functionality to the plot so that instructors can visualise hand-picked tags on demand could also help make the plot less busy and easier to read.
Using radar plots to communicate tagged performance information is both an interesting and clear way to convey the tagged performance information to instructors and students (Plots 2 and 3, ). Radar plots are able to display a large amount of information on one plot, are able to display standards and benchmark values, and provide a standardised view of different indicators on a single scale (Morales-Silva et al. Citation2020). Also Diehl et al. has shown that memorising information on plots with a cartesian coordinate system is easier for elements along the visualisation borders than for interior information, but no such bias was seen for memorising elements by angular position on a radial plot (Diehl, Beck, and Burch Citation2010). Thus, a radar plot is more appropriate than a bar plot to visualise multiple performance measures that should be comprehended equally by the reader.
Participants generally had no complaints about the appearance of the tag-organised performance plot, suggesting that the radar plot format and the level of information displayed was appropriate. However, there were complaints about content comprehensibility. Four interview participants found the letter grade specific tag-organised performance plots hard to interpret or draw conclusions from. Reducing the complexity of the figure by simplifying the performance groups into ‘High performing’ and ‘Low performing’ students may make the plot easier to interpret and give instructors a more clear and straightforward way to see the discrepancies in misconceptions between student cohorts. Three participants discussed the student and class average tag-organised performance plot as being easy to misinterpret. One cited that the skills are not weighted by performance in the course which could misdirect a student to work on an unimportant learning goal. This could be addressed by including weights into the visualisation, itself. Another participant discussed that because tag performance depends on other tags, tag performance could be misleading and a bad score for one tag could be due to student misconceptions in a different tag that appears in the same questions. This is an intrinsic limitation of TOA and is difficult to address in courses with multi-tag questions, but this misinterpretation could be addressed by ensuring that students are well instructed on how to interpret TOA results before giving the visualisations to them in class.
TOA can be automated in an LMS to minimise instructor workload
The tag representation and tag-organised performance measures, shown to participants in Plots 1, 2, and 3 (, (A), and (B) respectively), can all be automatically calculated and visualised from LMS generated assessment data. This means that instructors would be able to look at TOA visualisations immediately after grading assessments with no additional effort. All interview participants discussed managing the time or effort spent in the classroom as a need to be addressed, suggesting a large impact from TOA automation saving instructors’ time. Also, all participants we interviewed used an LMS to manage course assessments, suggesting that many instructors will already have access to LMS assessment data. The COVID-19 pandemic further advanced LMS adoption as well (Kim, Yoon, and Kim Citation2021), and many higher learning institutions have redesigned curricula for full online learning in response to the pandemic (Crawford et al. Citation2020)
An automated TOA tool would also allow instructors to improve response time on TOA informed feedback. Response time for assessment feedback was discussed as a need by 6 of the 11 participants, suggesting that response time improvements from automating TOA visualisations will have a strong impact on the classroom. The development of an automatic TOA tool that uses LMS data is an important step to make TOA an accessible option for instructors to drive formative assessment and assessment for learning in their classroom assessment environments.
Future studies and applications
This technology could be studied further by developing and testing an application that provides real-time calculation and visualisation of TOA data for the instructor and students. This is especially helpful to understand and validate the capacity for TOA to benefit students which was not within the scope of this study. During testing, we would want to focus on the clarity of the visualisations, the cognitive burden on the instructor, and whether the platform provides information that the students and instructors find both relevant and useful. Once the usefulness of TOA data is validated through application, it may then be optimised to help students and instructors by reducing preparation time and subsequent cognitive costs. Furthermore, we hypothesise that TOA can also be used to drive self-regulated learning if provided to students in ‘real-time’ as suggested previously.
If TOA is used during the course, instructors can give personalised instruction to students and recommend resources based on what each student needs. Understanding the exact skills and concept that are giving a student trouble equips students with a more comprehensive understanding of their strengths and weaknesses in the course and will allow the students to better prioritise how to spend their time studying. Average tag performance data can be given to students as well so that students have a relative understanding of their skills and concept knowledge compared to other students. Providing these types of data visualisation to students has been shown effective to facilitate self-assessment, reflection, and planning by giving feedback on the student’s learning and knowledge in other contexts (Brusilovsky et al. Citation2016; Bull and Kay Citation2007).
We propose that tag-organised assessment in the classroom can lead to broader adoption across a curriculum or set of courses with similar outcomes. The TOA approach is similar to other methods to operationalise learning outcomes assessment, such as using rubrics and concept inventories (Shuman, Besterfield-Sacre, and McGourty Citation2005). In a similar way, tag-organised assessment leverages the use of multiple questions related to a tag, or concept, in combination with other concepts or skills to measure a more nuanced performance related to understanding. Additionally, the tag framing allows an instructor to simplify the coding of questions to a single word representing a course concept or skill, which may lead to greater adoption and reduce tagging time.
Also, the TOA method can be used by engineering education researchers to measure other types of student outcomes. While this study’s TOA application only focused on cognitive skills and concepts of relevance to student success as seen by the instructor, TOA can be used to measure and visualise scores associated with self-efficacy, confidence, motivation, and many other factors of student success as long as instruments to measure those outcomes are used in the course. This can make TOA a valuable asset to researchers and instructors who want to measure those outcomes, and TOA should be validated in future studies as a tool to measure and analyze non-cognitive student outcomes.
Limitations
One of the most concerning limitations of TOA is that there is a large initial amount of effort needed to implement it. A course-specific tagging system needs to be developed, and then all the course assessment materials would need to be tagged, requiring a significant amount of time. The development of a quicker and more intuitive method for tagging assessment material would significantly reduce the burdens of this limitation.
In addition, effectively implementing TOA requires that the course assessment material is implemented within an LMS such that TOA analytics can be calculated, and visualisations can be produced from digital assessment data. Performance data will need to be automatically digitised to support the automatic generation and visualisation of tagged performance data. Moving course assessment material to a computer-based system can take a lot of effort, therefore this system may be most easily implemented by instructors who already have their course assessment materials digitised. This is becoming less of a concern in higher learning classrooms as LMS use is becoming very widespread (Al-Nuaimi and Al-Emran Citation2021), and LMS use has greatly accelerated as a response to the COVID-19 pandemic (Crawford et al. Citation2020). Furthermore while some tag-organised analytics are already available in some LMSs such as PrairieLearn (PrairieLearn, n.d.) and Gradescope (Gradescope, Citationn.d.), an external TOA software tool will be needed if an instructor uses an LMS without TOA functionality.
Tag-organised performance is not a perfect measure of a student’s performance of each tag. Questions may have multiple tags, meaning that question tagging is not mutually exclusive and that some tag-specific scores will be dependent on other undesignated tags. It is important to understand the nature and limitations of tag-organised performance scores when using tag-organised performance to adapt teaching and learning.
One of the limitations of the study is that the tags, themselves, are not well organised or categorised other than the much-encompassing skill and concept categories. As tag counts increase, visualisations will involve a higher cognitive load to process. Thus, visualisations need to be organised for a high tag count to display only high-level tags or filtered to display a limited number of relevant tags to generate less overwhelming visualisations.
Conclusions
While formative assessment practices are widely accepted to be beneficial for student learning, adoption of formative assessment strategies has been unsatisfactory due to the attitudes, self-efficacy, and skills regarding formative assessment (Yan et al. Citation2021). We aimed to understand how TOA could facilitate formative assessment strategies by applying TOA to assessment data from a sophomore level bioengineering course, creating visualisations of tag representation and tag-organised performance that an instructor could use for the pilot course, and then we interviewed 11 higher learning instructors in STEM to understand how instructors could use TOA to benefit their classroom assessment environments. We found that STEM instructors perceived TOA as useful to communicate learning goals to students, improve feedback to students, ensure coverage of learning goals in assessments, and to improve student self-regulated learning. This functionality allows instructors to implement three key formative assessment strategies more easily and accurately with TOA, including (1) better communicating learning goals and success criteria to students, (2) eliciting evidence of student understanding to assess learning goal achievement, and (3) providing better feedback to students to push their learning forward. These strategies in turn can improve classroom assessment environments by improving course assessment design, quality, and feedback, and improving the instructor as an assessor. Future work should be performed to validate the effectiveness of TOA in the classroom, show how effective TOA is in other engineering contexts and grade levels, and develop tools to best utilise TOA in ways that most helps instructors and students.
Supplemental Material
Download MS Word (2.2 MB)Disclosure statement
No potential conflict of interest was reported by the author(s).
Data availability statement
The data that support the findings of this study are available on request to the corresponding author. The data are not publicly available due to privacy or ethical restrictions.
Additional information
Funding
Notes on contributors
Colin Castleberry
Dr. Colin Castleberry is a research consultant for the University of Illinois at Urbana Champaign Bioengineering Department under Jennifer Amos and has been a biotechnology researcher at AbbVie for 2 years. Castleberry recently acquired a Ph.D. in Bioengineering from the University of Illinois at Urbana Champaign, where he also completed his Baccalaureate Degree in Bioengineering with Highest Honours and a minor in Chemistry. Castleberry’s research interests are in systems analysis and modelling of biological and educational data to drive research decisions in the medical and educational domains.
Ainsley Hanner
Ainsley Hanner is an undergraduate research assistant entering her third year at the University of Illinois at Urbana-Champaign. She is pursuing a Baccalaureate Degree in Bioengineering, concentrating in Therapeutics, and a minor in Chemistry. Hanner is involved with the Society of Women Engineers’ University of Illinois collegiate section, as well as the Biomedical Engineering Society. Her research areas include modelling of educational data and inquiry into the health literacy of vulnerable populations in Illinois.
Gabriel Burks
Dr. Gabriel Burks is a postdoctoral research associate at University of Illinois at Urbana-Champaign. He is from Louisiana where he also completed his Baccalaureate Degree in Physics with a minor in Chemistry from Grambling State University. Dr. Burks received his doctoral degree from Drexel University in Materials Science & Engineering and was also a National Science Foundation GK-12 STEM Fellow for 3 years, in the School District of Philadelphia. Primary research interests are: (1) synthesis and characterisation of functional polymeric materials, (2) polymer crystallization phenomena, and (3) pedagogical assessment of conventional and nontraditional STEM spaces.
Jennifer Amos
Dr. Jennifer Amos is a Teaching Professor in Bioengineering at the University of Illinois at Urbana-Champaign. She has been designing and implementing assessment and accreditation activities at the university for ten years. She also acted as the Director of Assessment for the Carle Illinois College of Medicine for the past three years. Amos also leads workshops on behalf of ABET, Inc. to present best practices for assessment and evaluation of engineering programs. Her interests are in engineering education, medical education, and assessment and evaluation of STEM projects.
References
- Al-Nuaimi, M. N., and M. Al-Emran. 2021. “Learning Management Systems and Technology Acceptance Models: A Systematic Review.” Education and Information Technologies 26 (5): 5499–5533. doi:10.1007/s10639-021-10513-3.
- Altbach, P. G., L. Reisberg, and L. E. Rumbley. 2019. “Trends in Global Higher Education.” In Global Perspectives on Higher Education. Brill: Sense. doi:10.1163/9789004406155
- Amos, J. R. 2021. Leveraging Tags Within Gradescope for Improved Student Feedback. Oakland, CA: Gradescope User Summit.
- Antepohl, W., and S. Herzig. 1999. “Problem-Based Learning Versus Lecture-Based Learning in a Course of Basic Pharmacology: A Controlled, Randomized Study.” Medical Education 33 (2): 106–113. doi:10.1046/j.1365-2923.1999.00289.x.
- Arroyo, I., K. Ferguson-Walter, J. Johns, T. Dragon, H. Mehranian, D. Fisher, A. Barto, S. Mahadevan, and B. Woolf. 2007. “Repairing Disengagement with Non-invasive Interventions.” Artificial Intelligence in Education 2007: 195–202. https://scholarworks.umass.edu/cs_faculty_pubs/326.
- Balakrishnan, B. 2018. “Motivating Engineering Students Learning via Monitoring in Personalized Learning Environment with Tagging System.” Computer Applications in Engineering Education 26 (3): 700–710. doi:10.1002/cae.21924.
- Banerjee, M., M. Capozzoli, L. McSweeney, and D. Sinha. 1999. “Beyond Kappa: A Review of Interrater Agreement Measures.” Canadian Journal of Statistics 27 (1): 3–23. doi:10.2307/3315487.
- Barana, A., C. Fissore, and M. Marchisio. 2020. “From Standardized Assessment to Automatic Formative Assessment for Adaptive Teaching.” CSEDU 2020 - Proceedings of the 12th International Conference on Computer Supported Education 1: 285–296. doi:10.5220/0009577302850296.
- Biggs, J. 1996. “Enhancing Teaching Through Constructive Alignment.” Higher Education 32 (3): 347–364. doi:10.1007/BF00138871
- Biggs, J., and C. Tang. 2011. Teaching For Quality Learning At University (4th ed.). New York, NY: Open University Press. http://books.google.se/books/about/Teaching_for_Quality_Learning_at_Univers.html?id=XhjRBrDAESkC&pgis=1.
- Black, P., and D. Wiliam. 2006. “Assessment and Classroom Learning.” Assessment in Education: Principles, Policy & Practice 5 (1): 7–74. doi:10.1080/0969595980050102.
- Brookhart, S. M. 1997. “A Theoretical Framework for the Role of Classroom Assessment in Motivating Student Effort and Achievement.” Applied Measurement in Education 10 (2): 161–180. doi:10.1207/s15324818ame1002_4.
- Brooks, S., N. Biala, and S. Arbor. 2018. “A Searchable Database of Medical Education Objectives - Creating a Comparable Gold Standard.” BMC Medical Education 18. doi:10.1186/s12909-018-1136-z.
- Brown, G., J. Bull, and M. Pendlebury. 1997. Assessing Student Learning in Higher Education. London: Routledge.
- Brusilovsky, P., S. Somyurek, J. Guerra, R. Hosseini, V. Zadorozhny, and P. J. Durlach. 2016. “Open Social Student Modeling for Personalized Learning.” IEEE Transactions on Emerging Topics in Computing 4 (3): 450–461. doi:10.1109/TETC.2015.2501243.
- Bull, S., and J. Kay. 2007. “Student Models That Invite the Learner In: The SMILI:() Open Learner Modelling Framework.” International Journal of Artificial Intelligence in Education 17 (2): 89–120. doi:10.1007/s40593-015-0090-8.
- Carbonell, J. R. 1970. “AI in CAI: An Artificial-Intelligence Approach to Computer-Assisted Instruction.” IEEE Transactions on Man Machine Systems 11 (4): 190–202. doi:10.1109/TMMS.1970.299942.
- Conole, G., and B. Warburton. 2005. “A Review of Computer-Assisted Assessment.” Research in Learning Technology 13. doi:10.3402/rlt.v13i1.10970.
- Crawford, J., K. Butler-Henderson, J. Rudolph, B. Malkawi, M. Glowatz, R. Burton, P. A. Magni, and S. Lam. 2020. “1.” Journal of Applied Learning & Teaching 3 (1): 9–28. doi:10.37074/JALT.2020.3.1.7
- Dagger, D., V. Wade, and O. Conlan. 2005. “Personalisation for All: Making Adaptive Course Composition Easy.” Educational Technology & Society 8: 9–25. https://www.jstor.org/stable/jeductechsoci.8.3.9.
- Dawson, S. 2010. “‘Seeing’ the Learning Community: An Exploration of the Development of a Resource for Monitoring Online Student Networking.” British Journal of Educational Technology 41 (5): 736–752. doi:10.1111/j.1467-8535.2009.00970.x.
- Dawson, S., and A. Bakharia. 2010. SNAPP: Realising the Affordances of Real-time SNA within Networked Learning Environments.
- De Bra, P., A. Aerts, B. Berden, and B. Lange. 2003. Escape from the Tyranny of the Textbook: Adaptive Object Inclusion in AHA.
- De Vries, H., M. N. Elliott, D. E. Kanouse, and S. S. Teleki. 2008. “Using Pooled Kappa to Summarize Interrater Agreement Across Many Items.” Field Methods 20 (3): 272–282. doi:10.1177/1525822X08317166.
- Diehl, S., F. Beck, and M. Burch. 2010. “Uncovering Strengths and Weaknesses of Radial Visualizations-an Empirical Approach.” IEEE Transactions on Visualization and Computer Graphics 16 (6): 935–942. doi:10.1109/TVCG.2010.209.
- Ebner, M., and A. Holzinger. 2007. “Successful Implementation of User-Centered Game Based Learning in Higher Education: An Example from Civil Engineering.” Computers & Education 49 (3): 873–890. doi:10.1016/j.compedu.2005.11.026.
- Eklund, J., and K. Sinclair. 2000. “An Empirical Appraisal of the Effectiveness of Adaptive Interfaces for Instructional Systems.” Journal of Educational Technology & Society 3 (4): 165–177. http://www.jstor.org/stable/jeductechsoci.3.4.165
- Falakmasir, M. H., I. H. Hsiao, L. Mazzola, N. Grant, and P. Brusilovsky. 2012. “The Impact of Social Performance Visualization on Students.” Proceedings of the 12th IEEE International Conference on Advanced Learning Technologies, ICALT 2012, 565–569. doi:10.1109/ICALT.2012.218.
- Farrer, S. 2002, November 22. End Short Contract Outrage, MPs Insist. Times Higher Education.
- Foroushani, S. 2019. “Misconceptions in Engineering Thermodynamics: A Review.” International Journal of Mechanical Engineering Education 47 (3): 195–209. doi:10.1177/0306419018754396.
- Francavilla, M. L. 2018. “Learning, Teaching and Writing with Reference Managers.” Pediatric Radiology 48 (10): 1393–1398. doi:10.1007/s00247-018-4175-z.
- Gorissen, P., J. van Bruggen, and W. Jochems. 2015. “Does Tagging Improve the Navigation of Online Recorded Lectures by Students?” British Journal of Educational Technology 46 (1): 45–57. doi:10.1111/bjet.12121.
- Gradescope. (n.d.). Accessed May 30, 2022 https://www.gradescope.com/get_started
- Graf, S., C. Ives, N. Rahman, and A. Ferri. 2011. “AAT.” ACM International Conference Proceeding Series, 174–179. doi:10.1145/2090116.2090145.
- Hadim, H. A., and S. K. Esche. 2002. “Enhancing the Engineering Curriculum Through Project-Based Learning.” Proceedings - Frontiers in Education Conference, F3F-1. doi:10.1109/fie.2002.1158200.
- Hall, S. R., I. Waitz, D. R. Brodeur, D. H. Soderholm, and R. Nasr. 2002. “Adoption of Active Learning in a Lecture-Based Engineering Class.” Proceedings - Frontiers in Education Conference, T2A-9. doi:10.1109/fie.2002.1157921.
- Hsieh, C., and L. Knight. 2008. “Problem-Based Learning for Engineering Students: An Evidence-Based Comparative Study.” The Journal of Academic Librarianship 34 (1): 25–30. doi:10.1016/j.acalib.2007.11.007.
- Ihantola, P. 2011. Automated Assessment of Programming Assignments: Visual Feedback, Assignment Mobility, and Assessment of Students’ Testing Skills.
- Ikwumelu, S. N., O. A. Oyibe, and E. C. Oketa. 2015. “Adaptive Teaching: An Invaluable Pedagogic Practice in Social Studies Education.” Journal of Education and Practice 6 (33): 140–144. http://search.ebscohost.com/login.aspx?direct=true&db=eric&AN=EJ1083517
- Jonassen, D. H. 2000. “Toward a Design Theory of Problem Solving.” Educational Technology Research and Development 48 (4): 63–85. doi:10.1007/BF02300500.
- Kawas, L., and B. Wong. 2019. Race, Ethnicity and Diversity: The Challenges and Opportunities for Lecturers in STEM. Reading: University of Reading.
- Keshavarz, M. 2011. “Measuring Course Learning Outcomes.” Journal of Learning Design 4 (4). doi:10.5204/jld.v4i4.84.
- Killpack, T. L., and L. C. Melón. 2016. “Toward Inclusive STEM Classrooms: What Personal Role do Faculty Play?” CBE—Life Sciences Education 15. doi:10.1187/cbe.16-01-0020.
- Kim, J. J., Y. Yoon, and E. J. Kim. 2021. “A Comparison of Faculty and Student Acceptance Behavior Toward Learning Management Systems.” International Journal of Environmental Research and Public Health 18. doi:10.3390/IJERPH18168570.
- Kosowski, A., M. Małafiejski, and T. Noinski. 2007. Application of an Online Judge & Contester System in Academic Tuition. (Vol. 4823). doi:10.1007/978-3-540-78139-4_31
- Laurillard, D. 2002. Rethinking University Teaching: A Conversational Framework for the Effective Use of Learning Technologies.
- Long, Y., and V. Aleven. 2011. “Lecture Notes in Computer Science.” Lecture Notes in Computer Science (Including Subseries Lecture Notes in Artificial Intelligence and Lecture Notes in Bioinformatics), 6738 LNAI, 179–186. doi:10.1007/978-3-642-21869-9_25.
- Mason, G. S., T. R. Shuman, and K. E. Cook. 2013. “Comparing the Effectiveness of an Inverted Classroom to a Traditional Classroom in an Upper-Division Engineering Course.” IEEE Transactions on Education 56 (4): 430–435. doi:10.1109/TE.2013.2249066.
- Mills, J., and D. Treagust. 2003, December 20. “Engineering Education, Is Problem-Based or Project-Based Learning the Answer.” Australasian Journal of Engineering Education 2003 (3). https://search.informit.org/doi/10.3316/aeipt.132462
- Morales-Silva, D. M., C. S. McPherson, G. Pineda-Villavicencio, and R. Atchison. 2020. “Using Radar Plots for Performance Benchmarking at Patient and Hospital Levels Using an Australian Orthopaedics Dataset.” Health Informatics Journal. doi:10.1177/1460458219895190.
- Munzner, T. 2014. “Visualization Analysis & Design.” Visualization Analysis and Design, 1–397. doi:10.1201/B17511/VISUALIZATION-ANALYSIS-DESIGN-TAMARA-MUNZNER.
- Neidorf, T., A. Arora, E. Erberber, Y. Tsokodayi, and T. Mai. 2020. “IEA Research for Education.” IEA Research for Education 9: 1–10. doi:10.1007/978-3-030-30188-0_1.
- Park, O., and J. Lee. 2003. “Adaptive Instructional Systems.” In Educational Technology Research and Development. Handbook of Research on Educational Communications and Technology, 651–684. London: Routledge.
- PrairieLearn. (n.d.). Accessed May 30, 2022 https://prairielearn.readthedocs.io/en/latest/course/
- Premalatha, K. 2019. “Course and Program Outcomes Assessment Methods in Outcome-Based Education: A Review.” Journal of Education 199 (3): 111–127. doi:10.1177/0022057419854351.
- Prince, M., M. Vigeant, and K. Nottis. 2012. “Development of the Heat and Energy Concept Inventory: Preliminary Results on the Prevalence and Persistence of Engineering Students’ Misconceptions.” Journal of Engineering Education 101 (3): 412–438. doi:10.1002/j.2168-9830.2012.tb00056.x.
- Qian, Y., and J. Lehman. 2017. “Students’ Misconceptions and Other Difficulties in Introductory Programming.” ACM Transactions on Computing Education 18 (1). doi:10.1145/3077618.
- Rockhart, J. F., M. S. S. Morton, and Z. S. Zannetos. 1970. Associative Learning Project-Phase-I System.
- Ruebel, K. K., and D. Galloway. 2013. “Upping the Ante: Video and Tagging Software to Improve Teacher Candidate Performance.” Current Issues in Middle Level Education 18 (2): 8–13. https://www.learntechlib.org/primary/p/39847/.
- Shuman, L. J., M. Besterfield-Sacre, and J. McGourty. 2005. “The ABET “Professional Skills” - Can They Be Taught? Can They Be Assessed?” Journal of Engineering Education 94 (1): 41–55. doi:10.1002/j.2168-9830.2005.tb00828.x.
- Swacha, J., and P. Baszuro. 2013, July 2-5. “Gamification-based e-Learning Platform for Computer Programming Education.” X World Conference on Computers in Education, Toruń, Poland, 122–130.
- Taylor, E. F. 1968. The ELIZA Program: Conversational Tutorial.
- Thomas, M. 2009. “Virtual Learning Environments: Using, Choosing and Developing Your VLE – By Martin Weller.” British Journal of Educational Technology 40 (6): 1152–1153. doi:10.1111/j.1467-8535.2009.01026_11.x.
- Toto, R., and H. Nguyen. 2009. “Flipping the Work Design in an Industrial Engineering Course.” Proceedings - Frontiers in Education Conference, FIE. doi:10.1109/FIE.2009.5350529.
- Vatrapu, R., C. Teplovs, N. Fujita, and S. Bull. 2011. “Towards Visual Analytics for Teachers’ Dynamic Diagnostic Pedagogical Decision-Making.” ACM International Conference Proceeding Series, 93–98. doi:10.1145/2090116.2090129.
- West, M., G. L. Herman, and C. Zilles. 2015. PrairieLearn: Mastery-based Online Problem Solving with Adaptive Scoring and Recommendations Driven by Machine Learning. ASEE Annual Conference and Exposition, Conference Proceedings, 122nd ASEE(122nd ASEE Annual Conference and Exposition: Making Value for Society). http://www.library.illinois.edu/proxy/go.php?url=http://search.ebscohost.com/login.aspx?direct=true&db=edselc&AN=edselc.2-52.0-84941994154&site=eds-live&scope=site
- Westwood, P. 2018. Inclusive and Adaptive Teaching: Meeting the Challenge of Diversity in the Classroom, Second Edition. In Inclusive and Adaptive Teaching: Meeting the Challenge of Diversity in the Classroom, Second Edition. doi:10.4324/9781351061261
- Wiliam, D. 2010. “An Integrative Summary of the Research Literature and Implications for a New Theory of Formative Assessment.” In Handbook of Formative Assessment, edited by H. Andrade, and G. Cizek, 18–40. London: Routledge. doi:10.4324/9780203874851-3.
- Wiliam, D., and M. Thompson. 2008. “The Future of Assessment.” In The Future of Assessment, 53–82. London: Routledge. doi:10.4324/9781315086545-3.
- Yadav, A., D. Subedi, M. A. Lundeberg, and C. F. Bunting. 2011. “Problem-based Learning: Influence on Students’ Learning in an Electrical Engineering Course.” Journal of Engineering Education 100 (2): 253–280. doi:10.1002/j.2168-9830.2011.tb00013.x.
- Yan, Z., Z. Li, E. Panadero, M. Yang, L. Yang, and H. Lao. 2021. “A Systematic Review on Factors Influencing Teachers’ Intentions and Implementations Regarding Formative Assessment.” Assessment in Education: Principles, Policy & Practice 28 (3): 228–260. doi:10.1080/0969594X.2021.1884042.
- Zhang, H., and K. Almeroth. 2010. “Moodog: Tracking Student Activity in Online Course Management Systems.” Journal of Interactive Learning Research 21: 407–429. https://www.learntechlib.org/primary/p/32307/.