
ABSTRACT
The article departs from a unique data set covering 44 villages over the period 2002 to 2013/2015 and finds that polarization in living standards has fallen dramatically, largely based on access to agricultural output markets. Rural differentiation with respect to land access has, however, increased rapidly, showing the importance of contextualizing improvements in living standards in relation to land access. The spatial distribution of these patterns varies greatly. Theoretically, the article shows that perspectives of both differentiation and broad-based growth are relevant for the study of African smallholder agriculture. Market participation in the short term leads to livelihood improvements, but over time enhances differentiation with respect to access to land.
Introduction
For several decades, the debate around African smallholder agriculture has been dominated by two main bodies of scholarship underpinned by opposing theoretical points of departure. Mainstream economic perspectives stress the necessity of transforming smallholder agriculture through expanded commercial opportunities as a way of raising productivity, improving rural livelihoods and addressing poverty (Jayne, Mather, and Mghenyi Citation2010). This scholarship can be contrasted with perspectives arising from heterodox economics as well as critical studies of agrarian change, that emphasize the essentially polarizing role of global capitalism and market linkages (Bernstein Citation2010). Recently, the latter have been questioned by approaches that call for a more open interpretation of the day-to-day lives and struggles of rural populations amid the empirical realities of an agrarian transformation that is not linear or predetermined (Chigumira Citation2018; Hebinck Citation2018; Hebinck, Mtati, and Shackleton Citation2018).
While these latter perspectives prejudice the lived realities, practices and agency of small-scale farmers, recent empirical findings also at the macro level lend credence to the notion that African agriculture is indeed experiencing increasing polarization. Several studies (Jayne, Chamberlin, and Headey Citation2014; Muyanga and Jayne Citation2019) show how an emerging middle class of farmers often based in urban areas has increasingly invested in rural farm land, while average smallholder farm size has decreased in land-constrained countries since the 1970s (Headey and Jayne Citation2014). These debates should be contextualized against a backdrop of rapid, but uneven, economic growth based on agriculture in several African countries (Jayne, Chamberlin, and Benfica Citation2018).
Data from our longitudinal study, the Afrint study, which captures rural livelihood changes from 2002 to 2013, depict an increasing polarization in cultivated farm size with farm sizes actually increasing at the top while remaining stagnant at the bottom of the distribution (Jirström, Archila Bustos, and Alobo Loison Citation2018). Both these findings suggest a large base of rural poor and a small segment of wealthier farmers at the top, or what is referred to as a pyramid-shaped distribution of wealth.
At the level of the village, meanwhile, a substantial scholarship on social and rural differentiation framed by perspectives on de-agrarianization has emerged since the early 1990s (Cousins et al. Citation2018; Olofsson Citation2020; Zamchiya Citation2013) often pointing to the interplay between state policies and market forces as a differentiating factor.
In a recent contribution based on longitudinal village-level data from Tanzania covering the period 1996–2016, Ponte and Brockington (Citation2020) question ‘both accounts of positive transformation and despoliation by capital’ and instead argue that an egg-shaped distribution in wealth is emerging in half of their study sites, with a smaller but persistent base of rural poor, a bulging middle and a small elite at the top. They suggest that a lack of longitudinal data and a lack of attention to assets (rather than short-term consumption measurements) are hampering the analysis of both wealth and poverty distribution in the Tanzanian countryside, while underestimating the role of smallholder agriculture in changing this distribution.
The findings presented by Ponte and Brockington (Citation2020), although not statistically representative, point to the need for supplementary accounts of polarization that nuance national-level findings as well as wholesale accounts of de-agrarianization. While sectorial approaches show increasing inequality based on nationally representative data (Bryceson Citation2019), the spatial distribution of wealth and prosperity as well as poverty and increasing social differentiation may be strongly localized, as suggested also by sub-national examples of intensified agricultural production and growth (Andersson Djurfeldt Citation2013; Andersson Djurfeldt and Djurfeldt Citation2013; Binswanger-Mkhize, McCalla, and Patel Citation2010; Wiggins Citation2000). The growth dynamics of particular sub-sectors in specific places (Haggblade and Hazell Citation2010; Wiggins Citation2005), meanwhile, risks being obscured by macro-level data.
This article departs from Ponte and Brockington’s (Citation2020) discussion and explores village-level patterns of changing living standards and wealth across five African countries, using a longitudinal data set that is representative at the village level. Using an approach inspired by Ponte and Brockington (Citation2020), it seeks to address the question of whether a pointed egg-shaped distribution of prosperity is emerging also in villages in other African countries or if, as suggested by theoretical perspectives inspired by de-agrarianization, rural differentiation is increasing also at the village level. How distributional changes in prosperity are connected to agriculture and whether a similar distribution of land is following such changes are further points of inquiry. The paper hence moves beyond Ponte and Brockington’s (Citation2020) study by using a statistically representative data set to consider wider geographical trends and their linkages to changes in land distribution – an aspect not covered by their contribution.
Theoretical perspectives
The findings are contextualized conceptually in relation to two main bodies of theory. Mainstream perspectives from agricultural economics emphasize the role of smallholder-based agricultural growth as a development route that can redress food security as well as rural poverty and eventually engender a transformation of African agriculture. These perspectives are contrasted with a critical scholarship that instead stresses the differentiating consequences of smallholder-based commercialization. At the heart of this debate lies the role of agricultural output markets.
Broad-based agricultural growth
Theories of broad-based agricultural growth are inspired by the empirical examples of what are now the countries of the Global North and, more recently, the Asian Green Revolution. In the latter case the poverty-reducing effects of smallholder-based approaches has been shown for both small-scale farmers and agricultural labourers (Rosegrant and Hazell Citation2000). Essentially, these perspectives are underpinned by a pro-poor, smallholder approach based on the notion that increases in agricultural productivity in combination with improved commercial incentives for small-scale farmers presents a pathway out of poverty for the rural masses. Food crops (for example cereals, roots and tubers) play a central role as they constitute the mainstay of both rural and urban diets, and enhanced productivity in this sense opens up the possibility for redressing food security as well as feeding growing urban populations (Jayne, Mather, and Mghenyi Citation2006, Citation2010). Over time, diversification away from food crops towards higher value crops and other agricultural commodities enables managing risks and increasing agriculturally based incomes. The linkages to agricultural value chains at domestic, regional and even global levels are central in this respect. In the long term, increasing smallholder incomes also enhances consumption linkages to the local non-farm economy and enables the release of labour to urban areas (Haggblade, Hazell, and Reardon Citation2007). In standard structural transformation models, it is posited that in the long run, improving smallholder access to agricultural inputs as well as output markets can contribute to a macro-level transformation of the economy that involves a gradual shift away from agricultural, rural livelihoods to urban-based employment (Timmer Citation2009).
Recent empirical as well as theoretical contributions in this field of scholarship have increasingly come to recognize the limits to the applicability of the smallholder model for African realities, where agricultural policies may be unable to redress poverty among large groups of the rural population. The segmentation of the smallholder population – as evidenced for instance in the increasingly skewed distribution of land – has led to a realization that the poor who are engaged primarily in subsistence-based agriculture may be better served by social security interventions (Masters et al. Citation2013), even if these perspectives are generally underpinned by a belief in markets as drivers of poverty reduction and improved livelihoods.
Social differentiation, de-agrarianization and its critics
This market optimism can be contrasted with the scholarship on agrarian class differentiation, which emphasizes the polarizing role of global capitalism as mediated through global value chains for agricultural commodities (Havnevik et al. Citation2007). Historically, the commodification of subsistence farming transferred reproduction of the farm family to the realm of commodity relations. As suggested by Bernstein (Citation2010), from a theoretical vantage point, commodification processes ‘raise the “entry” costs and reproduction costs of capital in farming, and the risks associated with those higher costs, and increase competition for land and/or the labour to work it’ (105). Commercialization therefore results in accumulation among large- and medium-scale farmers at the expense of poorer households, since the latter are unable to meet these costs or compete for increasingly scarce resources. Over time, class differentiation encourages a process of de-agrarianization in which poorer households are gradually forced to rely increasingly on non-farm pursuits for their survival, for instance selling their labour to their more successful neighbours or leaving agriculture altogether. A related process involves de-peasantization, where the growing role of agri-business capital leads to the emergence of entrepreneurial types of farming through enhancing corporate agriculture, encouraging consolidation into medium-scale farms and readjusting the organization of farming along lines suited to this type of production, for instance outgrower schemes (Hebinck Citation2018).
Recent political economy scholarship, although taking the overarching processes of agrarian transformation as a given (a quantitative decrease in the share of agriculturally based income in rural livelihoods over time) is increasingly doubtful of the linearity of such processes. These perspectives instead stress the fluid and oftentimes conflicting dynamics of agrarian development, wishing to understand how actors position themselves in relation to the ‘negotiated spaces of opportunity’ that output markets provide (Hebinck Citation2018, 232). This work emphasizes the agentic potential of farmers, their material and cultural relationship with landscapes and the ability to manoeuvre processes of agrarian change through multi-locational livelihood adaptation using a detailed case study approach that emphasizes distinctiveness (Chigumira Citation2018; Hebinck, Mtati, and Shackleton Citation2018; Shackleton and Hebinck Citation2018). While the attention to the fluidity of agrarian dynamics is valuable, these perspectives are centred on the interaction between the behaviour and experiences of farmers in relation to these dynamics and the strongly contextualized and unique agrarian pathways that they engender, rather than the material consequences of these pathways with respect to wealth distribution. Theoretical perspectives related to polarization and social differentiation are therefore more useful in exploring distributional change, especially in the context of a comparative, cross-country, mixed-methods study. As noted by Oya (Citation2010) and more recently Noe and Brockington (Citation2021), there are relatively few longitudinal studies of village-level processes of rural differentiation in an African context, however, limiting the possibilities for tracing wealth dynamics over time. Hence, while the macro-level data point to growing differentiation – whether prompted by commercialization or not – there are few studies of the local, village level that can confirm or refute these tendencies.
Data and methods
The research design of the study draws on a local perspective that seeks to capture changes at the village level. While village studies constitute an important complement to studies of regional and country dynamics, the village is also the spatial unit that is of most immediate relevance to poor people's livelihoods, as mobility is limited and agriculture by its nature relies on a material resource base that revolves around land. While the relationships between smallholders and the state and various markets are vital to rural livelihoods, the consequences of these relationships are largely played out at the village level. A growing scholarship on rural differentiation along lines of class and gender (Andersson Djurfeldt Citation2020; Olofsson Citation2020) suggests that the village level is a relevant unit of study, but also that a more systematic approach to understanding these processes from a spatial perspective can contribute to understanding how rising changes in the distribution of wealth varies across space. The primary unit of analysis in what follows hence is the village level. To address the research questions outlined above, a combination of longitudinal quantitative data collected as part of a number of research projects and qualitative data from specific villages is used.
Quantitative data
The quantitative data used consist of a subset of household data collected by the Afrint groupFootnote1 in eight African countries in 2002 and 2008 (Ethiopia, Ghana, Kenya, Malawi, Mozambique, Nigeria, Tanzania, Zambia) and again in six of these countries in 2013/2015 (Ghana, Kenya, Malawi, Mozambique, Tanzania and Zambia). The data used here cover five of these countries: Ghana, Kenya, Malawi, Tanzania and Zambia. Mozambique has been omitted since the project has not carried out qualitative field work in any villages in Mozambique and interpreting the results therefore is difficult. The quantitative data hence consist of two panel rounds (2002–2008) and (2008 to 2013/2015) and three cross sections: 2002, 2008 and 2013/2015. In what follows I compare data primarily from the first and final cross sections.
The limitations of the study design must be recognized. The initial project aimed to shed light on the prospects for an African Green Revolution, modelled on the Asian experience. As such, a multi-stage purposive study design was used to select countries and regions that were considered to contain an unharnessed potential for increasing productivity, in terms of agro-ecological potential but also latent commercial opportunities tied to connectivity to markets. While the project design excluded well-known examples of agricultural intensification, the regions that were selected were nonetheless judged to be above average. Within the countries, regions were selected to provide variability, such that dynamic and less dynamic regions were selected.Footnote2 A purposive selection of villages was again carried out within each region, with a random sample of the village population being taken as the final step of the sampling procedure.Footnote3 The sample hence is representative at the village level. In what follows I analyse changes in these village cross sections over time and test these differences statistically using t-tests. The analysis covers 44 villages across five countries. Five of the villages in Tanzania (Isele, Kipaduka, Ihemi, Idete and Katurukila) were revisited also as part of Ponte and Brockington’s (Citation2020) study. The names,Footnote4 regions and sample sizes of the cross sections are listed in .
Table 1. Countries, regions, villages, sample sizes, 2013/2015.
Representativity is maintained between the different phases of the project, through balancing the panels to account for changes in the village populations as a result of in-migration, while also dealing with attrition. Other households have been randomly selected to replace households who left the panel, as a result of out-migration for instance. One descendant has been sampled from each household upon the death of an earlier member of the study. The cross section for each village for each round of data collection therefore contains three categories of respondents: (1) respondents who have remained in the panel since the previous round of data collection, or their descendants; (2) respondents that have been added to the panel from the remaining village population to replace those who have left the panel; and (3) those who have been sampled specifically to deal with in-migration.
The data collection instruments have evolved over time to address the particular interest of each phase of the project. Initially the focus was on capturing potential for agricultural intensification in staple crops specifically, and hence the data set for 2002 contains variables primarily related to production of grain crops. In 2008, data on household cash income were included to capture agricultural commercialization and diversification outside agriculture. In the final round, individualized income data were collected from all adult household members to address gender disparities in access to cash incomes within and outside agriculture.Footnote5 In terms of assets, the data set contains a number of variables that have been collected in all rounds since 2002 – cultivated farm size (land), livestock, ownership of telephones, and ownership of television sets and particular items of furniture.
In earlier work we showed the distribution of both agricultural and non-agricultural assets based on gender (Andersson Djurfeldt Citation2018a), showing how this varies strongly across space even at the larger scale of the region. At the village level the sub-samples are too small to allow for testing for gender- or class based differences, however, and the concern here is understanding the disparities in the distribution of wealth as well as precarity between rather than within villages. For this purpose I rely primarily on the quantitative data, but the interpretation of results is based on qualitative fieldwork in a number of villages, as detailed in a set of earlier publications (Andersson Djurfeldt and Hillbom Citation2016; Andersson Djurfeldt Citation2012; Andersson Djurfeldt, Djurfeldt, and Sarpong Citation2014; Andersson Djurfeldt, Hillbom, and Msuya Citation2021; Andersson Djurfeldt and Wambugu Citation2011; Alobo Loison and Hillbom Citation2020).
Assets as indicators of wealth
As noted by Ponte and Brockington (Citation2020), the importance of particular assets as indicators of material wealth varies over both time and space. Meanwhile, the use value of land depends greatly not only on its size but also on the capital and labour available to the household to improve and invest in its productivity. Land has not been included in the asset data collected by Ponte and Brockington (Citation2020). Housing, however, has – as suggested by the authors – ‘long been a marker of social difference’ (219).
While a generalized increase in housing standards and consumer durables over time would indicate an improvement in livelihoods and living standards, investment in assets may also lead to short-term liquidity constraints and an inability to meet urgent expenditures, as capital may not be possible to realize in the short term. Liquidity constraints are also considered a major impediment to investments in agricultural technology for smallholders in Africa generally. To capture both short- and long-term wealth distribution an indicator based on two variables is constructed: whether the household lived in advanced housing (defined as a house with iron-sheeted roofs and concrete or brick walls)Footnote6 and whether the household reported being able to save for future needs. Fulfilling both these criteria would suggest being beyond precarity in terms of living standards, an ability to avoid short-term hardship and being able to invest for the future. In a context of what is often described as persistent rural poverty, being able to meet both these criteria would indicate belonging to a small group of wealthy households. Although this group can be considered wealthy in a relative rather than absolute sense, for simplicity's sake this indicator is labelled ‘wealthy households’.
This indicator is juxtaposed against an indicator of precarity: households who live in the most basic housing (a house with a thatched roof, mud walls and a mud floor) and report having to borrow money to meet their expenditures. This indicator thus identifies households who have the lowest living standard while lacking the financial capital to cover short-term expenditures. I dub this indicator ‘poor households’. For the sample as a whole, nine percent fulfilled the criteria for the wealthy household indicator in 2002, compared with 24 percent in 2013/2015, while the share of poor households contracted from 16 to seven percent in the same period, suggesting improvement in living standards for the sample as a whole.
Nonetheless, while the indicators are mutually exclusive it should be noted that households in the wealthy category also borrow money, while those classified as poor also state that they can save money. The likely differences in saving and spending behaviour among the two groups in part can explain what may seem a counterintuitive pattern, while the wording of the survey questions may also contribute to this. With respect to borrowing, the survey asks the respondent to answer the question In the past year, have you borrowed money to be able to cover your expenditures, which for a relatively well-situated household may involve borrowing for more long-term investments, a type of borrowing that may be beyond the reach of poorer households. For the wealthy households the share who borrowed money has increased from 29 percent in 2002 to 39 percent in 2013/2015. This interpretation appears to be valid given the much higher share of wealthy households who obtained agricultural credit: 22 percent compared with 13 percent among the poor households. For the savings data, meanwhile, the results indicate widespread improvement even among the households classified as poor: in 2002, 38 percent of the sampled households stated that they could save for future needs, while the corresponding figure for 2013/2015 was 59 percent. In general, therefore, widespread improvement in living standards appears to have occurred; whether this is concentrated in particular villages or part of a more general trend will be analysed in what follows.
Data analysis is based on comparing differences of means for these two indicators between the village cross sections for 2002 and 2013/2015. Independent sample t-tests are used to test differences in the distribution of means in the indicators over time.Footnote7 All tables refer to the village cross-sections, with levels of statistical significance below 10 percent reported in each table, following standard notations.
Is a pointed-egg distribution of wealth emerging in the villages?
The emergence of a pointed egg-shaped wealth distribution would suggest a shrinking of the segment of ‘poor households’, a reduction in the share of ‘wealthy households’ and an increase in households that do not fulfil either of these criteria.
by contrast, and as expected, shows a variety of patterns, the most obvious of which is perhaps the expansion of the wealthy segment. In fact, in many villages it is questionable whether this category can still be considered to be a small group of wealthy households; rather, there appears to have been a general rise in living standards since 2002. The share of poor households in the meantime has contracted, but these two processes do not necessarily overlap in a spatial sense – in some villages the share of wealthy has increased without a corresponding decrease in the share of poor households, and in others the reverse has occurred. Nonetheless, based on , a number of pathways related to a more equal distribution of wealth can be identified, although not necessarily of the pointed egg type.
Table 2. Share of households in the categories ‘wealthy’ and ‘poor’.
Firstly, around a quarter (10) of the villages (see and ) show a dynamic of generalized improvements: with a significant change in the share of households fulfilling the wealthy household indicator between 2002 and 2013 leading to an endpoint where more than 50 percent of the households in the village fulfilled the conditions for this indicator. This has been accompanied by a fall in the share of poor households – where there were such households in 2002. Examples of this pattern can be found in all countries except Malawi, and include one village in Ghana (Gyidi), one village in Zambia (Dumba), four villages in Kenya (Gatondo, Icuga, Kiambii and Irigithathi) and four villages in Tanzania (Idete, Mbingu, Kitelewasi and Kasanga). While Tanzania has a large share of these villages, Tanzania is not unique – similar patterns of equalization occur also in other countries. In the case of the other countries, however, all of the villages that show generalized improvements are found in regions that were sampled as representative of the more dynamic regions at the start of the project.
Figure 1. Villages showing generalized improvements, by country and region. Villages are denoted by stars. The maps show major road networks and cities. The map is an original map based on data from open sources: Map data from naturalearthdata.com, ESRI World Cities and GRIP; maps drawn by Klara Hällqvist.
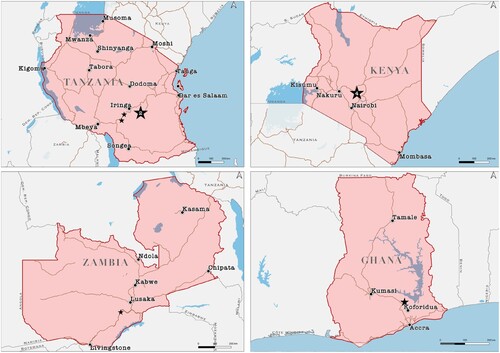
Table 3. Villages showing generalized improvements, by country and region.
A second pattern relates to villages with smaller significant increases in the wealthy segment, and a fall in the share of precarious households at the bottom. The share of wealthy households varies, but there is nonetheless a graduation upwards and a move towards the middle for the bottom households. Examples of these villages can be found in all countries except Kenya, for instance Apaa (Ghana), Ngolanga (Malawi), Isele (Tanzania) and Nkumbi (Zambia).
A third set of villages have moved towards a more equal wealth distribution through a fall in the share of poor households without a corresponding increase in the share of wealthy households. These include villages such as Shia and Zanlerigu in Ghana.
Fourthly, the pattern of a large and expanding segment of wealthy households (where between 18 and 49 percent of the village population belonged to this segment at the end of the study) has occurred in a number of villages, without a decrease in the share of households who are poor.
Finally, three villages (Ekero, Chegulo, Gatagati – all in Kenya) have experienced an increasingly equal wealth distribution through a shrinking share of wealthy households – that is, a decrease in living standards and savings capacity at the top rather than an improvement at the bottom. Out of the 44 villages, 36 villages therefore had a more equal wealth distribution at the end of the study period than at the beginning, when considering the two indicators.
Six villages showed no change in distribution over time, and two showed a strengthening of the pyramid shape – that is, the persistence of a small group of wealthy households at the top and an expansion of the base or increases at the top accompanied by increases at the bottom (increasing polarization).
In sum, the very large majority of villages showed a more equal distribution of wealth and less poverty at the end of the study period than at the beginning, when these two indicators are considered. In turn, this leads us to a set of related questions: are these changes, like in the findings reported by Ponte and Brockington (Citation2020), being driven by agriculture or by non-farm opportunities? Are there spatial patterns to these dynamics, especially in relation to the first group of villages, which experienced the most generalized improvements? Finally, how can this micro-level account be aligned with macro-level data that point instead to increasing inequality, in smallholder agriculture and land distribution especially?
Are the changes being driven by agriculture?
The role of the rural non-farm sector has been discussed extensively in the literature on African smallholder agriculture. Conventionally this sector has been seen either as a ticket out of agriculture and a way of enhancing income opportunities, dealing with seasonal risks and improving possibilities for investment in agriculture (see Alobo Loison Citation2015), or as part of a poverty-driven process of de-agrarianization and de-peasantization (Bryceson Citation2002). Recently, more nuanced understandings of linkages to the non-farm sector have been advanced, by the recent scholarship in political economy described earlier (Hebinck Citation2018), but also by agricultural economists such as Dorward et al. (Citation2009) who use a typology that classifies smallholders as hanging in, stepping up and stepping out of agriculture.
For the sample as a whole, Jirström, Archila Bustos, and Alobo Loison (Citation2018) show the importance of non-farm incomes as a dividing line between poorer and wealthier households, even if agriculture continues to be the mainstay of livelihoods as suggested both by our data and by other studies (Davis, Di Giuseppe, and Zezza Citation2017). The continued cultural importance of agriculture noted by the recent political economy literature is reflected also in qualitative fieldwork from the project, documenting for instance the future aspirations among youth in Mkushi Zambia (Andersson Djurfeldt et al. Citation2019) and in four villages in Tanzania (Lindsjö et al. Citation2020).
When considered at the micro level of the villages, the dominant role of agriculture in income generation comes across strongly. Two indicators are presented in and : on the one hand an indicator of whether the household had access to any non-farm income, data for which are available for both 2002 and 2013/2015. Since data on household cash incomes were not collected until the second round of data collection (2008), these data are not available for the first round; therefore, I compare the share of household income generated through non-agricultural incomes for the second (2008) and final (2013/2015) rounds of data collection.
Table 4. Share of households who had access to non-farm income, 2002 and 2013/2015, by village. The italicized villages are those that showed generalized improvements over time (see ).
Table 5. Average share of household income generated through non-farm income, 2008 and 2013/2015, by village. The italicized villages are those that showed generalized improvements over time (see ).
A few observations can be made in relation to : with the exception of the villages in Ghana and a few villages outside Ghana, the role of agriculture in farmer livelihoods has actually increased since 2002. For the 10 villages (see ) that showed the most equalizing tendencies in wealth distribution (italicized in the table), the access to non-farm incomes decreased in seven, and was unchanged in two, suggesting a shift towards agriculture rather than towards non-farm incomes. Gyidi in Ghana was the only village in which the access to non-farm incomes increased.
shows the share of household income generated through non-farm sources of income, comparing 2008 and 2013/2015, for those households who had access to non-farm incomes. Again, with the exception of the villages in Ghana, the importance of agricultural incomes has generally increased, but the pattern is slightly more mixed. In the ‘top 10’ villages (italicized in the table), five had decreasing shares of non-farm incomes, but in two the role of non-farm incomes increased and in the remaining three its importance remained unchanged. Interestingly, in those three villages (Shikomoli, Ekero and Chegulo, all in Kenya), where the distribution of wealth was equalized through a falling share of wealthy households rather than improvements for the lower end of the distribution, the share of non-farm incomes increased.
For the sampled villages as a whole, however, agriculture appears to be a strong driver of long-term improvements in living standards, considering the falling access to non-farm income over time. Other publications based on data from the project show the importance of some key crops: maize production increased substantially in Zambia over the project period, while yields grew by nearly a quarter between 2008 and 2013/2015. Rice played a similar role in Tanzania and Ghana, where both average production and yields increased between 2008 and 2013/2015 (Jirström, Archila Bustos, and Alobo Loison Citation2018). Tanzania and Zambia increased their state subsidies for inputs during the span of the project, providing an explanation for increases in yields. Also, crop diversification out of the cereal crops into potentially more lucrative crops occurred in the same period for the sample as a whole, but patterns shift over time and the commercialization dynamics of particular crops are very localized. Examples here include increases in marketing of plantains in Ghana and Irish potatoes in Kenya and Tanzania. The production of classical cash crops has remained largely stagnant, however, with the exception of the emergence of cocoa and cashew nuts in Tanzania (Andersson Djurfeldt Citation2018b). At an overarching level therefore, the data lend support to theoretical perspectives that stress the poverty-reducing possibilities of smallholder-based agriculture. The linkages between generalized livelihood improvements shown at the village level and land distribution are not captured by these data alone, however.
Land distribution
The literature in general shows a polarization of land within the smallholder sector, and we have also shown elsewhere that cultivated farm size is increasingly differentiated between the first and fourth quartiles for smallholders at the country level (Jirström, Archila Bustos, and Alobo Loison Citation2018).Footnote8 At the village level, however, the pattern is less straightforward: in 11 villages land distribution became less polarized, as evidenced by falling Gini coefficients between 2002 and 2013/2015, while they remained unchanged in two villages (see Appendix 1 and ). Nonetheless, land distribution already at the start of the period was highly unequal, as evidenced by Gini coefficients above 0.3 in a majority of the villages. Around a third of the villages saw increases in Gini coefficients of 10 points or less, whereas in nearly a third, Gini coefficients rose by between 11 and 30 points, which is a remarkable concentration of land over the time period.
Table 6. Gini coefficients for cultivated farm size, 2002 and 2013/2015 by village. The italicized villages are those that showed generalized improvements over time (see ).
On the whole, farm size has therefore become more differentiated over time, but the size of this difference is substantial, and the starting points also vary greatly. Overall, land size distribution was highly unequal in Kenya and Zambia already in 2002. Perhaps the most remarkable change is in the Tanzanian villages, however, where all villages except one increased their Gini coefficients by between 8 and 31 points.
The increase in inequality in land distribution in villages that were already highly unequal at the start of the project period is also striking for the sample as a whole: in 2002 only one village had a Gini coefficient for cultivated farm size above 0.5 and another four had Gini coefficients of 0.4 or above (but below 0.5). By 2013, two villages had land distributions of 0.6 or above, six had Gini coefficients between 0.5 and 0.59 and 10 had Gini coefficients between 0.4 and 0.49. In total, therefore, the number of villages with Gini coefficients of 0.4 or above was 18 villages in 2013/2015 compared with only five in 2002. Importantly, since the sampled households are drawn from the resident smallholder population in the villages, so-called briefcase farmers have not been surveyed. In turn, this means that the inequality driven by absentee landlordism, noted for instance in work on emergent farmers, is not captured (Anseeuw et al. Citation2016; Jayne, Chamberlin, and Headey Citation2014). Village-level inequality in land distribution is therefore likely to be underestimated, especially in villages close to urban centres. On the whole, therefore, inequality in cultivated farm size increased remarkably at the village level, confirming and reflecting empirical findings of growing segmentation in land access and control at the macro level.
Since the Gini coefficients refer to cultivated farm size, this includes both land that is controlled or owned by the farmer and land that is rented and hence is not an asset as such. Whereas inequality in cultivated farm size may be prompted in part by the emergence of a rental market in response to better commercial opportunities in agriculture, the possibility of renting land is likely to be higher among households that hold other assets, have more available family labour or can hire labour.
Whereas tangible assets such as housing standards and savings ability have seen a wholesale improvement for the village populations, this appears to have come at the cost of increasing inequality in the distribution of land in many villages. This raises questions around these two parallel processes: why is polarization in land size occurring when it is seemingly decreasing with respect to other assets? Can land-use patterns and commercialization offer an explanation in this context? The remainder of this paper compares and contrasts dynamics in the 10 villages (as listed in ) that show the strongest equalizing tendencies with respect to housing standards and savings ability in an attempt to shed light on the linkages between changes in land size distribution and non-agrarian assets.
Village-level dynamics
The 10 villages that have the strongest equalizing tendencies with respect to savings and housing standards show slightly different patterns with respect to land distribution (): four showed a slight decrease in land concentration (Gyidi, Kiambii, Gatondo and Idete), whereas land inequality increased in the remaining six villages: Icuga showed a small increase, but the remaining villages experienced rapid rises in Gini coefficients, ranging between 15 and 27 points, pointing to sharply increasing inequality over a relatively short period.
Table 7. Changes in Gini coefficients for cultivated farm size by village in the ‘top 10’ villages.
As noted above, there is a concentration of the villages that show a generalized improvement to two countries, Kenya and Tanzania, where eight of the villages are located. In addition, all villages except two are situated in regions that were purposively selected as dynamic regions at the start of the project in 2002. Spatially, therefore, there seems to be a polarization in assets and welfare towards the already dynamic regions. As can be seen in the data as a whole, there has, however, been a wholesale improvement of living standards and assets across the sample, although the top 10 villages have benefited disproportionately in this process. These 10 villages hence can be described as positive outliers in a more general process of living standard improvements. Nonetheless, the linkages between a general and equalizing improvement in living standards and savings ability translates differently into changes in farm size distribution, even if agriculture is the driver of the former in all villages except Gyidi. As such, the villages offer an interesting possibility for identifying potential agricultural pathways that are more or less equalizing.
Among the villages where a more equalized distribution of non-farm wealth and assets has emerged alongside a more equal distribution of cultivated farm size, Gyidi again stands out in several respects. Here this process is driven primarily by the non-farm sector, while earlier field work from Gyidi also shows that the village is not only very favourably located in direct proximity to the district capital of Begoro, but is also run as a religious settlement based on communitarian principles focused on agricultural production, diversification and equality (Andersson Djurfeldt, Djurfeldt, and Sarpong Citation2014).
For the remaining villages, agricultural land use and commercialization pathways suggest the importance of diversified cropping systems (Andersson Djurfeldt Citation2017). Only Idete can be described as specialized in cereal crops (rice), whereas the other villages rely on combinations of cash crops, tree crops, horticulture and subsistence crops. Qualitative data from three of the Kenyan villages (Gatondo, Icuga and Irigithathi) as well as Dumba in Zambia (Alobo Loison and Hillbom Citation2020) point to the rising importance of dairy farming. In the latter, emerging milk marketing infrastructures stand out as an explanation for new and potentially more equalizing patterns of agricultural commercialization, that offer more seasonal stability and are less reliant on land. In the case of Zambia this may be moderating the effect of smallholder policies encouraging emergent farmers in maize (Jayne, Chamberlin, and Headey Citation2014), which in the context of extensive cropping systems would explain a concurrent rise in inequality in cultivated farm size alongside more equalizing income-earning opportunities in the dairy sector. Land shortages in conjunction with more intensified use of land through new tree crops and horticulture may on the one hand be increasing and equalizing incomes, but on the other appear to be encouraging rising inequality in cultivated farm size in some of the Kenyan villages, most strikingly Irigithathi. Here, qualitative data in the form of key informant interviews with chiefs and extension agents point to land pressure as the major cause of insecurity in rural livelihoods.
In the case of the Tanzanian villages, the more equal land distribution in Idete may in part be related to the emergence of a rental market. As shown elsewhere, the correlation between total cultivated area and the share of land that is rented is negative, suggesting that those households who rent land have the smallest holdings, which may indicate that households who are short on land are able to expand their farms through the rental market (Andersson Djurfeldt, Hillbom, and Msuya Citation2021). The relationship between vulnerability and rental status is not straightforward: the falling Gini coefficient in Idete could theoretically be obscuring rising vulnerability, tied to the emergence of new tenurial relationships that provide for more equalized access to land but less equality in control and ownership of land. Nonetheless, the need to rent out land could in itself be indicative of vulnerability, while households who are capable of renting land and putting it to productive use are likely to be households who are well positioned in terms of labour and capital.
In the case of Kitelewasi and Kasanga, land-use patterns are diversifying away from maize (which is still grown for subsistence) towards exotic timber and horticulture. The favourable location of these villages close to the main highway between Dar es Salaam and Zambia is especially apparent in the case of Kitelewasi, which during the course of the project has gradually become peri-urbanized and is now part of Mafinga town council (Andersson Djurfeldt et al. Citation2020). Overall, for these villages, the data point to the importance of diversified and changing land-use patterns in response to commercial incentives within agriculture as drivers of improvements in living standards. For most villages this translates into less equality in terms of the distribution of cultivated area, but this relationship is highly contextual and appears to be related to the increasing demand for land arising from such commercialization.
Conclusions
I return now to the questions posed at the beginning of this paper around wealth distribution, agriculture and land. The Afrint data set is uniquely placed to answer these questions as it is longitudinal, village focused and statistically representative at this level. While a variety of patterns of wealth distribution has emerged in the 10+ year period covered by the data, none closely resembles the pointed egg-shaped distribution; rather, there appears to be a more or less wholesale graduation in terms of living standards, when checked against housing standard and the ability to save for future needs. Indeed, 36 out of 44 villages showed an improved wealth distribution on these counts. The data also confirm Ponte and Brockington’s (Citation2020) findings that enhanced smallholder opportunities in agricultural output markets are the main explanation for such improvements. Indeed, agriculture has become more, rather than less, dominant in livelihoods over time. Both of these findings lend support for theoretical perspectives that stress the poverty-reducing aspects of smallholder-based agricultural models. Agricultural commercialization has not, as de-agrarianization approaches suggest, led to increasing social differentiation at the village level, but rather the reverse. Moreover, agriculture continues to constitute the backbone of rural livelihoods – the cost of entry into commodity markets, in this sense, has not been prohibitive or led farmers to leave agriculture altogether.
Theoretical perspectives stressing differentiation are, however, clearly relevant in terms of understanding increasingly skewed distributions of land as well as spatial polarization. Addressing only the distribution of assets, using housing standards or similar welfare markers runs the risk of missing redistribution of land and other agricultural resources that are increasingly valuable, given improvements in commercial opportunities in agriculture, and falling urban fortunes. Smallholder linkages to value chains hence seem to be driving livelihood improvements, while land markets are increasingly segmented, through a process driven by growing demand for land (whether internal or external). Whether the latter will, in the long run, displace smallholders from their villages remains uncertain.
The villages that experienced the most dramatic redistribution of living standards and savings ability were favourably located in terms of access to major roads and urban markets, but were also characterized by diversification into intensive types of land use – whether through tree crops, dairy or horticulture. Spatial contextualization is, therefore, necessary, with respect to both these theoretical approaches.
Acknowledgements
I thank Fred Dzanku for helping me calculate the Gini indices to a degree of perfection only an economist could. I am very grateful to Dan Brockington, Jordan Chamberlin and Magnus Jirström for reading and providing comments and suggestions for further improvements. The constructive comments of two anonymous reviewers are also gratefully acknowledged. The article was written as part of the research project Mixing household surveys, satellite imagery and machine learning in human development studies: Is it (finally) time for satellite imagery in social science research? MXM19-1104:1, funded by Riksbankens Jubileumsfond, headed by Ola Hall. Data collection for the paper was carried out through the Afrint project, which has been funded through several sources. Aside from the original funding from Sida – who generously paid for the data collection for Afrint I and Afrint II – funding for Afrint III has been awarded from Sida's research council (U-Forsk), Vetenskapsrådet and the UK's Economic and Social Research Council (ESRC), and UK Aid from the UK government. Afrint III has been part of two grant schemes, DEGRP (DFID-ESRC Growth Research Programme) jointly funded by the UK's Department for International Development (DFID) and ESRC and APRA (Agricultural Policy Research in Africa) conducted with funding from UK Aid from the UK government. The findings and conclusions contained herein are those of the author and do not necessarily reflect positions or policies of the UK government, DFID, or ESRC, or of the Swedish government, Vetenskapsrådet, or Sida.
Disclosure statement
No potential conflict of interest was reported by the author.
Additional information
Funding
Notes on contributors
Agnes Andersson Djurfeldt
Agnes Andersson Djurfeldt is a professor of human geography with a focus on development geography. Her research interests focus on rural-based processes of change within and outside agriculture in sub-Saharan Africa, involving shifting rural and translocal livelihoods, gender-based access to productive resources within and outside agriculture, consumption and intra-household division of labour and income. Recent research interests include lower level urbanization and the possibilities for inclusive urbanization.
Notes
2 The selection of regions and villages was carried out by partners in the countries involved in the broader study based on qualitative criteria related to agricultural growth potential in terms of physical aspects related to soils and rainfall and accessibility as well as commercial opportunities within agriculture.
3 In the case of Tanzania, a stratified random sample was taken.
4 A number of villages have been pseudonymized to protect the identity of the respondents, since they are the subject of qualitative studies that have been presented in other work: Nkhwangwa, Chikwanje and Khasu in Malawi, and Nikantaka (see Andersson Djurfeldt et al. Citation2018), Mkhwezi and Chilekwa in Zambia (see Andersson Djurfeldt and Hillbom Citation2016).
5 The problems of collecting data at the household level are well known, both theoretically (presuming a joint utility function) and methodologically (assuming that the household head has access to perfect information), especially in the context of gender relations (Chant Citation2007; Guyer Citation1981; Udry and Woo Citation2007). Nonetheless, from a comparative point of view, the use of a standard analytical unit is necessary, and household-level data have generally been collected through surveying the self-defined head of the household.
6 The survey for 2002 has three categories of housing – basic, intermediate and advanced – and the survey for 2013/2015 has four, where the upper two have been combined to correspond with the 2002 variable.
7 Technically, the panel households can be considered to be dependent samples, but the small sample sizes prevent separate independent sample t-testing of the households that are not part of the panel.
8 Although the data have been cleaned, in the sense that obviously erroneous data have been removed, extreme cases have deliberately been left in the sample at the level of the villages since not including these cases would give a semblance of more equal access to land than what is actually the case. In work that uses the data set at the level of the country or region, extreme cases have, however, been removed.
References
- Alobo Loison, S. 2015. “Rural Livelihood Diversification in Sub-Saharan Africa: A Literature Review.” The Journal of Development Studies 51 (9): 1125–1138.
- Alobo Loison, S., and E. Hillbom. 2020. “Regional Evidence of Smallholder-Based Growth in Zambia’s Livestock Sector.” World Development Perspectives 19: 100229.
- Andersson Djurfeldt, A. 2012. “Seasonality and Farm Non-Farm Interactions in Western Kenya.” Journal of Modern African Studies 50 (1): 1–23.
- Andersson Djurfeldt, A. 2013. “African Re-Agrarianization? Accumulation or Pro-Poor Agricultural Growth?” World Development 41: 217–231.
- Andersson Djurfeldt, A. 2017. Pro-Poor Agricultural Growth–Village Dynamics and Commercialisation Pathways (1781184224). APRA Working Paper number 3, Future Agricultures Consortium.
- Andersson Djurfeldt, A. 2018a. “Assets, Gender and Livelihoods.” In Agriculture, Diversification and Gender in Rural Africa: Longitudinal Perspectives from Six Countries, edited by A. Andersson Djurfeldt, F. M. Dzanku, and A. Isinika, 54–80. Oxford: Oxford University Press.
- Andersson Djurfeldt, A. 2018b. “Gender and Rural Livelihoods: Agricultural Commercialization and Farm Nonfarm Diversification.” In Agriculture, Diversification and Gender in Rural Africa: Longitudinal Perspectives from Six Countries, edited by A. Andersson Djurfeldt, F. M. Dzanku, and A. Isinika, 81–112. Oxford: Oxford University Press.
- Andersson Djurfeldt, A. 2020. “Gendered Land Rights, Legal Reform and Social Norms in the Context of Land Fragmentation - a Review of the Literature for Kenya, Rwanda and Uganda.” Land Use Policy 90 (104305): 1–22.
- Andersson Djurfeldt, A., and G. Djurfeldt. 2013. “Structural Transformation and African Smallholders: Drivers of Mobility Within and Between the Farm and Non-Farm Sectors for Eight Countries.” Oxford Development Studies 41 (3): 281–306.
- Andersson Djurfeldt, A., G. Djurfeldt, and D. B. Sarpong. 2014. “Community, Cohesion and Context: Agrarian Development and Religion in Eastern Region, Ghana.” Geoforum 52: 78–89.
- Andersson Djurfeldt, A., O. Hall, A. Isinika, E. Msuya, and G. Tambang Yengoh. 2020. “Sustainable Agricultural Intensification in Four Tanzanian Villages—A View from the Ground and the Sky.” Sustainability 12 (20): 8304.
- Andersson Djurfeldt, A., and E. Hillbom. 2016. “Pro-poor Agricultural Growth–Inclusion or Differentiation? Village Level Perspectives from Zambia.” Geoforum 75: 220–233.
- Andersson Djurfeldt, A., E. Hillbom, and E. E. Msuya. 2021. “Ricing Fortunes - Agricultural Growth, Farm Intensification and Paddy Specialization in Two Tanzanian Villages.” In Assets, Prosperity and Rural Livelihoods: Insights From Longitudinal Studies in Tanzania, edited by D. Brockington, and C. Noe, 237–257. Oxford: Oxford University Press.
- Andersson Djurfeldt, A., E. Hillbom, W. O. Mulwafu, P. Mvula, and G. Djurfeldt. 2018. “‘The Family Farms Together, the Decisions, However are Made by the Man’—Matrilineal Land Tenure Systems, Welfare and Decision Making in Rural Malawi.” Land Use Policy 70: 601–610.
- Andersson Djurfeldt, A., A. Kalindi, K. Lindsjö, and M. Wamulume. 2019. “Yearning to Farm–Youth, Agricultural Intensification and Land in Mkushi, Zambia.” Journal of Rural Studies 71: 85–93.
- Andersson Djurfeldt, A., and S. K. Wambugu. 2011. “In-kind Transfers of Maize, Commercialization and Household Consumption in Kenya.” Journal of Eastern African Studies 5 (3): 447–464.
- Anseeuw, W., T. Jayne, R. Kachule, and J. Kotsopoulos. 2016. “The Quiet Rise of Medium-Scale Farms in Malawi.” Land 5 (3): 19.
- Bernstein, H. 2010. Class Dynamics of Agrarian Change. Halifax and Winnipeg Sterling, VA: Fernwood Publishing, Kumarian Press.
- Binswanger-Mkhize, H. P., A. F. McCalla, and P. Patel. 2010. “Structural Transformation and African Agriculture.” Global Journal of Emerging Market Economies 2 (2): 113–152.
- Bryceson, D. 2002. “The Scramble in Africa: Reorienting Rural Livelihoods.” World Development 30 (5): 725–739.
- Bryceson, D. F. 2019. “Gender and Generational Patterns of African Deagrarianization: Evolving Labour and Land Allocation in Smallholder Peasant Household Farming, 1980–2015.” World Development 113: 60–72.
- Chant, S. 2007. Gender, Generation and Poverty: Exploring the Feminisation of Poverty Thesis in Africa, Asia and Latin America. Cheltenham: Edward Elgar.
- Chigumira, E. 2018. “Political Ecology of Agrarian Transformation: The Nexus of Mining and Agriculture in Sanyati District, Zimbabwe.” Journal of Rural Studies 61: 265–276.
- Cousins, B., A. Dubb, D. Hornby, and F. Mtero. 2018. “Social Reproduction of ‘Classes of Labour’ in the Rural Areas of South Africa: Contradictions and Contestations.” Journal of Peasant Studies 45 (5-6): 1060–1085.
- Davis, B., S. Di Giuseppe, and A. Zezza. 2017. “Are African Households (not) Leaving Agriculture? Patterns of Households’ Income Sources in Rural Sub-Saharan Africa.” Food Policy 67: 153–174.
- Dorward, A., S. Anderson, Y. N. Bernal, E. S. Vera, J. Rushton, J. Pattison, and R. Paz. 2009. “Hanging in, Stepping up and Stepping Out: Livelihood Aspirations and Strategies of the Poor.” Development in Practice 19 (2): 240–247.
- Guyer, J. I. 1981. “Household and Community in African Studies.” African Studies Review 24 (1): 88–137.
- Haggblade, S., and P. Hazell. 2010. Successes in African Agriculture. Baltimore: IFPRI/Johns Hopkins University Press.
- Haggblade, S., P. Hazell, and T. Reardon. 2007. Transforming the Rural Non-Farm Economy: Opportunities and Threats in the Developing World. Baltimore: John Hopkins University Press.
- Havnevik, K., D. Bryceson, L. E. Birgegård, P. Matondi, and A. Beyene. 2007. African Agriculture and the World Bank - Development or Impoverishment? Policy Dialogue No. 1. Uppsala.
- Headey, D. D., and T. Jayne. 2014. “Adaptation to Land Constraints: Is Africa Different?” Food Policy 48: 18–33.
- Hebinck, P. 2018. “De-/re-agrarianisation: Global Perspectives.” Journal of Rural Studies 61: 227–235.
- Hebinck, P., N. Mtati, and C. Shackleton. 2018. “More Than Just Fields: Reframing Deagrarianisation in Landscapes and Livelihoods.” Journal of Rural Studies 61: 323–334.
- Jayne, T., J. Chamberlin, and R. Benfica. 2018. “Africa’s Unfolding Economic Transformation.” The Journal of Development Studies 54 (5): 777–787.
- Jayne, T. S., J. Chamberlin, and D. D. Headey. 2014. “Land Pressures, the Evolution of Farming Systems, and Development Strategies in Africa: A Synthesis.” Food Policy 48: 1–17.
- Jayne, T. S., D. Mather, and E. Mghenyi. 2006. Smallholder Farming under Increasingly Difficult Circumstances: Policy and Public Investment Priorities for Africa. MSU International Development Working Paper. Department of Agricultural Economics, Michigan State University. East Lansing.
- Jayne, T. S., D. Mather, and E. Mghenyi. 2010. “Principal Challenges Confronting Smallholder Agriculture in Sub-Saharan Africa.” World Development 38 (10): 1384–1398.
- Jirström, M., M. Archila Bustos, and S. Alobo Loison. 2018. “African Smallholder Farmers on the Move: Farm and Non-Farm Trends for Six Sub-Saharan African Countries.” In Agriculture, Diversification and Gender in Rural Africa, edited by A. Andersson Djurfeldt, F. M. Dzanku, and A. Isinika, 17–53. Oxford: Oxford University Press.
- Lindsjö, K., A. A. Andersson Djurfeldt, A. C. Isinika, and E. Msuya. 2020. “Youths' Participation in Agricultural Intesification in Tanzania.” AIMS Agriculture and Food 5 (4): 681–699.
- Masters, W. A., A. Andersson Djurfeldt, C. De Haan, P. Hazell, T. Jayne, M. Jirström, and T. Reardon. 2013. “Urbanization and Farm Size in Asia and Africa: Implications for Food Security and Agricultural Research.” Global Food Security 2 (3): 156–165. http://doi.org/10.1016/j.gfs.2013.07.002.
- Muyanga, M., and T. S. Jayne. 2019. “Changing Farm Structure in Africa: Implications on Agricultural Transformation in Southern Africa.” In Transforming Agriculture in Southern Africa, edited by Richard A. Sikora, Eugene R. Terry, Paul L. G. Vlek, and Joyce Chitja, 288–297. London: Routledge.
- Noe, C., and D. Brockington. 2021. “Telling the Stories of Asset Accumulation.” In Assets, Prosperity and Rural Livelihoods: Insights from Longitudinal Studies in Tanzania, edited by D. Brockington, and C. Noe, 363–382. Oxford: Oxford University Press.
- Olofsson, M. 2020. “Socio-Economic Differentiation from a Class-Analytic Perspective: The Case of Smallholder Tree-Crop Farmers in Limpopo, South Africa.” Journal of Agrarian Change 20 (1): 37–59.
- Oya, C.. 2010. “5 Agro-Pessimism, Capitalism and Agrarian Change.” In The Political Economy of Africa. Vol. 85, edited by Vishnu Padayachee, 103–127. London: Routledge.
- Ponte, S., and D. Brockington. 2020. “From Pyramid to Pointed egg? A 20-Year Perspective on Poverty, Prosperity, and Rural Transformation in Tanzania.” African Affairs 119 (475): 203–223.
- Rosegrant, M., and P. Hazell. 2000. Transforming the Rural Asian Economy: The Unfinished Revolution. Hong Kong: Oxford University Press.
- Shackleton, S. E., and P. Hebinck. 2018. “Through the ‘Thick and Thin’ of Farming on the Wild Coast, South Africa.” Journal of Rural Studies 61: 277–289.
- Timmer, P. 2009. A World Without Agriculture: The Structural Transformation Process in Historical Perspective. Washington D.C.: The American Enterprise Institute Press.
- Udry, C., and H. Woo. 2007. “Households and the Social Organization of Consumption in Southern Ghana.” African Studies Review 50 (2): 139–153.
- Wiggins, S. 2000. “Interpreting Changes from the 1970s to the 1990s in African Agriculture Through Village Studies.” World Development 28 (4): 631–662.
- Wiggins, S. 2005. “Success Stories from African Agriculture: What are the Key Elements of Success?” IDS Bulletin 36 (2): 17–22.
- Zamchiya, P. 2013. “The Role of Politics and State Practices in Shaping Rural Differentiation: A Study of Resettled Small-Scale Farmers in South-Eastern Zimbabwe.” Journal of Southern African Studies 39 (4): 937–953.