
ABSTRACT
The purpose of this study was to demonstrate the impact of a peer-tutoring program on academic performance among first-year students. The sample consisted of 102 first-year students from four-degree programs at a Spanish University. The academic performance was measured through the official student Academic reports. The assignment of the students to the experimental group (N = 51) and control group (N = 51) was done randomly. The intervention consisted of 20 highly structured individual weekly tutoring sessions delivered by senior and doctoral students, previously trained in three training sessions. The results show moderate effects’ size and statistically significant differences in favor of the experimental group in the total academic course, as well as in the fall and spring semesters.
Introduction
The analysis of the Higher Education (HE) students’ academic performance in the last two decades seems to confirm that the productivity of the undergraduate or equivalent education has been quite deficient, despite certain improvements registered in recent years (OECD Citation2018). International reports (e.g. European Commission/EACEA/Eurydice Citation2014; OECD Citation2018; Vossensteyn et al. Citation2015) reveal Graduation Rates (GR) that vary from one country to another between 18% and 77% (OECD Citation2018), and Dropout Rates (DR) between 7% and 48% (Vossensteyn et al. Citation2015). In Spain, the official data provided by the Sistema Integrado de Información Universitaria (Citation2017) reveal a low GR (33.2%), in addition to a high DR and Change of Studies Rate, which stand at 35.2% and 12.3%, respectively, with special incidence on freshmen (22.5% and 8% of DR and Change of Studies Rate in the first-year, respectively).
These low levels of retention and performance, not only generates a high psychological cost to many young people and their families, but also an important social and economic cost that some experts have estimated close to the .3% of the national Gross Domestic Product like in Spain (Dolado Citation2010). In fact, to improve the HE effectiveness in terms of students success, several (a) political (e.g. organization, funding and financial incentives), (b) organizational (e.g. students success programs), and (c) classroom (e.g. student-centered active and experiential learning) measures, strategies and practices have been implemented (Brint and Clotfelter Citation2016; Crosling, Heagney, and Thomas Citation2009; Goldrick-Rab Citation2010; Kuh et al. Citation2006; Ruffalo Noel-Levitz Citation2015; Vossensteyn et al. Citation2015).
Indeed, since students success programs have been associated with students’ success, many institutions have allocated significant resources to the new students adjustment programs (Brint and Clotfelter Citation2016). These programs (a) basically focus on helping and supporting new students, facilitating their integration into the new social and academic environment and incorporating different activities and resources (Kuh et al. Citation2006; Pascarella and Terenzini Citation2005; Ruffalo Noel-Levitz Citation2015), (b) are usually based on explanatory models of reference like Pascarella and Terenzini (Citation2005), or Tinto (Citation1993, Citation2012), and (c) take a variety of different forms across institutions (e.g. learning communities, tutoring, peer-tutoring, etc.) (Kuh et al. Citation2006; Ruffalo Noel-Levitz Citation2015).
Peer-tutoring is one of the more extended forms to support new students adjustment (Kuh et al. Citation2006; Ruffalo Noel-Levitz Citation2015), and it can be defined as ‘the acquisition of knowledge and skill through active helping and supporting among status equals or matched companions, where both tutees and tutors benefit from the transaction’ (Topping Citation2015, 1). These programs can vary depending on how several organizational dimensions are combined (e.g. curriculum content, contact constellation, year of study, ability, role continuity, time, place, objectives, and reinforcement), although the year of study and ability between participants (i.e. cross-year vs. same-year), contact constellation (i.e. dyads or one-to-one vs. small groups), and role continuity (i.e. fixed vs. reciprocal) are the most commonly used methods (Topping Citation2015). In addition, peer-tutoring vary enormously regarding the curricular contents and objectives, although most of them focus on subject-specific contents to improve formal academic achievement (Topping Citation2015).
In relation to effectiveness and results, Topping (Citation2015) suggests that when peer-tutoring is ‘implemented with thoughtfulness about what form of organization best fits the target purpose, context and population, and with reasonably high implementation integrity, results are typically very good’ (4), although the research about his effectiveness, at least on academic performance at undergraduate levels, ‘has not kept pace with the widespread use of tutoring’ (Holliday Citation2012, 21). For example, dyadic or one-to-one cross-year fixed-role peer-tutoring have not delivered the expected results or in the necessary magnitude, mainly because there are few rigorously controlled studies, and it is therefore difficult to quantify its impact (Colver and Fry Citation2016; Holliday Citation2012). In this vein, this uncertain lack of effectiveness can be attributed to several factors. First, many programs implemented at the university level do not include any type of evaluation measures, or provide results just on student’ participation, satisfaction, and perceptions on effectiveness of peer-tutoring (Colver and Fry Citation2016). Second, most of the empirical data showing positive effects on university students’ academic success comes from studies using qualitative designs (e.g. Chen and Liu Citation2011; Mynard and Almarzouqi Citation2006), or pre-experimental and ex post facto research designs, such as: (a) one-shot case study (e.g. Bryer Citation2012; Walker and Dancy Citation2007); (b) one-group pretest-postest, with a effect size that ranges between .02 and .58 in cumulative GPA, where higher frequency of peer-tutoring activity was associated with increasing positive differences between later and earlier GPA (e.g. Sobral Citation2002); and (c) static-group, with a effect size that ranges between .02 and .88 in GPA or students’ performance in different subjects o courses, between .38 and .58 in credits earned, and .10 in students’ retention (e.g. Chaney Citation2010; Colver and Fry Citation2016; Cooper Citation2010; Hendriksen et al. Citation2005; Higgins Citation2004; Munley, Garvey, and McConnell Citation2010; Reinheimer and McKenzie Citation2011; Topping et al. Citation1996; Xu et al. Citation2001). And third, the quality of the scientific evidence that allows to establish causal relationships between participation in these programs and the improvement of adjustment and adaptation of students to university life is relatively moderate, due to limitations in the size of the samples or the intergroup comparability (e.g. Lake Citation1999; Nestel and Kidd Citation2003).
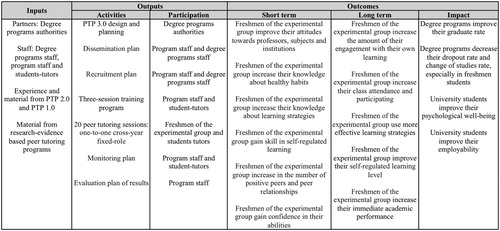
The Peer-Tutoring Program (PTP) reported here consist of a psycho-pedagogical intervention based on a dyadic cross-year fixed-role peer-tutoring (i.e. tutoring sessions whereby older, more experienced students undergo a three-session tutoring training program taught by the university academic staff), which draws upon counseling approaches and seeks to enable students to improve their level of self-regulated learning, without focusing on subject-specific contents, in order to increase freshmen academic and social adjustment to the university study demands, and consequently their academic performance (see for logic model). The logic model exhibited in is a graphic and explicit representation of the program inputs, outputs and outcomes. It intends to build logical framework, that is, a common understanding of goals, processes and expectations for resources. It also helps to get people to think through and understand a project.
Figure 1. Peer-tutoring program logic model.
The PTP has been implemented in two previous editions during the first semester in different degree programs, contributing in both cases to enhance academic success among freshmen, as revealed by the results of their evaluation (see Arco and Fernández Citation2011; Arco, Fernández, and Fernández Citation2011; Fernández and Arco Citation2011; Fernández et al. Citation2010, Citation2011). However, those results also showed the need to introduce changes on some of the elements and characteristics of the program research and evaluation design, planning and implementation like: (a) increasing the number of control variables on which the pairing decisions are based, which has reduced Type I and Type II errors when making causal inferences; (b) starting the tutoring sessions at the beginning of the fall semester and continuing them throughout whole academic year, which means increasing the ‘dosage’ of treatment, although increasing also the time demand on both student-tutors and freshmen; (c) aligning and summarizing to a greater extent the tutoring sessions contents to the participating degree programs; (d) increasing the student-tutors training time on case analysis, including establishing objectives, tasks and strategies/instructions; (e) increasing effective monitoring activities as well as freshmen students engagement; (f) increasing the number (and quality) of spaces available to deliver the tutoring sessions (i.e. more classrooms and meeting seminars were available for tutors to implement tutoring sessions and also that those classrooms and seminars were better equipped with more confortable and functional furniture and digital resources); (g) complement the tasks to be carried out by the student-tutors, with the tutorial action of the teaching staff of the subjects; (h) adopting a randomized control trial design; and (i) optimizing program’s fidelity based on a thoughtful monitoring plan. Therefore, once the changes described above were incorporated to the program except for element (g) (due to program capacity), the PTP version 3.0 was implemented.
The purpose of this research was to test the effectiveness of the PTP 3.0 to improve the academic performance and retention of freshmen university students. To this end, the following hypotheses were established: (1) as a result of the PTP, there will be statistically significant improvement in the freshmen experimental group’s Grade Point Average (GPA), Performance Rate (PR) (i.e. the coefficient of the number of credits passed divided by the number of credits registered), and Success Rate (SR) (i.e. the coefficient of the number of credits passed divided by the number of credits registered and completed) at the end of the fall semester, reflected in the Academic report, as compared to that of the freshmen control group; (2) as a result of the PTP, there will be statistically significant improvement in the freshmen experimental group’s GPA, PR and SR at the end of the spring semester, reflected in the Academic report, as compared to that of the freshmen control group; and (3) as a result of the PTP, there will be statistically significant improvement in the freshmen experimental group’s GPA, PR, SR and DR in the total academic course (i.e. a combination of the fall and spring terms results along with another extraordinary exam period that takes place in September in the Spanish academic system), reflected in the Academic report, as compared to that of the freshmen control group.
Method
Participants
The sample of this study consisted of 102 first year university students (i.e. freshmen). This sample was divided into two equivalent groups. The first one, consisted of the experimental group with 51 freshmen, 43 women and 8 men, with an average age of 18 years (SD = .00), and a distribution by degree program of 16 freshmen studied Pharmacy, 4 studied Economics, 24 studied Psychology, and 7 studied Business Administration and Management. The second one, consisted of the control group with 51 freshmen, with the same distribution by degree program and sex, and the same mean and age range as the experimental group (see for more detail).
Table 1. Experimental and control groups equivalence on socio-demographic control variables.
Table 2. Experimental and control groups equivalence on academic control variables.
Table 3. Experimental and control groups equivalence: Anova and Mann-Whitney U tests.
Table 4. Experimental and control groups equivalence: chi-squared.
The sampling selection was based on a non-probabilistic sampling technique, and involved the following actions: (a) selection of the four degree programs; (b) implementation of the dissemination plan, that is, 12 group dissemination sessions with the freshmen students, in their respective classrooms, where they were informed about the conditions and benefits of the program, at the same time that they were invited to participate in the program; (c) implementation of the recruitment plan, with a total of 269 freshmen students voluntarily registered in the program, after signing the Contract agreement (i.e. rights and obligations), filling out a Participant questionnaire (i.e. demographic and academic information), the Social Skills Scale (SSS) (Gismero Citation2000), and the Motivated Strategies for Learning Questionnaire (MSLQ) (Pintrich et al. Citation1991), in addition to providing a copy of their Academic report; and (d) final sample selection.
Out of the 269 freshmen who initially volunteered a total of 83 pairs (N = 166) were created with 103 freshmen finally discarded due to the lack of an appropriate match. Pairs were sorted and matched according to two set of control variables (Ato, López, and Benavente Citation2013), usually associated with academic success or failure (Barbera et al. Citation2017; Chen Citation2012; Fong et al. Citation2017; Kuh et al. Citation2006; Laskey and Hetzel Citation2011; Pascarella and Terenzini Citation2005; Richardson, Abraham, and Bond Citation2012; Tinto Citation1993, Citation2012; Vossensteyn et al. Citation2015): (a) academic: degree program, program year, group, subjects and number of credits registered, type of upper secondary education track, number of times that has taken the university entrance exam, place of choice of the degree program in the pre-enrolment, GPA obtained in upper secondary school, GPA obtained in university entrance exam, GPA of access to the university, dropout and change of previous studies, number of previous retakes, level of social skills, level of learning strategies and motivation, and level of commitment; and (b) demographic: age, sex, marital status, nationality, employment status, people sharing the household, socioeconomic status, and source of studies funding.
The minimum required total sample size for PTP 3.0 was previously calculated (N = 102), as we report later on the statistical analysis session, which forced us to discard 32 pairs due to the limited number of student-tutors available (N = 50).
Materials
Academic report. Original copy of the academic report provided by the corresponding University Office in the following academic year to the implementation of PTP.
Procedure
The methodological design adopted for the different hypotheses of this study was an experimental design of randomized blocks with concomitant variables (Ato, López, and Benavente Citation2013).
Once the freshmen’ pairs were established, each member of each pair was randomly assigned to either the experimental group or the control group. Afterwards, it was confirmed that experimental and control groups were equivalent on the pre-established control variables, with some of them showing the same value (see ), others showing the same proportion in both groups (see ), while for the rest of the control variables analysis did not reveal significant statistical differences between both groups (see and ), thus establishing their equivalence. Then, the researchers contacted each member of the control group to inform them that they had not been selected to participate in the program, although they would remain on the waiting list.
In parallel to the sampling process, the student-tutors selection process was implemented. A total of 20 group sessions were held to disseminate the programs among senior and doctoral students, requesting their voluntary participation, although at the end of the program, tutors were awarded by the Faculty with the equivalent to 6 credit hours. A total of 141 senior and doctoral students voluntarily enrolled in the program, and 50 were selected as student-tutors according to the following criteria: (a) having a GPA higher than 7 points (in a scale from 0 to 10); (b) scoring 30 points or higher in the scales on MSLQ (Pintrich et al. Citation1991) and the SSS (Gismero Citation2000); (c) demonstrating interest and time availability; (d) attending the three PTP 3.0 training sessions; and (e) passing the practical PTP 3.0 training tests.
As mentioned above, the student-tutors had to undergo a three-sessions training program: (a) session 1: introduction of the program staff, participants, and the training plan, justification of the program, and difficulties and problems of academic and social adjustment of the freshmen, causal variables and intervention measures (Arco et al. Citation2009); (b) session 2: use of the Working notebook (i.e. study protocol: a set of materials in which each of the tutoring sessions was presented in a structured manner) (see Arco et al. Citation2009; Fernández and Arco Citation2009a, Citation2009b), and implementation of the tasks of the first tutoring session; and (c) session 3: performance of the freshmen’ needs assessment (i.e. instructions on how to elaborate and to analyze a self-report instrument) setting objectives, strategies and tasks (Arco et al. Citation2009; Fernández and Arco Citation2009a, Citation2009b), and analysis of potential conflicts or unexpected situations of tutoring sessions.
Finally, the matching of the freshmen in the experimental group or tutees with their respective student-tutors (of the 50 student-tutors, one agreed to tutor two freshmen) was done considering their equivalence on degree program and time availability.
The tutoring sessions were held during the whole academic year in one-to-one cross-year fixed-role, and a 90-minute tutoring weekly session delivered at a specific place and time. Thus, student-tutors implemented a total of 20 tutoring sessions for tutee. These sessions, were structured and sequenced in the Working notebooks with the purpose of facilitating the student-tutors implementation and following up tasks as well as the application of the monitoring plan (see Arco et al. Citation2009; Fernández and Arco Citation2009a, Citation2009b). Furthermore, the student-tutors had to describe and adapt certain activities to the tutees’ characteristics, needs, and progress, which gave them higher level of responsibility and control during these sessions (Topping Citation2015).
In this line, in order to work with dispositional and supportive learning strategies, the student-tutor and tutee carried out the following tasks during tutoring session 1: (a) introduction to each other and Faculty guided tour; (b) filling in the Working notebooks with contact data, academic information (e.g. courses, exams, etc.), and schedules and places of tutoring sessions; (c) reading and making comments on their respective rights and obligations; (d) description of university services; (e) realization of a brief description of what has been learned in that session; and (f) assignment of tasks to the tutee for the next session (i.e. completing the self-reported instrument). Tutoring session 2 focused on the metacognitive strategies of planning and regulation: review of pending tasks, customization of the functional analysis of those variables included in the Working notebooks that potentially were hindering their academic performance, tutee’ needs assessment (i.e. analyzing the self-report instrument) as well as the selection, recording and graphic representation of relevant variables that affect academic performance: sleep hours, distinguishing between study activities that ‘hurt’ in the sense that they are more cognitively demanding versus those that do not ‘hurt’, and leisure hours), establishment of objectives, strategies and tasks in connection with the environmental conditions of study and time available (i.e. analysis and changes in study conditions, analysis of academic tasks, preparation of weekly study plan and establishment of rewards, taking as reference the information provided in the Working notebooks), and completion of a brief description of what was learned and identification of tasks for the next session (i.e. implementation of the weekly study plan and registration of its degree of compliance). In tutoring session 3 student-tutor and tutee had to focus on: reviewing the degree of compliance of the weekly study plan, including the graphical representation of those key variables reflecting potential procrastination behaviors (i.e. making adjustments in the weekly study plan and self-administration of rewards based on the information provided in the Working notebooks), brief description of what was learned in that tutoring session and assignment of new tasks for the next session (i.e. the new weekly study plan reducing the gap observed between actual engagement and behaviors and expectations).
The rest of the sessions followed the structure and contents of the tutoring session 3 to cover up progressively all contents included in the Working notebooks, such as: (a) healthy habits: sleeping habits in session 4 and eating habits in session 5; (b) cognitive strategies of rehearsal, organization and elaboration: skills for searching and managing scientific literature in sessions 6 and 12, rehearsal strategies in session 7, and connecting and processing information techniques in sessions 13, 14 and 15; and (c) dispositional and support strategies: reduction of anxiety to speak in public in sessions 16 and 17. However, the three sessions previous to the end of the fall and spring semesters (i.e. 8, 9 and 10, and 18, 19 and 20, respectively) focused more intensively on the following issues: (a) increasing engagement and implementation of the weekly study plan, particularly class attendance, meals, and sleep hours; (b) increasing rehearsals, including simulations of exam conditions; and (c) prioritizing objectives in a realistic and pragmatic way avoiding short terms analysis. In addition, the first session of the second semester (i.e. session 11), was aimed at analyzing the academic outcomes and their attributions to such results.
At the same time, as mentioned before, the monitoring plan to warranty the program fidelity was implemented. In this regard, 3 individual follow-up sessions were held between the program staff and each one of the student-tutors after completing tutoring sessions 2, 5 and 15, and 2-group sessions follow-up after conducting the tutoring sessions 10 and 20. The individual follow-up sessions consisted of reviewing the information contained and previously registered by student-tutors in the Working notebooks. As for the group sessions, they were devoted to assessing overall participation as well as those more frequent challenges posed by the tutoring sessions implementation.
Statistical analysis
The power analysis and sample size were calculated considering the expected effect size (.50), the associated probability (.05) and the desired levels of statistical power (.80) (Soper Citation2018).
Furthermore, after applying Kolmogorov-Smirnov to check for normal distribution, parametric and non-parametric analyses were performed on certain control variables (see and ): (a) ANOVA: level of social skills; (b) Mann-Whitney U tests: number of credits registered, GPA obtained in upper secondary school, GPA obtained in university entrance exam, GPA of access to the university, level of commitment, and level of learning strategies and motivation; and (c) Chi-squared: people sharing the household, socioeconomic status, and source of studies funding.
Additionally, the data for the different hypotheses were analyzed through the U of Mann-Whitney and value d of Cohen, after applying Kolmogorov-Smirnov to check for normal distribution. Finally, the familywise error rate, resulting from the multiple comparison problem, was controlled with Bonferroni correction.
Results
Tests of the three hypotheses were conducted using Bonferroni adjusted alpha levels of .017 per test (.05/3).
Pertaining to the hypothesis 1, after obtaining a non-normal distribution from the Kolmogorov-Smirnov test on academic performance indicators, the U of Mann-Whitney analyses for the experimental group on academic performance yielded statistically significant differences at the end of the fall semester as compared to the results obtained by the control group ().
Table 5. Intergroup (experimental vs. control) comparisons of Freshmen’s academic performance.
With regard to hypothesis 2, again, the Kolmogorov-Smirnov test corroborated a non-normal distribution on academic performance indicators at the end of the spring semester. Next, the U of Mann-Whitney test showed statistically significant differences in favor of the experimental group on GPA, PR and SR at the end of the spring semester ().
Finally, as to hypothesis 3 is concerned, after obtaining a non-normal distribution from the Kolmogorov-Smirnov test on academic performance indicators, the U of Mann-Whitney test indicated statistically significant differences in favor of the experimental group on GPA (U = 700.00, p < .001), PR (U = 809.50, p < .001), and SR (U = 834.50, p < .017) at the end of the academic course ().
Discussion
The present study intends to proof the supplemental capacity of the PTP 3.0 to improve students’ academic performance compared to previous editions (Arco and Fernández Citation2011; Arco, Fernández, and Fernández Citation2011; Fernández and Arco Citation2011; Fernández et al. Citation2010, Citation2011). Therefore, considering the results obtained, the following conclusions can be established: (1) the PTP 3.0 had a statistically significant impact on freshmen’s academic performance at the end of fall and spring semesters, therefore, we fail to reject hypotheses 1 and 2; and (2) there was a statistically significant difference between the freshmen’s experimental and control groups in academic performance in the total academic course, except for the DR, therefore, hypothesis 3 can be partially rejected.
In spite of the rather conservative Bonferroni correction, the results above based on statistical significance clearly show that participating in the PTP 3.0 has a positive and statistically significant effect on most of the key high-quality outcomes for freshmen. However, specialized literature recommends testing the hypothesis not only considering the probability and statistical significance values (Ledesma, Macbeth, and Cortada Citation2008); but, also, and perhaps more importantly, on the basis of effect size (Cohen Citation1988). In this sense, the values of the effect size show moderate effects in most of the established academic performance indicators, which means that the intergroup differences that have been generated in these indicators can be detected by simple observation (Coe Citation2002). In fact, the values of the effect size reveal that a hypothetical member of the experimental group has 69%–79% chances of reaching a higher score than any hypothetical member of the control group. Furthermore, these moderate effects do not question whatsoever the importance and contribution of this applied research, basically because in educational research effect sizes tend to be much smaller than in other disciplines, and values around .30 are considered of an important practical relevance (Hattie Citation2009; Valentine and Cooper Citation2003). Also, Coe (Citation2002) states that a change higher than .10 in variables such as academic performance can be important if the intervention does not involve a high cost, as is the case.
In sum, these results confirm the effectiveness of the PTP 3.0 to increase the academic performance among freshmen, demonstrating a higher impact compared to previous editions (Arco and Fernández Citation2011; Arco, Fernández, and Fernández Citation2011; Fernández and Arco Citation2011; Fernández et al. Citation2010, Citation2011), and even other similar programs developed over the last two decades (e.g. Chaney Citation2010; Colver and Fry Citation2016; Griffin and Griffin Citation1997; Lake Citation1999; Nestel and Kidd Citation2003; Topping et al. Citation1996; Xu et al. Citation2001). Although some program changes, like starting the tutoring sessions at the beginning of the fall semester and continuing them throughout the whole academic year, aligning and summarizing to a greater extent the tutoring sessions contents to the participating degree programs, and increasing the student-tutors training time on case analysis, appear to be responsible for the significant results accomplished, those are pending to be confirmed by further (qualitative) evaluations.
Nevertheless, some of these results have to be taken with caution. Firstly, in relation to potential sample selection bias, this program’s research design controls for students motivation (i.e. sampling was based on volunteering) and other control variables (e.g. socioeconomic status or number of credits registered), which makes this program suitable only for those students willing to benefit from supplemental academic support (e.g. non-traditional students). However, as Brint and Clotfelter (Citation2016) point, the problem with those students at risk of failure and dropout, who do not sign up for this type of programs awaits solution. In this view, improving enrollment services and policies for those alternative groups could become another effective strategy to reverse the trends mentioned in the introduction. In any case, including more representative samples that improves generalizability prognosis and translate into more convincing evidence of these programs impact across students with different motivational profiles, entails higher financial resources, as Bettinger and Baker (Citation2014) also recognize. Further analyses of potential confounds related to the volunteer sample selection bias by comparing our data with those of the general population were not possible because of accessibility problems.
Secondly, with respect to the potential clustering effects, even Randomized Control Trials (RCT) where individuals are randomized are not immune to clustering effects (Flight et al. Citation2016). However, it is realistic to assume in our case that variations in average freshmen outcome do not result from the student-tutors competence and/or experience, because (a) the student-tutors selection was based on a specific and objective clearly defined set of characteristics, (b) they were trained in the use of the Working notebook (i.e. study protocol), and (c) program staff carried out an exhaustive monitoring plan to warranty the program fidelity. This argument aligns with that of Roberts and Roberts (Citation2005) who say, ‘training or standardization of treatment through the use of protocols could result in a more homogeneous outcome’ (153).
Finally, although at smaller scale compared to previous editions of the program, certain non-desirable and non-allowed behaviors (i.e. lack of punctuality, last minute tutoring hour changes, attendance to tutorial sessions without the necessary materials, and not completing the tasks assigned) showed by 6 tutees in the first three tutoring sessions translated into some delays in the process of integrating metacognitive strategies of planning and regulation in the self-regulation process.
In order to develop more robust impact evaluation in the future the following program’s characteristics should be modified: (a) the size and representativeness of the sample (e.g. selection based not only on self-selection, or sex proportion in the sample and that of participants degree programs); (b) the quality of the RCT (e.g. increasing the number of control variables to pairing up freshmen); (c) further identification of potential confounds (e.g. non-cognitive skills like grit, academic self-concept or resilience); and/or (d) the refinement of those elements of the program that remain unchanged (e.g. review of the criteria to access and remains).
Likewise, it would be necessary to evaluate the medium and long-term effects of the program, due to the lack of studies focusing on this type of evidences and the criticisms and challenges affecting this type of interventions (Arco and Fernández Citation2002).
Conclusions
The result obtained with this study contributes to enlarge the body of evidences supporting peer-tutoring programs as an effective and sustainable solution to HE productivity problems, particularly those affecting freshmen students. As Holliday (Citation2012) points, a better balance between effectiveness and widespread use of peer-tutoring programs was needed.
The quality of the evidence provided stems from the statistical significance and moderate effect size based on an experimental design (Slavin Citation2017), which, with caution, allows establishing causal relationships between participation in these programs and the improvement of adjustment and adaptation of students to university life as authors like Colver and Fry (Citation2016) claim.
The added value of this program lays on its contribution and innovation to refine and proof key implementation strategies and materials to warrant program fidelity. Therefore, although simply offering these programs does not guarantee improved students performance as Kuh et al. (Citation2006) state, this program can contribute in Spain, and internationally, to the advancement of international standards and guidelines on monitoring the progress and results of university students, as well as acting on these results, embedded in the Bologna process and the European HE Area and targeted by the European Association for Quality Assurance in HE (Citation2015).
Although more proactive high-quality services related to enrollment policies, career guidance and/or counseling should be adopted by HE institutions, this study demonstrates, in the meanwhile, that we have the knowledge and the capacity (at a very low cost) to prevent performance and dropout problems affecting millions of freshmen students. If dissemination and adoption challenges affecting this type of programs are eventually overcome, HE Institutions could save millions of Euros of public money, which is very important in a context of persistent economic scarcity, as Dolado (Citation2010) remarks.
At the same time, more sophisticated research and evaluation designs (i.e. cluster RCT) capable of accommodating the nested complexity of research conditions and needs are necessary in order to increase the quality of the evidences available for institutional decision makers to adopt and scale up this type of programs.
Acknowledgements
We would like to acknowledge the academic staff for their collaboration as well as the students-tutors for the volunteer participation.
Disclosure statement
No potential conflict of interest was reported by the authors.
Related Research Data
References
- Arco, J. L., and A. Fernández. 2002. “Porqué los programas de prevención no previenen [Why Preventions Programs do not Prevent?].” International Journal of Clinical and Health Psychology 2 (2): 209–226.
- Arco, J. L., and F. D. Fernández. 2011. “Eficacia de un programa de tutoría entre iguales para la mejora de los hábitos de estudio del alumnado universitario [Efficacy of a Peer Tutoring Program to Increase Study Habits Among University Students].” Revista de Psicodidáctica 16 (1): 162–180.
- Arco, J. L., F. D. Fernández, and J. M. Fernández. 2011. “The Impact of a Peer-tutoring Program on Quality Standards in Higher Education.” Higher Education 62 (6): 773–788. doi:10.1007/s10734-011-9419-x.
- Arco, J. L., S. López, F. D. Fernández, E. Jiménez, R. Caballero, and V. A. Heilborn. 2009. Guía psicopedagógica para estudiantes y profesores universitarios en el Espacio Europeo de Educación Superior [Psychopedagogical Guide for University Studetns and Professors on the Higher Education Area]. Granada, Spain: Universidad de Granada.
- Ato, M., J. J. López, and A. Benavente. 2013. “Un sistema de clasificación de los diseños de investigación en psicología [A Classification System of Research Designs in Psychology].” Anales de Psicología 29 (3): 1038–1059. doi:10.6018/analesps.29.3.178511.
- Barbera, S. A., S. D. Berkshire, C. B. Boronat, and M. H. Kennedy. 2017. “Review of Undergraduate Student Retention and Graduation Since 2010: Patterns, Predictions, and Recommendations for 2020.” Journal of College Student Retention: Research, Theory & Practice 31: 1–24. doi:10.1177/1521025117738233.
- Bettinger, E. P., and B. Baker. 2014. “The Effects of Student Coaching: An Evaluation of a Randomized Experiment in Student Advising.” Educational Evaluation and Policy Analysis 36 (1): 3–19. doi:10.3102/0162373713500523.
- Brint, S., and C. T. Clotfelter. 2016. “US Higher Education Effectiveness.” RSF: The Russell Sage Foundation Journal of the Social Sciences 2 (1): 2–37. doi:10.7758/rsf.2016.2.1.01.
- Bryer, J. 2012. “Peer Tutoring Program for Academic Success of Returning Nursing Students.” The Journal of the New York State Nurses’ Association 43 (1): 20–22.
- Chaney, B. W. 2010. National Evaluation of Student Support Services: Examination of Student Outcomes After Six Years. Final Report. Washington, DC: Office of Planning, Evaluation and Policy Development, US Department of Education.
- Chen, R. 2012. “Institutional Characteristics and College Student Dropout Risks: A Multilevel Event History Analysis.” Research in Higher Education 53: 487–505. doi:10.1007/s11162-011-9241-4.
- Chen, C., and C. C. Liu. 2011. “A Case Study of Peer Tutoring Program in Higher Education.” Research in Higher Education Journal 11: 1–10. doi:10.1080/03075079512331381810.
- Coe, R. 2002. “It’s the Effect Size, Stupid. What Effect Size is and Why it is Important.” Paper presented at the British Educational Research Association Annual Conference, Exeter, September 12–14.
- Cohen, J. 1988. Statistical Power Analysis for the Behavioral Sciences. 2nd ed. Hillsdale, NJ: Lawrence Erlbaum Associates.
- Colver, M., and T. Fry. 2016. “Evidence to Support Peer Tutoring Programs at the Undergraduate Level.” Journal of College Reading and Learning 46 (1): 16–41. doi:10.1080/10790195.2015.1075446.
- Cooper, E. 2010. “Tutoring Center Effectiveness: The Effect of Drop-in Tutoring.” Journal of College Reading and Learning 40 (2): 21–34. doi:10.1080/10790195.2010.10850328.
- Crosling, G., M. Heagney, and L. Thomas. 2009. “Improving Student Retention in Higher Education. Improving Teaching and Learning.” Australian Universities’ Review 51 (2): 9–18.
- Dolado, J. J. 2010. “Disfunciones en el sistema universitario español: Diagnóstico y propuestas de reforma [Disfunctionalities of the Spanish University System: Diagnosis and Reform Proposals].” In Propuestas para la reforma de la universidad española [Proposals to Reform Spanish Universities], edited by D. Peña, 13–26. Madrid, Spain: Fundación Alternativas.
- European Association for Quality Assurance in Higher Education. 2015. Standards and Guidelines for Quality Assurance in the European Higher Education Area. Brussels, Belgium: European Association for Quality Assurance in Higher Education.
- European Commission/EACEA/Eurydice. 2014. Modernization of Higher Education in Europe: Access, Retention and Employability 2014. Eurydice report. Luxembourg: Publications Office of the European Union. doi:10.2797/72146.
- Fernández, F. D., and J. L. Arco. 2009a. Cuaderno de formación y trabajo del tutor PTEC [Training and Working Notebook for PTEC’s Tutors]. Granada, Spain: Universidad de Granada.
- Fernández, F. D., and J. L. Arco. 2009b. Cuaderno de trabajo de alumnos PTEC [Working Notebook for PTEC’s Students]. Granada, Spain: Universidad de Granada.
- Fernández, F. D., and J. L. Arco. 2011. “Efectos de un programa de acción tutorial entre universitarios [Effects of a Tutoring Action Program Among University’s Students].” Infancia y Aprendizaje 34 (1): 109–122. doi:10.1174/021037011794390120.
- Fernández, F. D., J. L. Arco, F. Justicia, and M. C. Pichardo. 2010. “Mejora de la calidad en la Educación Superior a través de la intervención psicopedagógica [Improving the Quality of Higher Education Throughtout Psicopedagogical Intervention].” Revista Española de Pedagogía 246: 209–222.
- Fernández, F. D., J. L. Arco, S. López, and V. A. Heilborn. 2011. “Prevención del fracaso académico universitario mediante tutoría entre iguales [Prevention of University’s Students Academic Failure by Means of Peer Tutoring].” Revista Latinoamericana de Psicología 43 (1): 59–71.
- Flight, L., A. Allison, M. Dimairo, E. Lee, L. Mandefield, and S. J. Walters. 2016. “Recommendations for the Analysis of Individually Randomised Controlled Trials with Clustering in one Arm – a Case of Continuous Outcomes.” BMC Medical Research Methodology 16 (165): 1–13. doi:10.1186/s12874-016-0249-5.
- Fong, C. J., C. W. Davis, Y. Kim, Y. W. Kim, L. Marriott, and S. Y. Kim. 2017. “Psychological Factors and Community College Students Success: A Meta-analytic Investigation.” Review of Educational Research 87 (2): 388–424. doi:10.3102/0034654316653479.
- Gismero, E. 2000. Escala de habilidades sociales [Social Skill Scale]. Madrid, Spain: TEA.
- Goldrick-Rab, S. 2010. “Challenges and Opportunities for Improving Community College Student Success.” Review of Educational Research 80 (3): 437–469. doi:10.3102/0034654310370163.
- Griffin, B. W., and M. M. Griffin. 1997. “The Effects of Reciprocal Peer Tutoring on Graduate Students’ Achievement, Test Anxiety, and Academic Self-efficacy.” The Journal of Experimental Education 65 (3): 197–209.
- Hattie, J. 2009. Visible Learning: A Synthesis of Meta-analyses in Education. London, England: Routledge.
- Hendriksen, S. I., L. Yang, B. Love, and M. C. Hall. 2005. “Assessing Academic Support: The Effects of Tutoring on Student Learning Outcomes.” Journal of College Reading and Learning 35 (2): 56–65. doi:10.1080/10790195.2005.10850173.
- Higgins, B. 2004. “Relationship between Retention and Peer Tutoring for At-risk Students.” Journal of Nursing Education 43 (7): 319–321.
- Holliday, T. 2012. “Evaluating the Effectiveness of Tutoring: An Easier Way.” Learning Assistance Review (TLAR) 17 (2): 21–32.
- Kuh, G. D., J. Kinzie, J. A. Buckley, B. K. Bridges, and J. C. Hayek. 2006. What Matters to Students Success: A Review of the Literature. Washington, DC: National Postsecondary Education Cooperative.
- Lake, D. A. 1999. “Peer Tutoring Improves Student Performance in an Advanced Physiology Course.” Advances in Physiology Education 276 (1): S86.
- Laskey, M. L., and C. J. Hetzel. 2011. “Investigating Factors Related to Retention of At-risk College Students.” Learning Assistance Review 16: 31–43.
- Ledesma, R., G. Macbeth, and N. Cortada. 2008. “Tamaño del efecto: Revisión teórica y aplicaciones con el sistema estadístico ViSta [Effect Size: Theoretical Revision and Applications with the Statistica System ViSta].” Revista Latinoamericana de Psicología 40 (3): 425–439.
- Munley, V. G., E. Garvey, and M. J. McConnell. 2010. “The Effectiveness of Peer Tutoring on Student Achievement at the University Level.” American Economic Review 100 (2): 277–282. doi:10.1257/aer.100.2.277.
- Mynard, J., and I. Almarzouqi. 2006. “Investigating Peer Tutoring.” Elt Journal 60 (1): 13–22. doi:10.1093/elt/cci077.
- Nestel, D., and J. Kidd. 2003. “Peer Tutoring in Patient-Centred Interviewing Skills: Experience of a Project for First-Year Students.” Medical Teacher 25 (4): 398–403. doi:10.1080/0142159031000136752.
- Organization for Economic Cooperation and Development. 2018. Education at a Glance 2018. OECD Indicators. Paris, France: OECD Publishing. doi:10.1787/eag-2018-en.
- Pascarella, E. T., and P. T. Terenzini. 2005. How College Affects Students: A Third Decade of Research. San Francisco, CA: Jossey-Bass.
- Pintrich, P., D. Smith, T. García, and W. McKeachie. 1991. A Manual for the Use of the Motivated Strategies for Learning Questionnaire (MSLQ). Michigan, MI: National Center for Research to Improve Postsecondary Teaching and Learning, University of Michigan.
- Reinheimer, D., and K. McKenzie. 2011. “The Impact of Tutoring on the Academic Success of Undeclared Students.” Journal of College Reading and Learning 41 (2): 22–36. doi:10.1080/10790195.2011.10850340.
- Richardson, M., C. Abraham, and R. Bond. 2012. “Psychological Correlates of University Students’ Academic Performance: A Systematic Review and Meta-Analysis.” Psychological Bulletin 138 (2): 353–387. doi:10.1037/a0026838.
- Roberts, C., and S. A. Roberts. 2005. “Design and Analysis of Clinical Trials with Clustering Effects Due to Treatment.” Clinical Trials: Journal of the Society for Clinical Trials 2: 152–162. doi:10.1191/1740774505cnO76oa.
- Ruffalo Noel-Levitz. 2015. 2015 Student Retention and College Completion Practices Benchmark Report for Four-year and Two-year Institutions. Cedar Rapids, IA: Ruffalo Noel-Levitz. http://learn.ruffalonl.com/rs/395-EOG-977/images/2015RetentionPracticesBenchmarkReport.pdf.
- Sistema Integrado de Información Universitaria [Integrated System of University Information]. 2017. Anuario de indicadores universitarios [Annual Directory of University Indicators]. Madrid, Spain: Subdirección General de Coordinación y Seguimiento Universitario, MECD.
- Slavin, R. 2017. “Evidence-based Reform in Education.” Journal of Education for Students Placed at Risk (JESPAR) 22 (3): 178–184. doi:10.1080/10824669.2017.1334560.
- Sobral, D. T. 2002. “Cross-year Peer Tutoring Experience in a Medical School: Conditions and Outcomes for Student Tutors.” Medical Education 36 (11): 1064–1070. doi:10.1046/j.1365-2923.2002.01308.x.
- Soper, D. S. 2018. “A-priori Sample Size Calculator for Students t-test [Software].” https://www.danielsoper.com/statcalc/calculator.aspx?id=47.
- Tinto, V. 1993. Leaving College: Rethinking the Causes and Cures of Student Attrition. 2nd ed. Chicago, IL: University of Chicago Press.
- Tinto, V. 2012. Completing College: Rethinking Institutional Actions. Chicago, IL: University of Chicago Press.
- Topping, K. J. 2015. “Peer Tutoring: old Method, New Developments / Tutoría Entre Iguales: Método Antiguo, Nuevos Avances.” Infancia y Aprendizaje 38 (1): 1–29. doi:10.1080/02103702.2014.996407.
- Topping, K. J., G. A. Watson, R. J. Jarvis, and S. Hill. 1996. “Same-Year Paired Peer Tutoring with First Year Undergraduates.” Teaching in Higher Education 1 (3): 341–356. doi:10.1080/1356251960010305.
- Valentine, J., and H. Cooper. 2003. Effect Size Substantive Interpretation Guidelines: Issues in the Interpretation of Effect Sizes. Washington, DC: What Works Clearinghouse.
- Vossensteyn, J. J., A. Kottmann, B. W. A. Jongbloed, F. Kaiser, L. Cremonini, B. Stensaker, … S. Wollscheid. 2015. Dropout and Completion in Higher Education in Europe: Main Report. European Union. https://doi.org/10.2766/826962.
- Walker, K. N., and M. H. Dancy. 2007. “Investigation and Evaluation of a Physics Tutorial Center.” AIP Conference Proceedings 883: 137–140. doi:10.1063/1.2508711.
- Xu, Y., S. Hartman, G. Uribe, and R. Mencke. 2001. “The Effects of Peer Tutoring on Undergraduate Students’ Final Examination Scores in Mathematics.” Journal of College Reading and Learning 32 (1): 22–31. doi:10.1080/10790195.2001.10850123.