
ABSTRACT
Predictors of student academic success do not always replicate well across different learning designs, subject areas, or educational institutions. This suggests that characteristics of a particular discipline and learning design have to be carefully considered when creating predictive models in order to scale up learning analytics. This study aimed to examine if and to what extent frequently used predictors of study success are portable across a homogenous set of courses. The research was conducted in an integrated blended problem-based curriculum with trace data (n = 2,385 students) from 50 different course offerings across four academic years. We applied the statistical method of single paper meta-analysis to combine correlations of several indicators with students’ success. Total activity and the forum indicators exhibited the highest prediction intervals, where the former represented proxies of the overall engagement with online tasks, and the latter with online collaborative learning activities. Indicators of lecture reading (frequency of lecture view) showed statistically insignificant prediction intervals and, therefore, are less likely to be portable across course offerings. The findings show moderate amounts of variability both within iterations of the same course and across courses. The results suggest that the use of the meta-analytic statistical method for the examination of study success indicators across courses with similar learning design and subject area can offer valuable quantitative means for the identification of predictors that reasonably well replicate and consequently can be reliably portable in the future.
1. Introduction
A considerable volume of research in the field of learning analytics is exploratory and has been aimed at developing predictive models of student academic success, often related to the prediction of students’ grades and retention (Conijn et al. Citation2017; Chen et al. Citation2020; Dawson et al. Citation2014; Siemens, Dawson, and Lynch Citation2014). The majority of such models have been based on the examination of learner trace data retrieved from learning management systems (LMSs). LMSs can support student learning by providing seamless access to and various forms of interaction with learning content and other participants in the learning process through discussion forums, assignments, and quizzes (Pina Citation2012). Compared to studies predicting student success in traditional classroom settings (frequently based on self-reporting measurements such as interviews and surveys), the use of LMS log data allows for measuring students’ online behaviors ‘without the necessity of time-consuming data-collection’ (Conijn et al. Citation2017, 17). However, in spite of high potential, interest, and application of learning analytics methods in predicting student academic success based on LMS data, there are several challenges related to the portability of predictive models across different courses within an institution (Gašević et al. Citation2016; Jovanović et al. Citation2021) and across higher educational institutions (Jayaprakash et al. Citation2014; Viberg et al. Citation2018).
To contribute towards addressing the aforementioned challenges (for more, see Sect. 2.2), the current study examines the consistency of association between different indicators of students’ online learning behavior and academic success, across different courses and academic years. To control for the key sources of variability in the student success predictions, the study makes use of the learning trace data originating from one discipline (Finnegan, Morris, and Lee Citation2008), namely healthcare and the use of one pedagogical model (Gašević et al. Citation2016), namely problem-based blended learning (PBL).
In the present study, we leverage the power of single paper meta-analysis as a statistical method to combine the results of the association of several learning behavior indicators with students’ success. As a method for integration and synthesis of results from multiple cohorts, meta-analysis offers two key advantages: (i) a statistical technique to pool multiple cohorts or studies, i.e. courses in our case, and (ii) a method to assess the consistency of results or the lack thereof (heterogeneity). More importantly, meta-analysis provides a precise estimate of the effect size and offers an estimate of how confident one can be when applying such conclusions in the future (Walker, Hernandez, and Kattan Citation2008). This research aims to harness the power of meta-analysis to combine effect sizes objectively and rigorously across a large dataset of relatively homogenous courses to: (i) assess which indicators of success are consistent across courses and academic years, and (ii) understand how portable across courses the indicators are.
2. Background
2.1. Student success predictors in blended learning settings
The initial predictive modeling efforts in learning analytics research were focused on identifying features that could be used for building statistical or machine learning models that predict student course success with high accuracy (Brooks and Thompson Citation2017; Tempelaar, Rienties, and Giesbers Citation2015). Most of these studies examined the predictive power of features derived from learning trace data in the context of a single course or multiple offerings of the same course. For example, Zacharis (Citation2015) performed an analysis of learning trace data from an LMS-supported blended course to identify significant correlations between different online learning activities and students’ course grades. Out of 29 LMS usage variables examined, 14 were found significant, and among them three – counts of messages read and posted, counts of Wiki edits, and counts of content creation contributions – stood out by their effect size. Saqr, Fors, and Tedre (Citation2017) examined several indicators of regularity of study, derived from LMS log data in a blended learning setting. Regularity indicators based on LMS logins and weekly formative assessment activities showed the highest correlation with final grades. Tempelaar, Rienties, and Giesbers (Citation2015) investigated the predictive power of various kinds of features including those derived from computer-supported formative assessments and other online interaction data captured by LMS, in the context of a large, blended course. Features extracted from formative assessment data proved to be the most relevant for predicting academic performance, whereas those indicative of the intensity of LMS use had lower predictive power. That is, course-design-related trace data provided better predictive power than design-agnostic LMS data. Similar conclusions were made by Jovanovic et al. (Citation2019) based on the study that compared predictive models with generic (i.e. course-design-agnostic) vs. course-design-specific indicators of regularity of study. Using learning trace data from three consecutive offerings of a blended course with a flipped classroom design, the authors demonstrated that predictive models with course specific indicators of regularity outperformed models with generic indicators only.
Based on a literature review of predictor variables derived from LMS log data in fully online and blended courses (Conijn et al. Citation2017), most commonly used variables include total number of events, number of online sessions, total time spent online, number of content page views, number of discussion messages viewed and posted, and number of assessment items completed. Another recent review (Alyahyan and Düştegör Citation2020) identified variables such as number of logins, number of discussion forum entries, number/total time material viewed, as frequently used variables for predicting student academic success. However, given that most predictive modeling studies were set in different learning contexts and varied notably in the selection of variables (features) for predictive models, it is hard to draw a conclusion about the best or most stable predictors of student performance (Conijn et al. Citation2017). Likewise, results from such studies have a low potential for generalizability (Andres et al. Citation2018) and replicability (Andres et al. Citation2017).
2.2. Portability of student success predictors
There are several challenges preventing the attainment of large-scale robust findings in learning analytics. Some of them pertain to the practice of investigating learner behavior and success based on an idiosyncratic set of variables and limited or idiosyncratic learning trace data that originate from tailor-made digital learning systems and tools (Andres et al. Citation2018). A major reason for different choices of variables for predicting student success can be found in the differences across instructional designs (Gašević et al. Citation2016). These differences translate into different requirements and expectations for the use of affordances offered through LMSs, and thus guide students to use different functionalities of LMSs (Conijn et al. Citation2017; Gašević et al. Citation2016; Lust, Elen, and Clarebout Citation2013). This leads to the difficulty in developing portable predictive models, that is, models that would have consistent predictive accuracy across different learning contexts.
Researchers evaluating predictive models on multiple courses have confirmed the mixed results in portable models. Finnegan, Morris, and Lee (Citation2008), for example, studied 22 courses from three academic fields (English and communication; social sciences; and mathematics, science and technology). They used students’ participation trace data to construct a regression model for each academic field; the results have shown significant diversity among the predictors of academic achievement across subjects. In particular, among the eight participation indicators, Finnegan and colleagues found no single shared indicator across the three academic fields. In another study, Gašević et al. (Citation2016) investigated the extent to which instructional conditions influence the prediction of academic success in nine first-year undergrad courses representing the diversity of disciplines, including accounting, communications, computer science, economics, graphic design, marketing, mathematics, and biology. The study’s findings indicated several variability patterns among examined variables: some variables were found to be significant predictors of academic success in some courses but insignificant in others; some variables that were significant in the course specific models proved insignificant in the generalized model, and vice versa. Conijn and colleagues (Citation2017) investigated 17 blended first-year courses with relatively homogenous subjects (mathematics, physics, calculus, and technology) from the same institution. Their analyses showed that the results of predictive modeling, based on student trace data from Moodle LMS, strongly varied across courses, even though the data was collected from the same institution and course disciplines were closely related. The results of the aforementioned and a few other studies (e.g. Agudo-Peregrina et al. Citation2014; Joksimović et al. Citation2017; Saltmarsh, Zlotkowski, and Hollander Citation2011) highlight the fact that the portability of prediction models across courses is low.
In summary, some conclusions can be drawn: (1) the portability of predictive models across diverse disciplines is not as high as once hoped for; (2) predictive modeling in learning analytics has to account for instructional design and contextual factors, as highlighted by Gašević et al. (Citation2016): ‘learning analytics cannot be decoupled from actual, situated learning and teaching practice’ (83), and (3) more research is needed to investigate the possibilities of deploying predictive models at scale, in particular, to understand which subsets of predictors – those informed by course design versus course agnostic – work in particular subsets of courses (e.g. homogenous versus diverse). All this suggests that a robust method is needed to aggregate results from different cohorts, effectively pool effect sizes, and estimate heterogeneity as well as certainty with which the results would hold in future implementations. The present study applies the meta-analysis method to investigate such possibilities of studying multiple cohorts from a relatively homogeneous population.
2.3. Heterogeneity and replication
Predictive modeling in learning analytics is not alone in its issues of heterogeneity and replicability of results. Studies can rarely be an exact replication of one another; there is always heterogeneity (variability between findings of studies) originating in particularities of the implementation process, operationalization of measures, confounders, sample variations, and/or cultural differences (Hardy and Thompson Citation1998; Higgins and Thompson Citation2002; ntHout et al. Citation2016; McShane and Böckenholt Citation2017). In fact, heterogeneity has been frequently reported even in meta-analyses of very close replications (i.e. studies with identical or similar conditions) (Collaboration, Citation2015; McShane and Böckenholt Citation2017). For example, the results reported by the ‘Many Labs’ replication project present an example of the heterogeneity of a behavioral experiment conducted by 36 laboratories using identical materials. A meta-analysis of the reported findings found heterogeneity in all the 14 studied effects (Collaboration, Citation2015). Several examples of large-scale replications reported the presence of heterogeneity in identical settings (e.g. Hagger et al. Citation2016; Klein et al. Citation2018). This is why heterogeneity has become a standard within the repertoire of meta-analysis methods to evaluate the consistency of findings. Therefore, in the current study, we aimed to evaluate the extent to which meta-analysis as a statistical method can be used to deal with heterogeneity in predictive modeling in learning analytics.
2.4. Meta-analysis
Previous studies reporting on multiple courses have qualitatively synthesized different cohorts by listing results side-by-side for comparison and counting statistically significant results, or by aggregating cohorts of students into the same pool, e.g. using data from all examined courses to create a single predictive model (Agudo-Peregrina et al. Citation2014; Conijn et al. Citation2017; Gašević et al. Citation2016; Joksimović et al. Citation2015; Saltmarsh, Zlotkowski, and Hollander Citation2011). Notwithstanding the value of such methods, they have limitations. For example, they do not estimate the heterogeneity or the future predictability of the examined models and most importantly, they ‘treat’ all sample sizes equally giving small studies the same ‘vote’ as large ones (McShane and Böckenholt Citation2017; Thompson Citation1994). Such limitations can be addressed by the statistical method of meta-analysis, which includes sample size weighting, accounting for heterogeneity, and quantification of effect size and the certainty or the lack thereof.
Meta-analysis has become the golden standard for aggregating research conclusions and dealing with the heterogeneity of research findings (Gurevitch et al. Citation2018; Higgins and Thompson Citation2002; Thompson Citation1994). In various disciplines meta-analysis has had a profound effect by aiding scholars to integrate research results from multiple studies and make informed decisions about the validity of research conclusions (Gurevitch et al. Citation2018). In fact, meta-analysis lays on the top of the evidence pyramid (Collaboration, Citation2015; Glass Citation1976; Gurevitch et al. Citation2018). As our knowledge grows, robust and reliable mechanisms such as meta-analysis will be increasingly sought to pool knowledge or gather evidence from different cohorts.
Meta-analysis affords researchers rigorous statistical methods to aggregate individual study findings and account for heterogeneity. The goal of meta-analysis is to produce a pooled effect size or association as a weighted average of individual studies. The pooled effect size reflects the magnitude of the effect size or association between two variables across several studies (Gurevitch et al. Citation2018). For example, if studies report the association between two variables (e.g. engagement and higher grades), we can compute a combined correlation coefficient that represents the standardized average correlation of all studies. Additionally, meta-analysis can assess the degree of heterogeneity across cohorts, which represents the magnitude of variability among combined effect sizes; heterogeneity is expected to be higher among dissimilar effect sizes, thus decreasing our confidence in the reported combined effect size. Results of studies with low heterogeneity have higher replicability, that is, higher chance to replicate in future applications (Hardy and Thompson Citation1998; Higgins and Thompson Citation2002; ntHout et al. Citation2016; Thompson Citation1994). The precise estimates of effect size allow for better theory testing, motivates decomposition of the effects to investigate alternative explanations; furthermore, the estimation of heterogeneity can suggest the presence of moderators that were unaccounted for (Gurevitch et al. Citation2018; McShane and Böckenholt Citation2017). McShane and Böckenholt (Citation2017) proposed a single paper meta-analysis as a novel method to pool findings from multiple cohorts within the same paper allowing researchers to retain the power of the large sample size while not compromising on rigorousness or accounting for heterogeneity.
The current study leverages the power of meta-analysis – specifically single paper meta-analysis – to pool results of different cohorts. The aggregation of multiple courses affords a rigorous statistical method to increase the sample size as well as the precision and robustness of statistical inference while controlling for variability and different course sizes (weights). Meta-analysis’ results in the current study include: (1) a combined correlation coefficient of all courses, (2) heterogeneity statistics measuring the variability among course offerings, among different courses, among academic years, and among all courses combined, and (3) prediction intervals measuring how confident we can be in a particular indicator in the future.
2.5. Research questions
The aim of this study was to examine if and to what extent predictors of student study success are portable across a homogenous set of courses. In particular, the study used a single paper meta-analysis to estimate the combined effect sizes, heterogeneity of results, and certainty of future usability in a set of healthcare courses taught at the same university with similar pedagogical underpinning. The study explores different kinds of indicators of learners’ online activities, including the intensity and regularity indicators. The objective was to identify which indicators could be used to monitor students’ online behaviors across all courses, across different iterations of the same course, and across academic years. In doing so, this study aimed to answer the following research questions:
What are consistent indicators of students’ success, that is, indicators that are expected to show corroborating results in future applications?
How heterogeneous are the indicators of student success across different courses and different iterations of the same course over the years?
3. Methods
3.1. Context
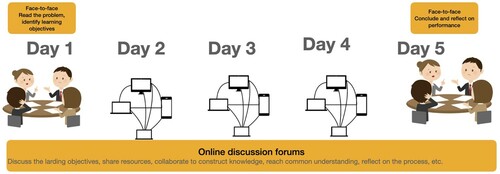
The study was conducted in an integrated blended PBL medical curriculum in Qassim Univesity and included learner trace data for four academic years (from 2014/2015 to 2017/2018). The curriculum integrates different basic science subjects under themed courses. For example, in the course of Growth and Development, the curriculum includes Physiology, Histology, Pathology, and Biochemistry of human growth and development, along with Clinical Skills. Therefore, every course was taught by teachers from different disciplines. The curriculum was based on the blended PBL design, where the learning objectives of a course form the basis for weekly problems. The PBL process followed a weekly schedule where students in small groups (around five students in each group) were offered weekly open-ended scenarios (a problem) as a stimulus for their learning. In this process, students read and discussed the problem in a face-to-face meeting as well as extract the week’s learning objectives. This was followed by a period of actively seeking information relevant for the learning objectives. The teaching followed the theme of the weekly problem, and so did the follow up evaluation.
The online part of the course was facilitated by an LMS that offers a platform for delivering the course instructions, objectives, news and announcements, and course learning resources. The online part of a course complemented the face-to-face PBL sessions with digital discussion forums, where students discussed the extracted learning objectives throughout a week, shared learning resources, co-construct knowledge, and reflected on their group work. shows the flow of the PBL process. Further details about the PBL curricula are available in Wood (2003), whereas more details about blended PBL are given in Donnelly (Citation2010).
Figure 1. Typical stages of the blended PBL process: a face-to-face session followed by online discussions throughout the week, concluded by a wrap-up session at the end of the week.
3.2. Data
The data were collected from the institution’s LMS (Moodle) for all courses that have the collaborative online PBL module. All courses with recorded logs were considered for the study if they had the minimum number of log records and students. Courses with less than 30 students were excluded since they were considered unsuitable for the correlation meta-analysis as they violated the central limit theorem (Jovanović et al. Citation2021). Courses with less than 3000 events (log records) were also excluded as they lacked enough events for analysis. The limit was chosen based on at least two events per student per course day. To limit analysis to courses with active PBL discussion forums, we excluded courses with less than two forum views per student per week. Only learning-related events in Moodle logs were considered. In other words, neither teacher events nor clicks on profiles pages, chats, and checking grades were included in the analysis (Saqr and López-Pernas Citation2021a). In addition, very infrequent events (e.g. clicks on inactive wiki modules, workshops, and labels) were removed.
3.3. Operationalization of study success indicators
Based on the design of the courses’ online component, four categories of events were created to group similar student activities:
Lecture view event included clicks on learning resources, such as recorded lectures, or opening ‘folders’ of learning resources (group of learning materials).
Forum consumption event included events where students read others’ forum posts.
Forum contribution event included events of actively updating or editing the forum content, such as creating posts, updating posts, editing posts or deleting posts.
Course browsing event included events of viewing the course main page. The Moodle main course page was a gateway to all other resources; it contained a module for displaying important announcements, as well as a ‘block’ for news and a block for updates since students last visited the page. Therefore, this event type reflected students browsing the course or checking course updates (i.e. new lectures, new posts from peers, new announcements and/or assignments).
Starting from these four event categories and related studies (see Sections 2.1–2), we selected study success indicators to be examined in the current study. When examining the literature, our focus was on indicators used in study contexts similar to ours, that is, blended higher education courses (Gašević et al. Citation2016). We did not consider studies that were focused on online courses, since the design (learning activities and assessment) in such courses tends to be different than in blended settings. Likewise, we excluded the literature on massive open online courses (MOOCs), considering numerous differences between MOOC and formal education settings, especially regarding student success prediction (Joksimović et al., Citation2017). Finally, we restricted our focus on indicators that could be derived from data logged by LMSs. In other words, we did not consider custom built learning tools or tailor-made extensions of LMSs, as sources of data for success indicators. The rationale for this decision is twofold: (1) in our study context, the online portion of each course relied on ‘regular’ LMS; and (2) a large majority of blended courses use LMSs as the primary and often only learning platform.
We selected and examined two groups of indicators: (i) general indicators of students’ intensity of interaction with the course’s online component, and (ii) indicators of the intensity of interaction with different online learning resources available through the LMS. The latter group of (course design specific) indicators proven to have higher predictive power than the former group of (course design agnostic) indicators when examined in the context of a single blended course (e.g. Tempelaar, Rienties, and Giesbers Citation2015; Jovanovic et al. Citation2019). However, we expected that indicators from the former group, due to their general nature, would demonstrate more consistent predictive power when examined across several courses.
For each of the aforementioned four event categories, we computed the following three course-design-specific indicators:
The frequency of events of each category represents the overall count of occurrences of events of a particular category; so, we had: the frequency of lecture view events, frequency of forum consumption events, the frequency of forum contribution events, and frequency of course browsing events.
The number of active days stands for the number of days when a student had at least a single event of a particular category. For example, active days of forum contribution refers to the number of days a student has had at least one event of contributing to forums (posted or updated the forums). We introduced this type of indicator as a mean of capturing students’ ‘presence’ in the online component of a course, as well as to neutralize the effect of the students’ tendency to exhibit nonuniform, bursty temporal patterns (i.e. sequences of almost instantaneous events) in interaction with online learning resources (Saqr, Fors, and Tedre Citation2017).
The regularity of events reflects the regularity of student online behavior and was calculated as the entropy of event counts for each event category (e.g. the regularity of forum contribution) as proposed by Jovanovic et al. (Citation2019). More precisely, the calculation was done as follows: (1) we calculated the count of events of a given type (e.g. forum contribution) for each day of the course when the student had at least one event of that type (e.g. at least one forum contribution event), (2) those counts were divided by the total count of events of the given type for the given student in the given course (e.g. the total number of forum contribution events), (3) thus obtained proportions were considered as probabilities of events of the given type (i.e. probability of the forum contribution event) during the days when such events were probable for the given student. Finally, the computed probabilities were used in the formula for Shannon’s entropy (Shannon Citation1948).
In addition to the aforementioned indicators, three general (course design agnostic) activity indicators were calculated: 1. the total number of events, 2. the session count, and 3. the total session duration. The total number of events was calculated as the total number of clicks for all learning-related events (including all event categories). A session was defined as an uninterrupted sequence of learning events where the time gap between any two consecutive events was below the chosen threshold (Jovanovic et al., Citation2017). A time gap of 20 min of inactivity between two consecutive events, corresponding to the 85th percentile of the dataset, was considered a cut-off value for considering a new session. The session duration was calculated as the total time between the first and last event in a session. These indicators were selected as means of summarizing students’ overall level of engagement with online learning activities.
3.4. Statistical analysis
To answer the first research question, Pearson’s correlation coefficient was calculated between grades and the indicators (e.g. lecture view frequency) for each course offering separately. To assure the validity of the computed correlation coefficients, we first checked all variables for normality. Since some of the variables did not follow the normal distribution, we applied the Box–Cox transformation to all variables, thus making their distributions closer to the normal distribution and the relationship closer to linear. Then, a meta-analysis was performed for each indicator to combine the correlation coefficients across all course offerings (each course offering was considered a separate study).Footnote1 The combined correlation coefficient was computed as a weighted average of the correlation coefficients. To obtain accurate weights for each course offering, we used the inverse-variance pooling of Fisher’s z-transformed correlations. A random-effects model was selected for the reporting of the results of individual courses based on the moderate to high level of heterogeneity that was found in most correlations. A random effect model assumes that the effect sizes demonstrate more variance than when drawn from a single population. In other words, the studies do not come from a single population, but rather from a ‘universe’ of populations (Harrer et al. Citation2019; Schwarzer et al., Citation2015). Since several courses exist in the data, the meta-analysis was performed with subgroup analysis using the course as a moderator, and the model results were reported as a mixed-effect model. The mixed effects model pools result for each course with a random-effects model, and fixed effects for the whole model (Schwarzer et al., Citation2015).
The heterogeneity or between study variance (i.e. the extent to which effect sizes vary within a meta-analysis) was used to assess the variability of different indicators among course offerings (RQ2); it was estimated using Sidik-Jonkman estimator (Kurex and Jonkman Citation2007). Higher levels of heterogeneity dilute the confidence interval of the reported results and indicate a lack of consistency. I2 – a popular measure of heterogeneity – was selected as it is not sensitive to changes in the number of studies, and is easy to interpret (I2 = 25%: low heterogeneity, I2 = 50%: moderate heterogeneity, I2 = 75%: substantial heterogeneity) (Higgins et al. Citation2003). The prediction interval was calculated for all variables as a more robust measure of heterogeneity and as an estimate for what is to be expected from the future application of the measure based on the pooled results in the meta-analysis. The prediction interval can be interpreted in a similar way to confidence intervals. That is, if the lower and upper bounds are on the positive side or both bounds on the negative side, we can expect that future applications within similar contexts would have comparable results within the bounds of the prediction interval (ntHout et al. Citation2016). Given the rigor of the prediction interval, we mainly build our conclusions on its values.
To visualize the results of the meta-analysis in an intuitive way that shows the magnitude of correlations and facilitate comparison, we plotted the results using Forest plots. Forest plots offer a summary of findings and statistical significance in a standardized manner that is easy to read. The layout for this study was selected to follow the Cochrane Revman5 style, which is the most common forest plot style (Schriger et al. Citation2010). The vertical line in the center represents the 0, whereas the horizontal lines represent the 95% confidence interval of the correlations for the corresponding course; the box in the middle represents the weight of each study (course offering in our case), the point inside the box representing the effect size. Studies with confidence interval (CI) crossing the 0 line are considered statistically insignificant, studies with both CI bounds on the right side of the 0 line are considered in favor of a statistically positive and significant correlation, whereas studies with both bounds of the CI on the left side are in favor of a statistically significant negative correlation. Detailed forest plots for all examined variables are presented in Appendix 1.
4. Results
4.1. Descriptive statistics
The study included 2385 students from fifteen different courses across four academic years (from first grade to fourth grade) and a total of fifty course offerings. The initial log record, extracted from the LMS, counted 1,052,807 events; after removing the non-learning, infrequent, and teacher events, the final count was 790,956 (). The median number of students per course was 48 and ranged from 41 to 56. The median number of events per course offering (in the final data set) was 15,345 and ranged from 3925 to 36,417. The median number of forum consumption events was 48.5 per student per course offering; the median forum contribution per student per course offering was 50; the median number of sessions per student per course offering was 48, and the median duration of online time was 4.99 h per student per course offering. The median number of variables with positive and statistically significant correlation with grades in all the course offerings was 12 (out of 15; 80%). This number was lowest in the first year (11) and highest in the fourth year (14).
Table 1. Descriptive statistics of all courses.
4.2. Consistency and heterogeneity in success indicators
This section reports the findings for the two research questions across the selected indicators.
4.2.1. Lecture view
shows a forest plot of the meta-analysis, whereas detailed statistics of the effect size, heterogeneity, and prediction intervals are presented in . There was a positive and statistically significant correlation between lecture view frequency and the final course grade; the combined correlation coefficient was 0.28, CI [0.23; 0.32], p < .001 (). The prediction interval was [−0.05; 0.54] and the heterogeneity was I2 = 45%. With a statistically insignificant prediction interval, the lecture view frequency is not expected to always be correlated with students’ academic achievement.
Figure 2. A forest plot of the meta-analysis for the three lecture view indicators (Please, see the appendix for a more detailed forest plot with numbers and subgroup analysis).
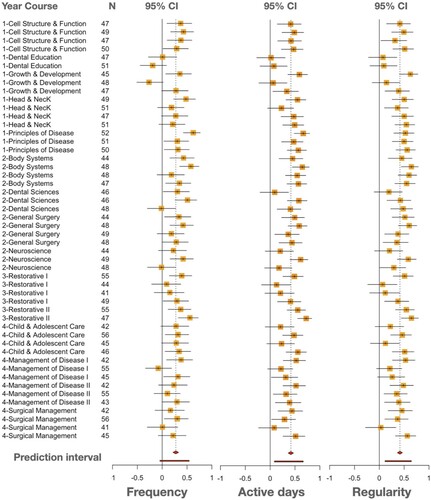
Table 2. Meta-analysis statistics of the lecture view indicators.
The combined correlation coefficient of lecture view active days was higher, i.e. 0.43, CI [0.38; 0.47], p < .001; the prediction interval CI was [0.09; 0.67] and I2 was 51%. The regularity of lecture view showed similar results, the combined correlation coefficient was 0.43 [0.39; 0.47], p < .000, the prediction interval CI was higher [0.12; 0.645], and I2 was 43%.
In summary, the lower bound of the prediction interval of lecture view frequency indicates that this indicator of lecture view may not be the most consistent indicator of a student’s success. On the other hand, the prediction intervals of lecture view active days and regularity were statistically significant i.e. they can be expected to show similar results in future applications within the range of prediction intervals.
There was no evidence that the results differed by course as the test for moderators was statistically insignificant in the three indicators (); that is, the course as the only moderator analyzed in the current study was not found to moderate the association of lecture view active days and regularity with academic performance. The amount of heterogeneity accounted for by the course was rather small: 15% in the frequency indicator, 21.4% in the active days, and 19.2% in the regularity indicator.
4.2.2. Forum consumption
As shown in the forest plot () and the detailed statistics presented in , the combined correlation coefficient between forum consumption frequency and course grade was 0.49, CI [0.44; 0.53], p < .001; the prediction interval was [0.17; 0.71], and I2 was 52%. The combined correlation coefficient of forum consumption active days was lower, i.e. 0.39, CI [0.34; 0.43], p < .001 with a wide range of prediction interval, which was [0.003; 0.67] and I2 = 57%. The combined correlation coefficient of forum consumption regularity was 0.38, CI [0.33; 0.43], p < .001, the prediction interval was [0; 0.67], and I2 was 60%. The results for the frequency of forum consumption suggest that this indicator had the most consistent correlation with academic performance, while active days and regularity showed lower correlations and narrower prediction intervals with lower bounds close or below 0. It is also notable that the heterogeneity was higher in the three indicators for forum consumption than those in their counterparts related to lecture views.
Figure 3. A forest plot for the three forum consumption indicators (Please, see the appendix for a more detailed forest plot with numbers and subgroup analysis).
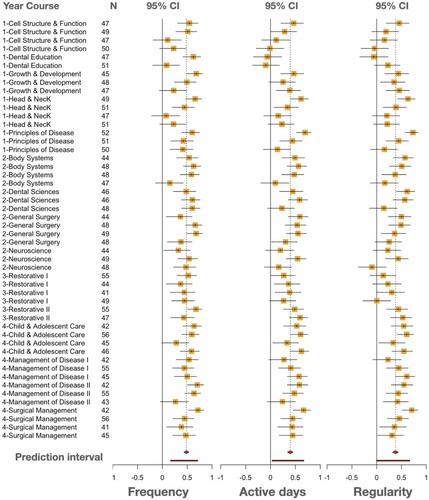
Table 3. Meta-analysis statistics of the forum consumption.
There was no evidence that the results differed by course as the test for moderators was statistically insignificant in the three indicators (); that is the association between the indicators and academic performance was not moderated by course. The amount of heterogeneity accounted for by the courses was rather small: 0% in the frequency indicator, 20% in the active days, and 13.7% in the regularity indicator.
4.2.3. Forum contribution
The three indicators of forum contribution were consistently correlated with grades () and the prediction intervals of active days and regularity were higher than the previous measures (i.e. lecture view and forum consumption), as shown in . The combined correlation coefficient was 0.53 [0.49; 0.58], p < .001 with the prediction interval of [0.13; 0.77], and I2 = 65%. The combined correlation coefficient for active days was 0.45 [0.41; 0.49], p < .001, the prediction interval was [0.17; 0.66], and I2 = 39%. For the regularity, the combined correlation coefficient was 0.41 [0.37; 0.45], p < .001, the prediction interval was [0.11; 0.63] and I2 = 40%.
Figure 4. Forest plot of the three forum contribution indicators (Please, see the appendix for a more detailed forest plot with numbers and subgroup analysis).
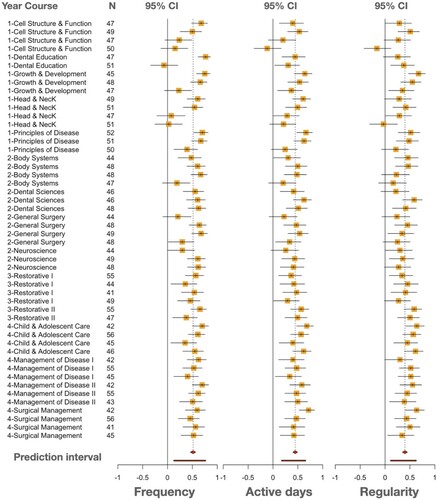
Table 4. Meta-analysis statistics of the contribution indicators.
There was no evidence that the results differed by course as the test for moderators was statistically insignificant in the three indicators (); that is, the association of forum contribution indicators with academic performance was not moderated by course. The amount of heterogeneity accounted for by the course was rather low: 0% in the frequency indicator, 5.6% in the active days’ indicator, and 21.3%, in the regularity indicator.
4.2.4. Course browsing
As detailed in and , the combined correlation coefficient of course browsing frequency was 0.44, CI [0.40; 0.48], p < .001, the prediction interval was [0.15; 0.65] and I2 was 41%. The combined correlation coefficient of active days was 0.46 [0.42; 0.50], p < .001, the prediction interval CI was [0.12; 0.71], and I2 was 55%. The regularity combined correlation coefficient was 0.45 [0.41; 0.50], and p < .001, the prediction interval was [0.09; 0.70], and I2 was 56%. The three indicators were consistently and significantly positive across the course offerings () with positive and significant prediction intervals, implying that future applications of such indicators are expected to yield similar results.
Figure 5. Forest plot for the three course browsing indicators (Please, see the appendix for a more detailed forest plot with numbers and subgroup analysis).
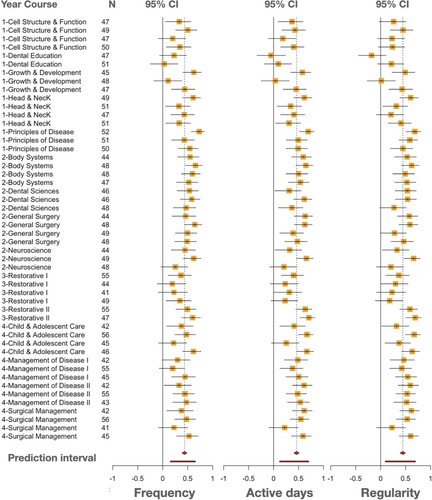
Table 5. Meta-analysis statistics of the course browse indicators.
A moderator analysis showed that the results differed among courses in the active days (QM = 25.7, p = .03) and entropy indicators (QM = 26.7, p = .02). In both indicators, the courses of Dental Education and Restorative tended to have lower correlations. However, there was no statistical evidence that the correlations differed among courses in the frequency indicator. The courses accounted for 28.68% of the heterogeneity in the active days, 30.31% in the entropy, and 26.72% in the frequency indicators.
4.2.5. Activity indicators
As detailed in the forest plot () and in , the combined correlation coefficient of the total number of events was 0.53 [0.50; 0.58], p < .001, the prediction interval CI was [0.22; 0.74], and I2 was 53%. The combined correlation coefficient for total duration was 0.5 [0.45; 0.54], p < .000. The prediction interval was [0.15; 0.73] and I2 was 58%. The combined correlation coefficient for session count was 0.49 [0.45; 0.53], p < .001, the prediction interval was [0.20; 0.70], and I2 47%. The predictive values of activity indicators were higher and more consistent than those of all aforementioned indicators, suggesting their robust future predictive values as indicators of student success.
Figure 6. Forest plot of the three overall activity indicators (Please, see the appendix for a more detailed forest plot with numbers and subgroup analysis).
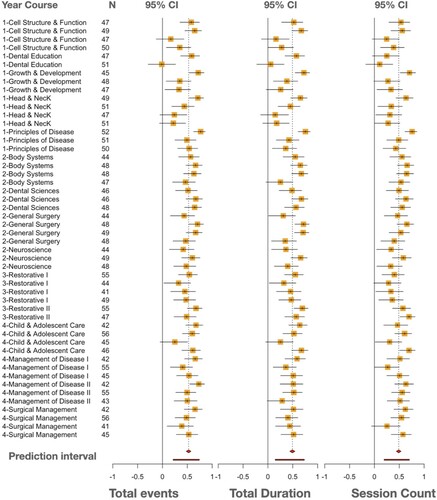
Table 6. Meta-analysis statistics of the overall activity indicators.
There was no evidence that the results differed by course as the test for moderators was statistically insignificant in the three indicators (). The amount of heterogeneity accounted for by the course was rather small: 16.8% in the session count, 0% in total duration, and 0% in the total events.
5. Discussion
Many studies in learning analytics report results based on the analysis of several cohorts without compiling or aggregating the results using methods that would consider heterogeneity between the studied cohorts or present a weighted estimation of the effect size (e.g. Andres et al. Citation2017, Citation2018). Often, heterogeneity is present among cohorts recruited for a particular study. This makes pooling all subjects into one sample far from optimal. This study aimed at examining if and to what extent predictors of student study success are portable across a homogenous set of courses within the same discipline. To this end, we used single paper meta-analysis as a statistical method to pool multiple courses and estimate the future predictive performance of the selected set of indicators, as well as to estimate the level of certainty or confidence in the value of each indicator.
5.1. Consistent indicators of student success
The results showed that all examined indicators had a statistically significant combined correlation coefficient with grades which ranged from r = 0.27, p > .001 in the ‘frequency of lecture view’ to r = 0.52, p > .001 in the ‘total event count’. This implies that all indicators could play a role in developing predictive models of student success for courses with PBL or similar designs. However, using the prediction interval, which estimates the future certainty given the heterogeneity of the results, one can get a better idea about how far these results are expected to replicate in the future applications of an indicator. Therefore, we recommend prioritizing the prediction interval when making any conclusions about the meta-analysis results.
The indicators of lecture and forum read (frequency of lecture view, active lecture view days, forum consume entropy, active forum consume days) showed negative or small lower bounds of prediction intervals, which indicates lower reliability of such indicators in future applications. This may be due to the fact that the LMS captures the download of a lecture or the opening of a forum thread and not the actual reading or studying. All other indicators were found to have had a positive and statistically significant prediction interval with the lowest lower bound (0.11) in forum contribution entropy, and the highest upper bound (0.77) in forum contribution active days. These findings suggest that the aforementioned learning-design-aware indicators (e.g. ‘forum’ indicators and ‘total activity’) are useful predictors of student success in educational institutions offering courses with a similar design (in our case, collaborative learning as an essential part of course design). These findings also emphasize the portability of indicators based on forum contributions as well as course browsing. This is in line with previous research results that have highlighted the value of aligning learning indicators to learning design (Bergdahl et al. Citation2020; Mangaroska and Giannakos Citation2019; Saqr, Viberg, and Vartiainen Citation2020). However, our findings extend such findings to the possibility of future replicability at least within a similar context.
Similarly, the active days and regularity indicators showed comparable predictive power; such indicators were consistently and positively correlated with student performance in all variables, indicating their reliability in reflecting students’ engagement with online activities and consequently, academic success. There is growing evidence that these indicators are at least on par with – and sometimes better than – often used frequency-based indicators (Jovanovic et al. Citation2019; Jovanović et al. Citation2021; Saqr, Fors, and Tedre Citation2017). Our findings replicate previous findings and suggest future replicability of such findings in similar contexts.
Interestingly, indicators of the overall activity level (i.e. total events, session count, and online duration) had the highest combined correlation coefficient and the highest prediction intervals. Therefore, we expect these predictors to be the most reliable and most likely to replicate in future applications. While prior research has identified the value of such predictors (Bergdahl et al. Citation2020; Mangaroska and Giannakos Citation2019), their consistency and reliability across several courses have rarely been assessed. In summary, our study casts doubt on the portability or the replicability of indicators based on lecture view events; replicate the findings related to the forum contribution based indicators and emphasize their future replicability; confirms the value of the design-specific indicators (e.g. regularity of different kinds of events); and sheds new light on the reliability of the indicators of overall activity that proved the most reliable and reproducible across course iterations.
5.2. Variability
Our second research question aimed at estimating the heterogeneity of the results, i.e. variability in the correlation between grades and the study success indicators, and what this heterogeneity indicates about future replicability. Our findings demonstrate that heterogeneity within a homogeneous dataset like ours is moderate and within acceptable ranges for most indicators (I2 median = 51.8%). The findings also show that within the same event type (e.g. forum consumption), the heterogeneity can be high when the indicator is based on frequency (and hence weaken the future predictability of the variable) or low when using active days as a ‘normalizing’ indicator against repetitive and excessive clicking. As such, we can conclude that a moderate amount of variability should be expected, and any perfect consistency is far from achievable even in a homogeneous setting e.g. (Saqr and López-Pernas Citation2022). Our results indicate that the course has small to no effect – except in course browsing – on the results in most indicators. The heterogeneity in course browsing was mainly due to the fact that different teachers used the course front page in different ways. Some teachers used it for all announcements, communications, and listing course progress, and others did not.
While heterogeneity has been reported in all disciplines, it may be more evident in educational settings. As stated by Glass (Citation1976),
In education the findings are fragile; they vary across contexts, classes of subjects, and countless other factors. Where ten studies might suffice to resolve a matter in biology, ten studies on computer assisted instruction or reading may fail to show the same pattern of results twice. (3)
The same issues exist in learning analytics research. Scholars stress that even when similar predictor variables have been used, the results have not always been consistent (Conjin et al., Citation2017). Inconsistencies have been, for example, found in the amount of explained variance in learning outcomes (e.g. final grades). This has been explained by, for example, the differences in the course and disciplinary context (Gašević et al. Citation2016) and student individual differences (e.g. their level of self-regulation as shown by Joksimović et al. Citation2015; Jovanović et al. Citation2021). What our study adds, is that even within the same context, and within a homogenous group of courses, heterogeneity of results is an issue. This emphasizes the importance of accounting for and measuring the heterogeneity using adequate and rigorous methods to ensure the robustness and generalizability of findings and conclusions.
5.3. Limitations and future directions
A possible limitation of the conducted research is in the selection and computation of the indicators. There is much room for improvement in calculation of the frequency, regularity and active days indicators, e.g. an active day may be defined based on the spike in the distribution of daily event counts as done in (Kizilcec et al., Citation2020), or regularity may be based on a measure different from entropy (e.g. frequency of change in the pattern of engagement as used in (Jovanovic et al. Citation2019)). Another limitation may be that the indicators/predictors were considered in isolation. By relying on correlations, we could not account for the mutual interaction of different indicators and their joint effect on the outcome (student success). Next, we have used a considerable number of courses in the institution, as such some students have participated in more than one course. However, since we are proposing our methods to be applied within the same institution, the situation would be similar within any institution where the method could be applied. We should also be careful when considering ‘grades’ to be the only indicator of student success. Such success can also mean the development of student transferable lifelong learning skills, including their self-regulated learning skills (e.g. time management and goal setting skills), collaborative learning skills as well as critical thinking skills, all of which are critical for their success in future studies and work. It should be also mentioned that the multilevel meta-analysis used in this study is mathematically and conceptually very close to mixed effects models (Fernández-Castilla, Jamshidi, and Declercq Citation2020). Even though a mixed-effect model may seem appropriate as an alternative to meta-analysis, our intention in this study was not to develop a predictive algorithm but rather to estimate the individual predictive power of each variable and the consistency thereof.
Next, while our results offer the values and statistical significance of Pearson correlation, we stress that the readers rely primarily on the prediction intervals. Prediction intervals are far more robust, offer an estimation for the future predictability, and therefore, reflect future uncertainty of the results (ntHout et al. Citation2016). Following the prediction intervals helps obtain more realistic expectations and limits the possibility of inflation of the magnitude of results.
We should also mention that our study did not consider demographic factors e.g. race, ethnicity, gender, and socio-economic status. Previous research has indicated that such demographic factors offer information about students’ performance. For instance, a meta-analysis of gender differences in academic achievement by Voyer and Voyer (Citation2014) found females to perform slightly better than males. The female advantage in performance were moderated by country of origin and race. However, as Schneider and Preckel (Citation2017) noted in a large meta-analysis of variables associated with achievement ‘Students’ strategies are more directly associated with achievement than students’ personality or personal context’ (595). The authors also note that such demographic factors cannot be altered or acted upon, and therefore, offer little value for intervention.
Our study has obvious limitations regarding the scope of data collected i.e. being limited only to data available in a typical LMS. As students learn, they engage in a vast variety of activities that are related to learning e.g. watching educational videos on YouTube, browsing Wikipedia, or reading a scientific article. We did not have access to data about such (out of LMS) activities, and therefore, they could not be accounted for. Furthermore, the collection of such data is limited because of privacy concerns, and protections need to be in place for such data to be a subject of research. Another limitation that may constrain the generalizability of our results is that our dataset was relatively homogeneous (i.e. fairly similar context and course design). It is, therefore, expected that courses with different design, subject, or context have variability, or heterogeneity higher than our reported results. However, this issue remains a matter of future research and conclusions cannot be made based on our results (Gašević et al. Citation2016).
5.4. Implications
We have demonstrated how single paper meta-analysis can be used for estimation of the consistency, predictability, portability, and variability of effect sizes across different cohorts. The application of this method to pool the results may offer institutions a solution for strengthening their data-driven decisions. The use of meta-analysis is expected to embolden trust in the consistent predictors, leading to increased reliance on such indicators and better decision making. Furthermore, it resolves the uncertainty about the inconsistent predictors, so that institutions could improve the methods of capturing students’ online activities and avoid the cost of making decisions based on shady evidence. The education research community can apply some related established statistical methods such as meta-analysis of relative risk, i.e. finding which indicator amounts to higher relative risk of failing a program; meta-analysis of survival analysis i.e. time before a student drops out for drop-out prevention; and meta-analysis for intervention or network meta-analysis for e.g. different forms of support.
In summary, the methods used in this study are critical for scaling up learning analytics research and enabling broader use of learning analytics in practice, which has been identified as one of the critical gaps (Ochoa, Knight, and Wise Citation2020). While we have presented a meta-analysis of correlations coefficients, a future application may be to estimate the odds of a student failing a course or the relative risk and pool the evidence across all courses in a similar fashion (meta-analysis) to create risk estimates of certain online behaviors. Such relative risk could help in quantifying certainty of expectations.
Supplementary Material
Download MS Word (13.1 MB)Disclosure statement
No potential conflict of interest was reported by the author(s).
Notes
1 We use the following naming conventions along the manuscript: A course offering is a single instance of the course; we also use the term study to refer to a single course offering, while a course is a group of offerings of the same course.
References
- Agudo-Peregrina, Á, S. Iglesias-Pradas, M. Conde-González, and Á Hernández-García. 2014. “Can we Predict Success from Log Data in VLEs? Classification of Interactions for Learning Analytics and Their Relation with Performance in VLE-Supported F2F and Online Learning.” Computers in Human Behavior 31 (1): 542–50. doi:10.1016/j.chb.2013.05.031.
- Alyahyan, E., and D. Düştegör. 2020. “Predicting Academic Success in Higher Education: Literature Review and Best Practices.” International Journal of Educational Technology in Higher Education 17: 3. doi:10.1186/s41239-020-0177-7.
- Andres, J. M. L., R. Baker, D. Gasevic, G. Siemens, S. Crossley, and S. Joksimovic. 2018. “Studying MOOC Completion at Scale Using the MOOC Replication Framework.” In Proceedings of LAK’18, March 7–9. 2018, Sydney, NSW, Australia. doi:10.1145/3170358.3170369.
- Andres, J. M. L., R. S. Baker, D. Gašević, G. Siemens, and C. A. Spann. 2017. “Replicating 21 Findings on Student Success in Online Learning.” Technology Instruction Cognition and Learning 10 (4): 313–33.
- Bergdahl, N., J. Nouri, T. Karunaratne, M. Afzaal, and M. Saqr. 2020. “Learning Analytics for Blended Learning: A Systematic Review of Theory, Methodology, and Ethical Considerations.” International Journal of Learning Analytics and Artificial Intelligence for Education 2 (2): 46–79. doi:10.3991/ijai.v2i2.17887.
- Bernard, R. M., P. C. Abrami, E. Borokhovski, C. A. Wade, R. M. Tamim, M. A. Surkes, and E. C. Bethel. 2009. “A Meta-Analysis of Three Types of Interaction Treatments in Distance Education.” Review of Educational Research 79 (3): 1243–89. doi:10.3102/0034654309333844.
- Brooks, C., and C. Thompson. 2017. “Predictive Modelling in Teaching and Learning.” In The Handbook of Learning Analytics, edited by C. Lang, G. Siemens, A. F. Wise, and D. Gašević, 61–8. Alberta: Society for Learning Analytics Research (SoLAR).
- Chen, G., V. Rolim, R. Ferreira Mello, and D. Gašević. 2020. “Let’s Shine Together! A Comparative Study Between Learning Analytics and Educational Data Mining.” In Proceedings of the Tenth International Conference on Learning Analytics & Knowledge, 544–53. New York: ACM. doi:10.1145/3375462.3375500
- Conijn, R., C. Snijders, A. Kleingeld, and U. Matzat. 2017. “Predicting Student Performance from LMS Data: A Comparison of 17 Blended Courses Using Moodle LMS.” IEEE Transactions on Learning Technologies 10 (1): 17–29. doi:10.1109/TLT.2016.2616312.
- Da, C., R. Hatala, and R. Brydges. 2011. “Technology-Enhanced Simulation for Health Professions Education: A Systematic Review and Meta-Analysis.” Jama 306 (9): 978–988. doi:10.1001/jama.2011.1234.
- Dawson, S., D. Gašević, J. Siemens, and S. Joksimovic. 2014. “Current State and Future Trends: A Citation Network Analysis of the Learning Analytics Field.” In Proceedings of the fifth International Conference on Learning Analytics and Knowledge, ACM (2014), 231–240. doi:10.1145/2567574.2567585.
- Donnelly, R. 2010. “Harmonizing Technology with Interaction in Blended Problem-Based Learning.” Computers & Education 54 (2): 350–9. doi:10.1016/j.compedu.2009.08.012.
- Fernández-Castilla, B., L. Jamshidi, and L. Declercq. 2020. “The Application of Meta-Analytic (Multi-Level) Models with Multiple Random Effects: A Systematic Review.” Behavior Research Methods 52: 2031–52. doi:10.3758/s13428-020-01373-9.
- Finnegan, C., L. Morris, and K. Lee. 2008. “Differences by Course Discipline on Student Behavior, Persistence, and Achievement in Online Courses of Undergraduate General Education. Journal of College Student Retention, Research, Theory and Practice 10 (1): 39–54. doi:10.2190/CS.10.1.d.
- Gašević, D., S. Dawson, T. Rogers, and D. Gasevic. 2016. “Learning Analytics Should Not Promote One Size Fits All: The Effects of Instructional Conditions in Predicting Learning Success.” The Internet and Higher Education 28: 68–84. doi:10.1016/j.iheduc.2015.10.002.
- Glass, G. 1976. “Primary, Secondary, and Meta-Analysis of Research.” Educational Researcher 5 (10): 3–8.
- Gurevitch, J., J. Koricheva, S. Nakagawa, and G. Stewart. 2018. “Meta-Analysis and the Science of Research Synthesis.” Nature 555 (7695): 175–82. doi:10.1038/nature25753.
- Hagger, M. S., N. L. D. Chatzisarantis, H. Alberts, C. O. Anggono, C. Batailler, A. R. Birt, R. Brand, et al. 2016. “A Multilab Preregistered Replication of the Ego-Depletion Effect.” Perspectives on Psychological Science 11 (4): 546–73. doi:10.1177/1745691616652873.
- Hardy, R. J., and S. G. Thompson. 1998. “Detecting and Describing Heterogeneity in Meta-Analysis.” Statistics in Medicine 17 (8): 841–56.
- Harrer, M., P. Cuijpers, T. Furukawa, and D. Ebert. 2019. Doing Meta-Analysis in R: A Hands-on Guide. doi:10.5281/zenodo.2551803.https://bookdown.org/MathiasHarrer/Doing_Meta_Analysis_in.
- Higgins, J. P. T., and S. G. Thompson. 2002. “Quantifying Heterogeneity in a Meta-Analysis.” Statistics in Medicine 21 (11): 1539–58.
- Higgins, J. P., S. Thompson, J. Deeks, and D. Altman. 2003. “Measuring Inconsistency in Meta-Analyses.” BMJ 327 (7414): 557–60. doi:10.1136/bmj.327.7414.557.
- Ilgen, J. S., J. Sherbino, and D. A. Cook. 2013. “Technology-Enhanced Simulation in Emergency Medicine: A Systematic Review and Meta-Analysis.” Academic Emergency Medicine 20 (2): 117–27. doi:10.1111/acem.12076.
- Jayaprakash, S. M., E. W. Moody, E. J. M. Lauría, J. R. Regan, and J. D. Baron. 2014. “Early Alert of Academically At-Risk Students: An Open Source Analytics Initiative.” Journal of Learning Analytics 1 (1): 6–47.
- Jeong, H., C. E. Hmelo-Silver, and K. Jo. 2019. “Ten Years of Computer-Supported Collaborative Learning: A Meta-Analysis of CSCL in STEM Education During 2005–2014.” Educational Research Review 28 (April): 100284. doi:10.1016/j.edurev.2019.100284.
- Joksimović, S., D. Gašević, T. M. Loughin, V. Kovanović, and M. Hatala. 2015. “Learning at Distance: Effects of Interaction Traces on Academic Achievement.” Computers & Education 87: 204–17. doi:10.1016/j.compedu.2015.07.002.
- Joksimović, S., O. Poquet, V. Kovanović, N. Dowell, C. Mills, D. Gašević, S. Dawson, A. C. Graesser, and C. Brooks. 2017. “How Do We Model Learning at Scale? A Systematic Review of Research on MOOCs.” Review of Educational Research, doi:10.3102/0034654317740335.
- Jovanović, J., D. Gašević, S. Dawson, A. Pardo, and N. Mirriahi. 2017. “Learning Analytics to Unveil Learning Strategies in a Flipped Classroom.” The Internet and Higher Education 33 (4): 74–85. doi:10.1016/j.iheduc.2017.02.001.
- Jovanovic, J., N. Mirriahi, D. Gašević, S. Dawson, and A. Pardo. 2019. “Predictive Power of Regularity of Pre-Class Activities in a Flipped Classroom.” Computers & Education 134: 156–68.
- Jovanović, J., M. Saqr, S. Joksimović, and D. Gašević. 2021. “Students Matter the Most in Learning Analytics: The Effects of Internal and Instructional Conditions in Predicting Academic Success.” Computers & Education 172 (April): 104251. doi:10.1016/j.compedu.2021.104251.
- Kizilcec, R. F., J. Reich, M. Yeomans, C. Dann, E. Brunskill, G. Lopez, S. Turkay, J. J. Williams, and D. Tingley. 2020. “Scaling Up Behavioral Science Interventions in Online Education.” Proceedings of the National Academy of Sciences. doi:10.1073/pnas.1921417117.
- Klein, R. A., M. Vianello, F. Hasselman, B. G. Adams, R. B. Adams Jr, S. Alper, M. Aveyard, J. R. Axt, M. T. Babalola, and Š Bahník. 2018. “Many Labs 2: Investigating Variation in Replicability Across Samples and Settings.” Advances in Methods and Practices in Psychological Science 1 (4): 443–90.
- Kurex, S., and J. Jonkman. 2007. “A Comparison of Heterogeneity Variance Estimators in Combining Results of Studies.” Statistics in Medicine 26 (9): 1964–81.
- Lou, Y., P. C. Abrami, S. Apollonia, and S. D’Apollonia. 2001. “Small Group and Individual Learning with Technology: A Meta-Analysis.” Review of Educational Research 71 (3): 449–521. doi:10.3102/00346543071003449.
- Lust, G., J. Elen, and G. Clarebout. 2013. “Students’ Tool-Use Within a Web Enhanced Course: Explanatory Mechanisms of Students’ Tool-Use Pattern.” Computers in Human Behavior 29 (5): 2013–21. doi:10.1016/j.chb.2013.03.014.
- Mangaroska, K., and M. Giannakos. 2019. “Learning Analytics for Learning Design: A Systematic Literature Review of Analytics-Driven Design to Enhance Learning.” IEEE Transactions on Learning Technologies 12 (4): 516–34. doi:10.1109/TLT.2018.2868673.
- McShane, B. B., and U. Böckenholt. 2017. “Single-Paper Meta-Analysis: Benefits for Study Summary, Theory Testing, and Replicability.” Journal of Consumer Research 43 (6): 1048–63. doi:10.1093/jcr/ucw085.
- ntHout, J., J. P. A. Ioannidis, M. M. Rovers, and J. J. Goeman. 2016. “Plea for Routinely Presenting Prediction Intervals in Meta-Analysis.” BMJ Open 6: 7. doi:10.1136/bmjopen-2015-010247.
- Ochoa, X., S. Knight, and A. Wise. 2020. “Learning Analytics Impact: Critical Conversations on Relevance and Social Responsibility.” Journal of Learning Analytics 7 (3): 1–5. doi:10.18608/jla.2020.73.1.
- Open Science Collaboration. 2015. “Estimating the Reproducibility of Psychological Science.” Science 349 (6251): aac4716. doi:10.1126/science.aac4716.
- Papamitsiou, Z., and A. A. Economides. 2016. “Learning Analytics for Smart Learning Environments: A Meta-Analysis of Empirical Research Results from 2009 to 2015.” In Learning, Design, and Technology, edited by Spector M., Lockee B., and Childress M. (eds.), 1–23. Cham: Springer.
- Pina, A. 2012. “An Overview of Learning Management Systems.” In Virtual Learning Environments: Concepts, Methodologies, Tools and Applications, 33–51. Louisville: Sullivan Univ. Syst. doi:10.4018/978-1-4666-0011-9.ch103
- Saltmarsh, J., E. Zlotkowski, and E. L. Hollander. 2011. “Indicators of Engagement.” Higher Education and Democracy: Essays on Service-Learning and Civic Engagement, 285–302. doi:10.1007/978-1-4615-0885-4_3.
- Saqr, M., U. Fors, and M. Tedre. 2017. “How Learning Analytics Can Early Predict Under-Achieving Students in a Blended Medical Education Course.” Medical Teacher 39 (7): 757–67.
- Saqr, M., and S. López-Pernas. 2021a. “Modelling Diffusion in Computer-Supported Collaborative Learning: A Large Scale Learning Analytics Study.” International Journal of Computer-Supported Collaborative Learning 16 (4): 441–83.
- Saqr, M., and S. López-Pernas. 2022. “The Curious Case of Centrality Measures: A Large-Scale Empirical Investigation.” Journal of Learning Analytics 9 (1): 13–31. doi:10.18608/jla.2022.7415.
- Saqr, M., O. Viberg, and H. Vartiainen. 2020. “Capturing the Participation and Social Dimensions of Computer-Supported Collaborative Learning Through Social Network Analysis: Which Method and Measures Matter?” International Journal of Computer Supported Collaborative 15: 227–48. doi:10.1007/s11412-020-09322-6.
- Schneider, M., and F. Preckel. 2017. “Variables Associated with Achievement in Higher Education: A Systematic Review of Meta-Analyses.” Psychological Bulletin 143 (6): 565–600.
- Schriger, D., D. Altman, J. Vetter, T. Heafner, and D. Moher. 2010. “Forest Plots in Reports of Systematic Reviews: A Cross-Sectional Study Reviewing Current Practice.” International Journal of Epidemiology 39 (2): 421–9. doi:10.1093/ije/dyp370.
- Schwarzer, G., J. Carpenter, and G. Rücker. 2015. Meta-Analysis with R. Cham: Springer International Publishing. doi:10.1007/978-3-319-21416-0
- Shannon, C. E. 1948. “A Mathematical Theory of Communication.” Bell System Technical Journal 27 (3): 379–423. doi:10.1002/j.1538-7305.1948.tb01338.x.
- Siemens, G., S. Dawson, and G. Lynch. 2014. Improving the quality and productivity of the higher education sector — Policy and strategy for systems-level deployment of learning analytics. Office of Learning and Teaching, Australian Government, Canberra, Australia.
- Tempelaar, D. T., B. Rienties, and B. Giesbers. 2015. “In Search for the Most Informative Data for Feedback Generation: Learning Analytics in a Data-Rich Context.” Computers in Human Behavior 47: 157–67.
- Thompson, S. G. 1994. “Systematic Review: Why Sources of Heterogeneity in Meta-Analysis Should be Investigated.” BMJ 309 (6965): 1351–5.
- Viberg, O., M. Hatakka, O. Bälter, and A. Mavroudi. 2018. “The Current Landscape of Learning Analytics in Higher Education.” Computers in Human Behavior 89: 98–110.
- Voyer, D., and S. D. Voyer. 2014. “Gender Differences in Scholastic Achievement: A Meta-Analysis.” Psychological Bulletin 140 (4): 1174–204.
- Walker, E., A. Hernandez, and M. Kattan. 2008. “Meta-Analysis: Its Strengths and Limitations.” Cleveland Clinic Journal of Medicine 75 (6): 431–9. doi:10.3949/ccjm.75.6.431. PMID: 18595551.
- Wecker, C., and F. Fischer. 2014. “Where is the Evidence? A Meta-Analysis on the Role of Argumentation for the Acquisition of Domain-Specific Knowledge in Computer-Supported Collaborative Learning.” Computers & Education 75: 218–28. doi:10.1016/j.compedu.2014.02.016.
- Zacharis, N. Z. 2015. “A Multivariate Approach to Predicting Student Outcomes in Web-Enabled Blended Learning Courses.” The Internet and Higher Education 27: 44–53. doi:10.1016/j.iheduc.2015.05.002.